4080
Social isolation in rats as a model for schizophrenia - a functional connectivity approach1Translational Imaging, Department of Neuroimaging, Central Institute of Mental Health, Medical Faculty Mannheim / Heidelberg University, Mannheim, Germany, 2Animal Models in Psychiatry, Central Institute of Mental Health, Medical Faculty Mannheim / Heidelberg University, Mannheim, Germany
Synopsis
Post-weaning social isolation rats are a widely used translational animal model for schizophrenia based on its typical schizophrenic-like behavioral alterations. Nevertheless, effects of isolation on functional brain connectivity are highly understudied. We used resting-state functional magnetic resonance imaging with seed-based and graph analyses to investigate effects of social isolation in rats on brain connectivity. Our major findings consistently demonstrated dysmodularity, hypofrontality, posterior hyperconnectivity and reorganization of the somatosensory cortex. These features resemble alterations of functional brain connectivity commonly observed in schizophrenic patients and other translational animal models, underlining the potential use of isolated rats as a translational model of schizophrenia.
Purpose
Social isolation of mammals in early-life affects brain development and adult behavior and may contribute to psychiatric disorders, such as depression or schizophrenia 1,2. Post-weaning social isolation (PWSI) of rodents produces reproducible long-term behavioral and neurochemical changes including neophobia, impaired sensorimotor gating and alterations of the dopaminergic systems. These changes strongly resemble core features of schizophrenia 2, making PWSI rats an important translational model for the disease. Nevertheless, studies focusing on resting-state brain networks – which are highly affected by schizophrenia in humans 3,4 – are lacking in this animal model. In the current study we aimed to explore the effects of PWSI on functional brain connectivity in rats using resting-state functional magnetic resonance imaging (rs-fMRI) and compared them to effects of schizophrenia on brain networks in humans and different animal models.Methods
Results
Global graph metrics of the functional approach (Figure 1) revealed a significantly lower modularity, a lower small world index and a lower global clustering coefficient for the area under the curve in socially isolated rats compared to healthy controls (HC) (all p < 0.05). In the seed-based analysis (all results multiple comparison corrected for pFWE < 0.05), two frontal brain regions, orbitofrontal (OF) and infralimbic cortex (IL), demonstrated a significantly lower functional connectivity (fc) to areas in the primary somatosensory cortex (S1) and the OF in PWSI rats, respectively (Figure 2, A-B). In contrast, anterodorsal hippocampus (HcAD) exhibited a significantly higher functional connectivity to a region in the periaqueductal grey (PAG) and the superior colliculus (SC) for PWSI rats compared to HC (Figure 3, A). The most notable difference however was found for the visual cortex (V), showing a significantly higher connectivity to a large bilateral region in S1 in socially isolated rats (Figure 3, C). Finally, S1 itself revealed bidirectional fc alterations, being higher connected to subregions in insular cortex, S1 and posterodorsal hippocampus (Figure 3, B) and lower connected to a left-hand S1-subregion (Figure 2, C). Local graph metrics of the anatomical approach confirmed seed-based results showing decreased degree, strength and betweenness centrality (BCI) in frontal brain regions (frontal association cortex and OF) and respectively increased local metrics in PAG, SC, S1 and primary motor cortex for the isolated animals (Figure 4, A-F).Discussion
This study highlights several changes in functional brain connectivity in PWSI rats which emphasize the similarity of the model to abnormalities frequently found in schizophrenia: Graph analysis demonstrated dysmodularity and a lower small-world index which fall in line with a high number of similar findings in human schizophrenics 13-15. Furthermore we found several changes underlining hypofrontality, a well-known trait in schizophrenic patients 16. Interestingly enough, hypofrontality and posterior hyperactivity – as observed in our study – were recently identified as novel biomarkers of early schizophrenia in a different preclinical neurodevelopmental rat model, the methylazoxymethanol acetate (MAM) rat model of schizophrenia 17. Higher connectivity of the periaqueductal grey should be seen in context of its involvement in defensive behavior 18 and anxiety processing 19, aspects also regularly affected by schizophrenia. The bidirectional functional connectivity changes in S1 could reflect complex sensory processing deficits in schizophrenic patients as shown in several previous studies 20-22. In summary, this study supports the use of PWSI rats for modeling important core symptoms of schizophrenia. Nevertheless it should be taken into account that no single animal model can replicate all the symptoms of such a heterogeneous disorder as schizophrenia.Acknowledgements
This study was partially supported by the German Research Foundation (DFG SA 1869/11-2) within the priority programme (SPP1629) "Thyroid Trans Act" (AS and JR). The funding source did not influence any stage of this project. The authors thank Felix Hörner for his excellent technical assistance.References
1. Rapoport J, Giedd J, Gogtay N. Neurodevelopmental model of schizophrenia: update 2012. Mol Psychiatry 2012;17:1228-38.
2. Fone KC, Porkess MV. Behavioural and neurochemical effects of post-weaning social isolation in rodents-relevance to developmental neuropsychiatric disorders. Neuroscience and biobehavioral reviews 2008;32:1087-102.
3. Argyelan M, Ikuta T, DeRosse P, et al. Resting-state fMRI connectivity impairment in schizophrenia and bipolar disorder. Schizophrenia bulletin 2014;40:100-10.
4. Yu Q, Allen EA, Sui J, Arbabshirani MR, Pearlson G, Calhoun VD. Brain connectivity networks in schizophrenia underlying resting state functional magnetic resonance imaging. Curr Top Med Chem 2012;12:2415-25.
5. Gass N, Schwarz AJ, Sartorius A, et al. Sub-Anesthetic Ketamine Modulates Intrinsic BOLD Connectivity Within the Hippocampal-Prefrontal Circuit in the Rat. Neuropsychopharmacology 2014;39:895-906.
6. Gass N, Weber-Fahr W, Sartorius A, et al. An acetylcholine alpha7 positive allosteric modulator rescues a schizophrenia-associated brain endophenotype in the 15q13.3 microdeletion, encompassing CHRNA7. Eur Neuropsychopharmacol 2016;26:1150-60.
7. Littow H, Huossa V, Karjalainen S, et al. Aberrant Functional Connectivity in the Default Mode and Central Executive Networks in Subjects with Schizophrenia - A Whole-Brain Resting-State ICA Study. Frontiers in psychiatry 2015;6:26.
8. Beckmann CF, C. M, N. F, S.M. S. Group comparison of resting-state FMRI data using multi-subject ICA and dual regression. 15th Annual Meeting of Organization of Human Brain Mapping. San Francisco, CA2009.
9. Filippini N, MacIntosh BJ, Hough MG, et al. Distinct patterns of brain activity in young carriers of the APOE-epsilon4 allele. Proceedings of the National Academy of Sciences of the United States of America 2009;106:7209-14.
10. Schwarz AJ, Danckaert A, Reese T, et al. A stereotaxic MRI template set for the rat brain with tissue class distribution maps and co-registered anatomical atlas: application to pharmacological MRI. NeuroImage 2006;32:538-50.
11. Smith SM, Nichols TE. Threshold-free cluster enhancement: addressing problems of smoothing, threshold dependence and localisation in cluster inference. NeuroImage 2009;44:83-98.
12. Rubinov M, Sporns O. Complex network measures of brain connectivity: uses and interpretations. NeuroImage 2010;52:1059-69.
13. Alexander-Bloch AF, Gogtay N, Meunier D, et al. Disrupted modularity and local connectivity of brain functional networks in childhood-onset schizophrenia. Frontiers in systems neuroscience 2010;4:147.
14. David AS. Dysmodularity: a neurocognitive model for schizophrenia. Schizophrenia bulletin 1994;20:249-55.
15. Micheloyannis S. Graph-based network analysis in schizophrenia. World journal of psychiatry 2012;2:1-12.
16. Hill K, Mann L, Laws KR, Stephenson CM, Nimmo-Smith I, McKenna PJ. Hypofrontality in schizophrenia: a meta-analysis of functional imaging studies. Acta psychiatrica Scandinavica 2004;110:243-56.
17. Kaneko G, Sanganahalli BG, Groman SM, et al. Hypofrontality and Posterior Hyperactivity in Early Schizophrenia: Imaging and Behavior in a Preclinical Model. Biological psychiatry 2016.
18. Deng H, Xiao X, Wang Z. Periaqueductal Gray Neuronal Activities Underlie Different Aspects of Defensive Behaviors. The Journal of neuroscience : the official journal of the Society for Neuroscience 2016;36:7580-8.
19. Camplesi M, Jr., Bortoli VC, Soares Vde P, Nogueira RL, Zangrossi H, Jr. Dorsal periaqueductal gray stimulation facilitates anxiety-, but not panic-related, defensive responses in rats tested in the elevated T-maze. Brazilian journal of medical and biological research = Revista brasileira de pesquisas medicas e biologicas 2012;45:1025-30.
20. Javitt DC. Sensory Processing in Schizophrenia: Neither Simple nor Intact. Schizophrenia bulletin 2009;35:1059-64.
21. Andrade GN, Butler JS, Peters GA, Molholm S, Foxe JJ. Atypical visual and somatosensory adaptation in schizophrenia-spectrum disorders. Translational psychiatry 2016;6.
22. Teale P, Pasko B, Collins D, Rojas D, Reite M. Somatosensory timing deficits in schizophrenia. Psychiatry Res 2013;212:73-8.
Figures
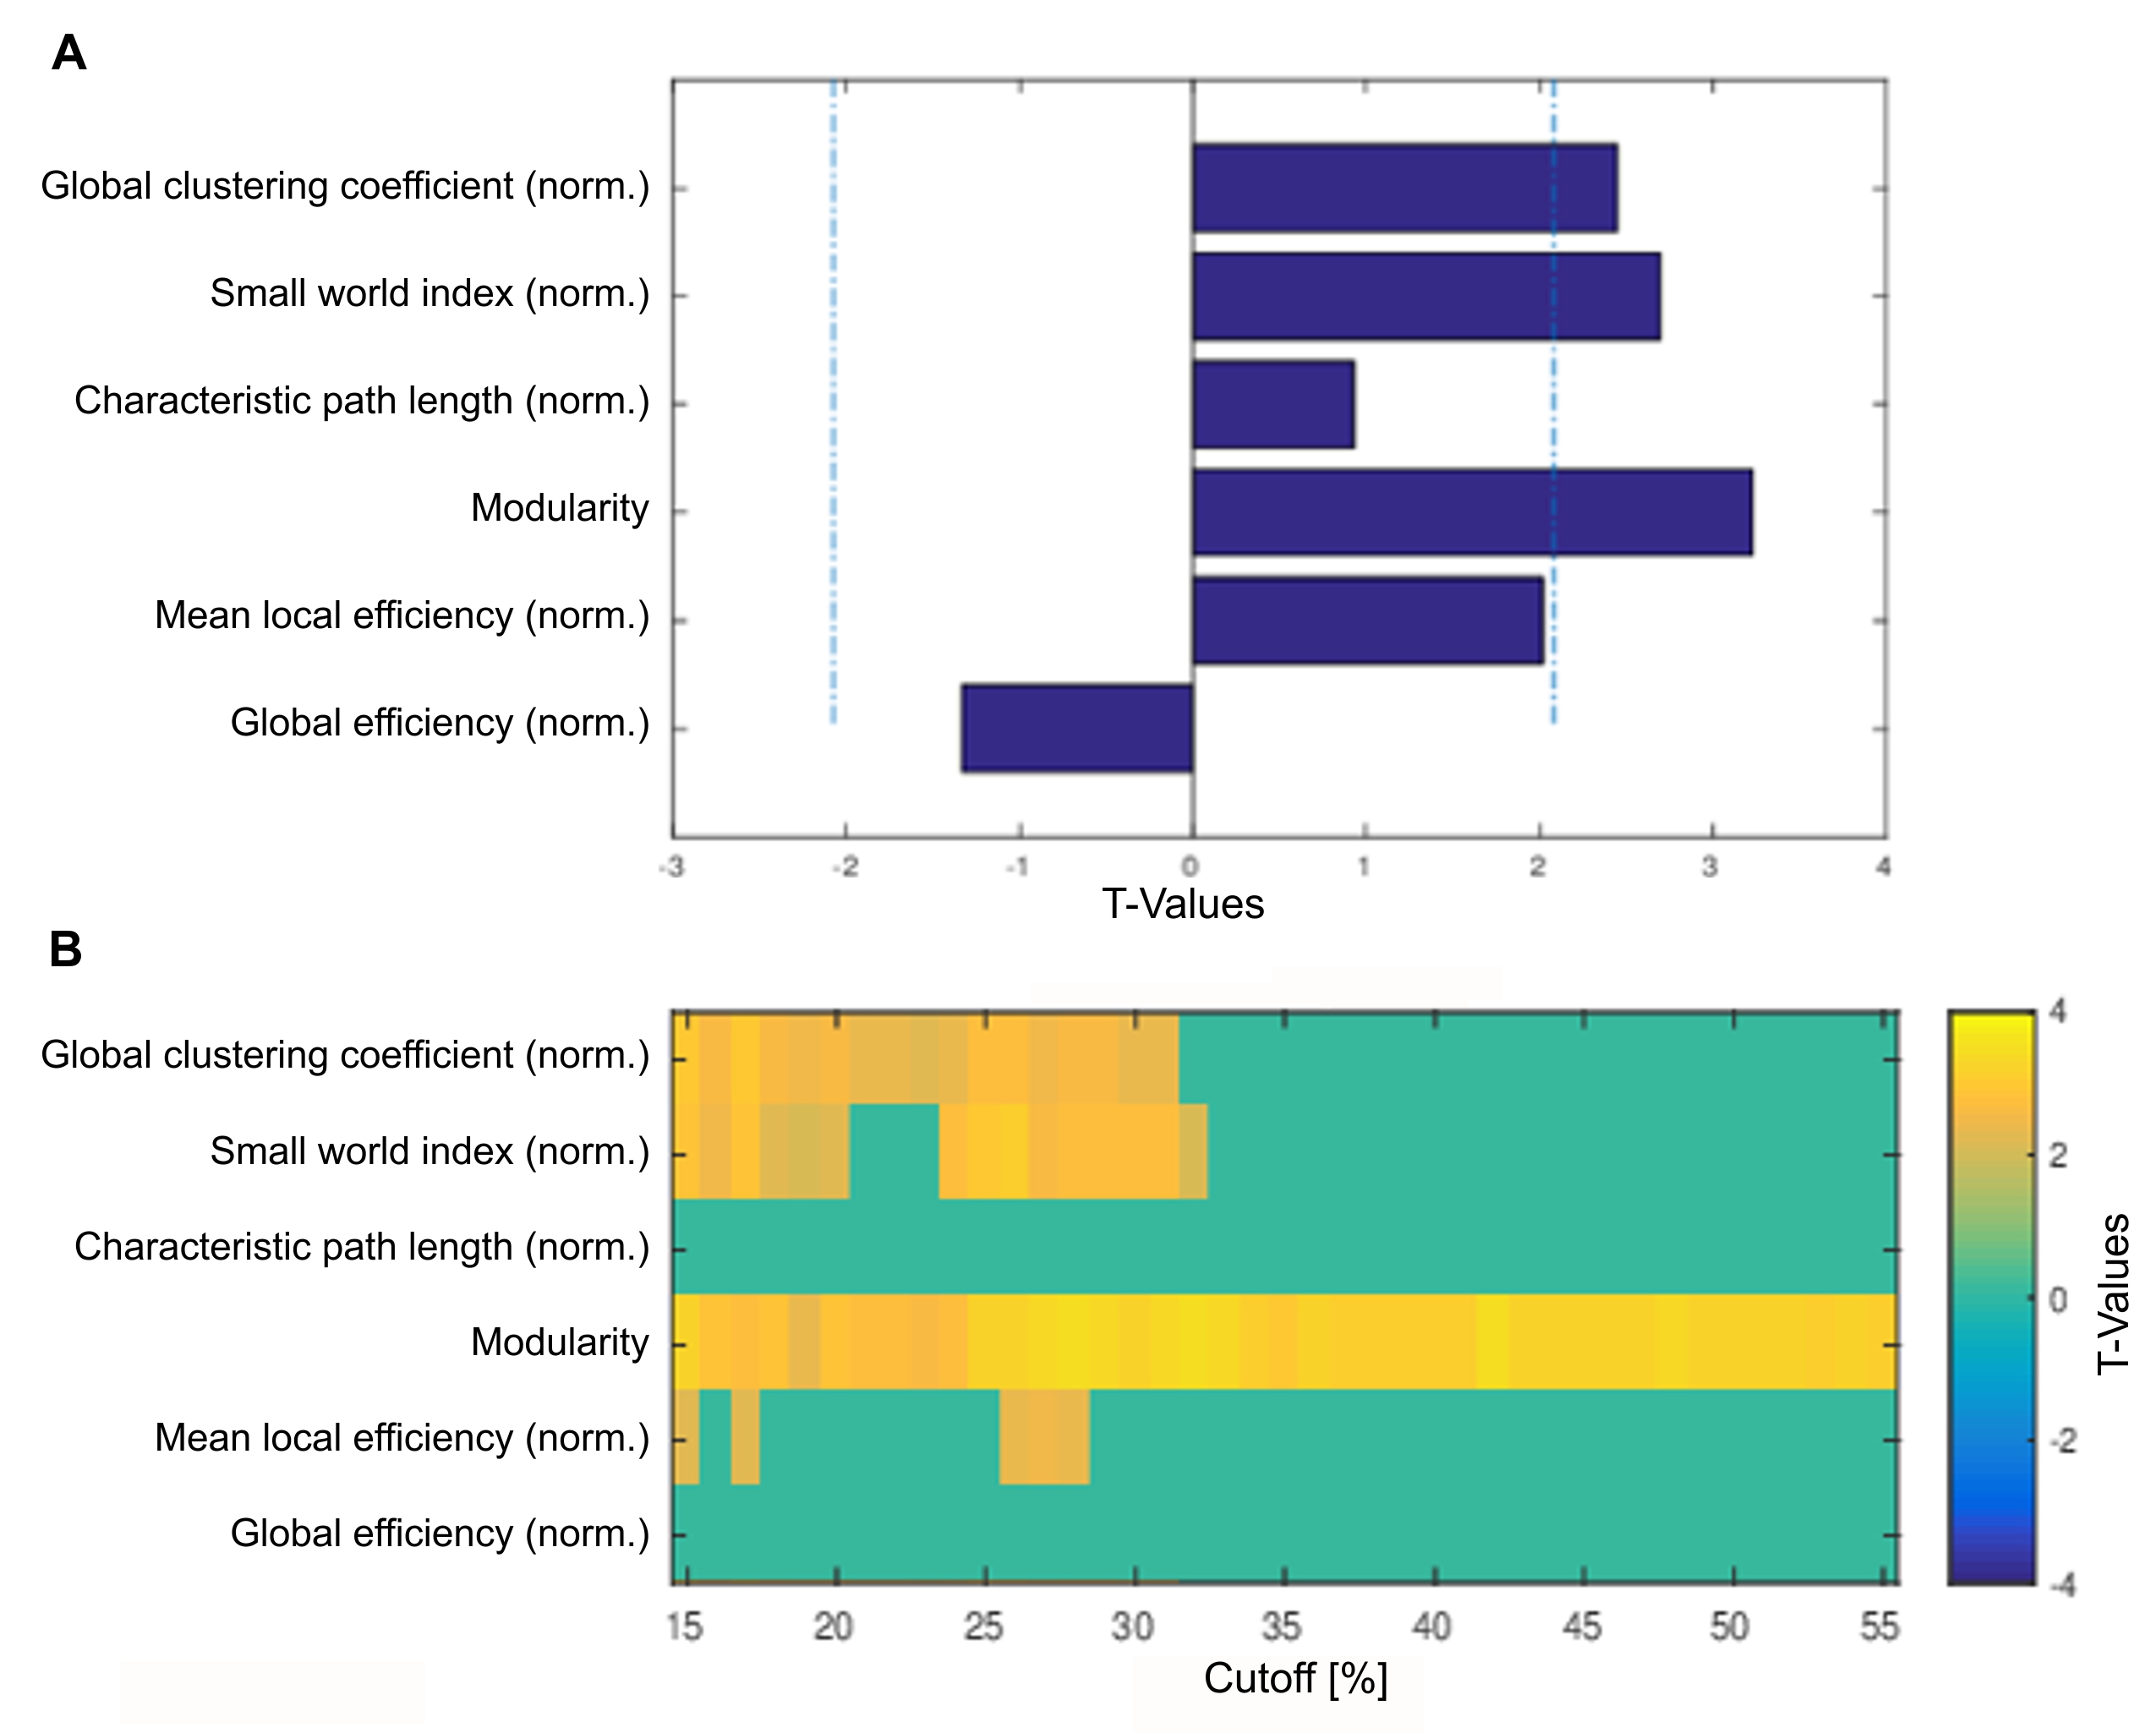
Figure1: Comparison of six global graph metrics’ t-values of the functional approach between post-weaning social isolation (PWSI) rats and healthy controls (HC).
Positive t-values indicate increased global graph metrics in HC compared to PWSI rats and vice versa. (A) shows two-sample t-test results for six different global graph metrics (area under the curve (AUC) from 15% to 55%; dashed lines indicate p = 0.05 threshold) and (B) significant t-values (p < 0.05) of six global graph metrics over network densities from 15% to 55%. norm., normalized.
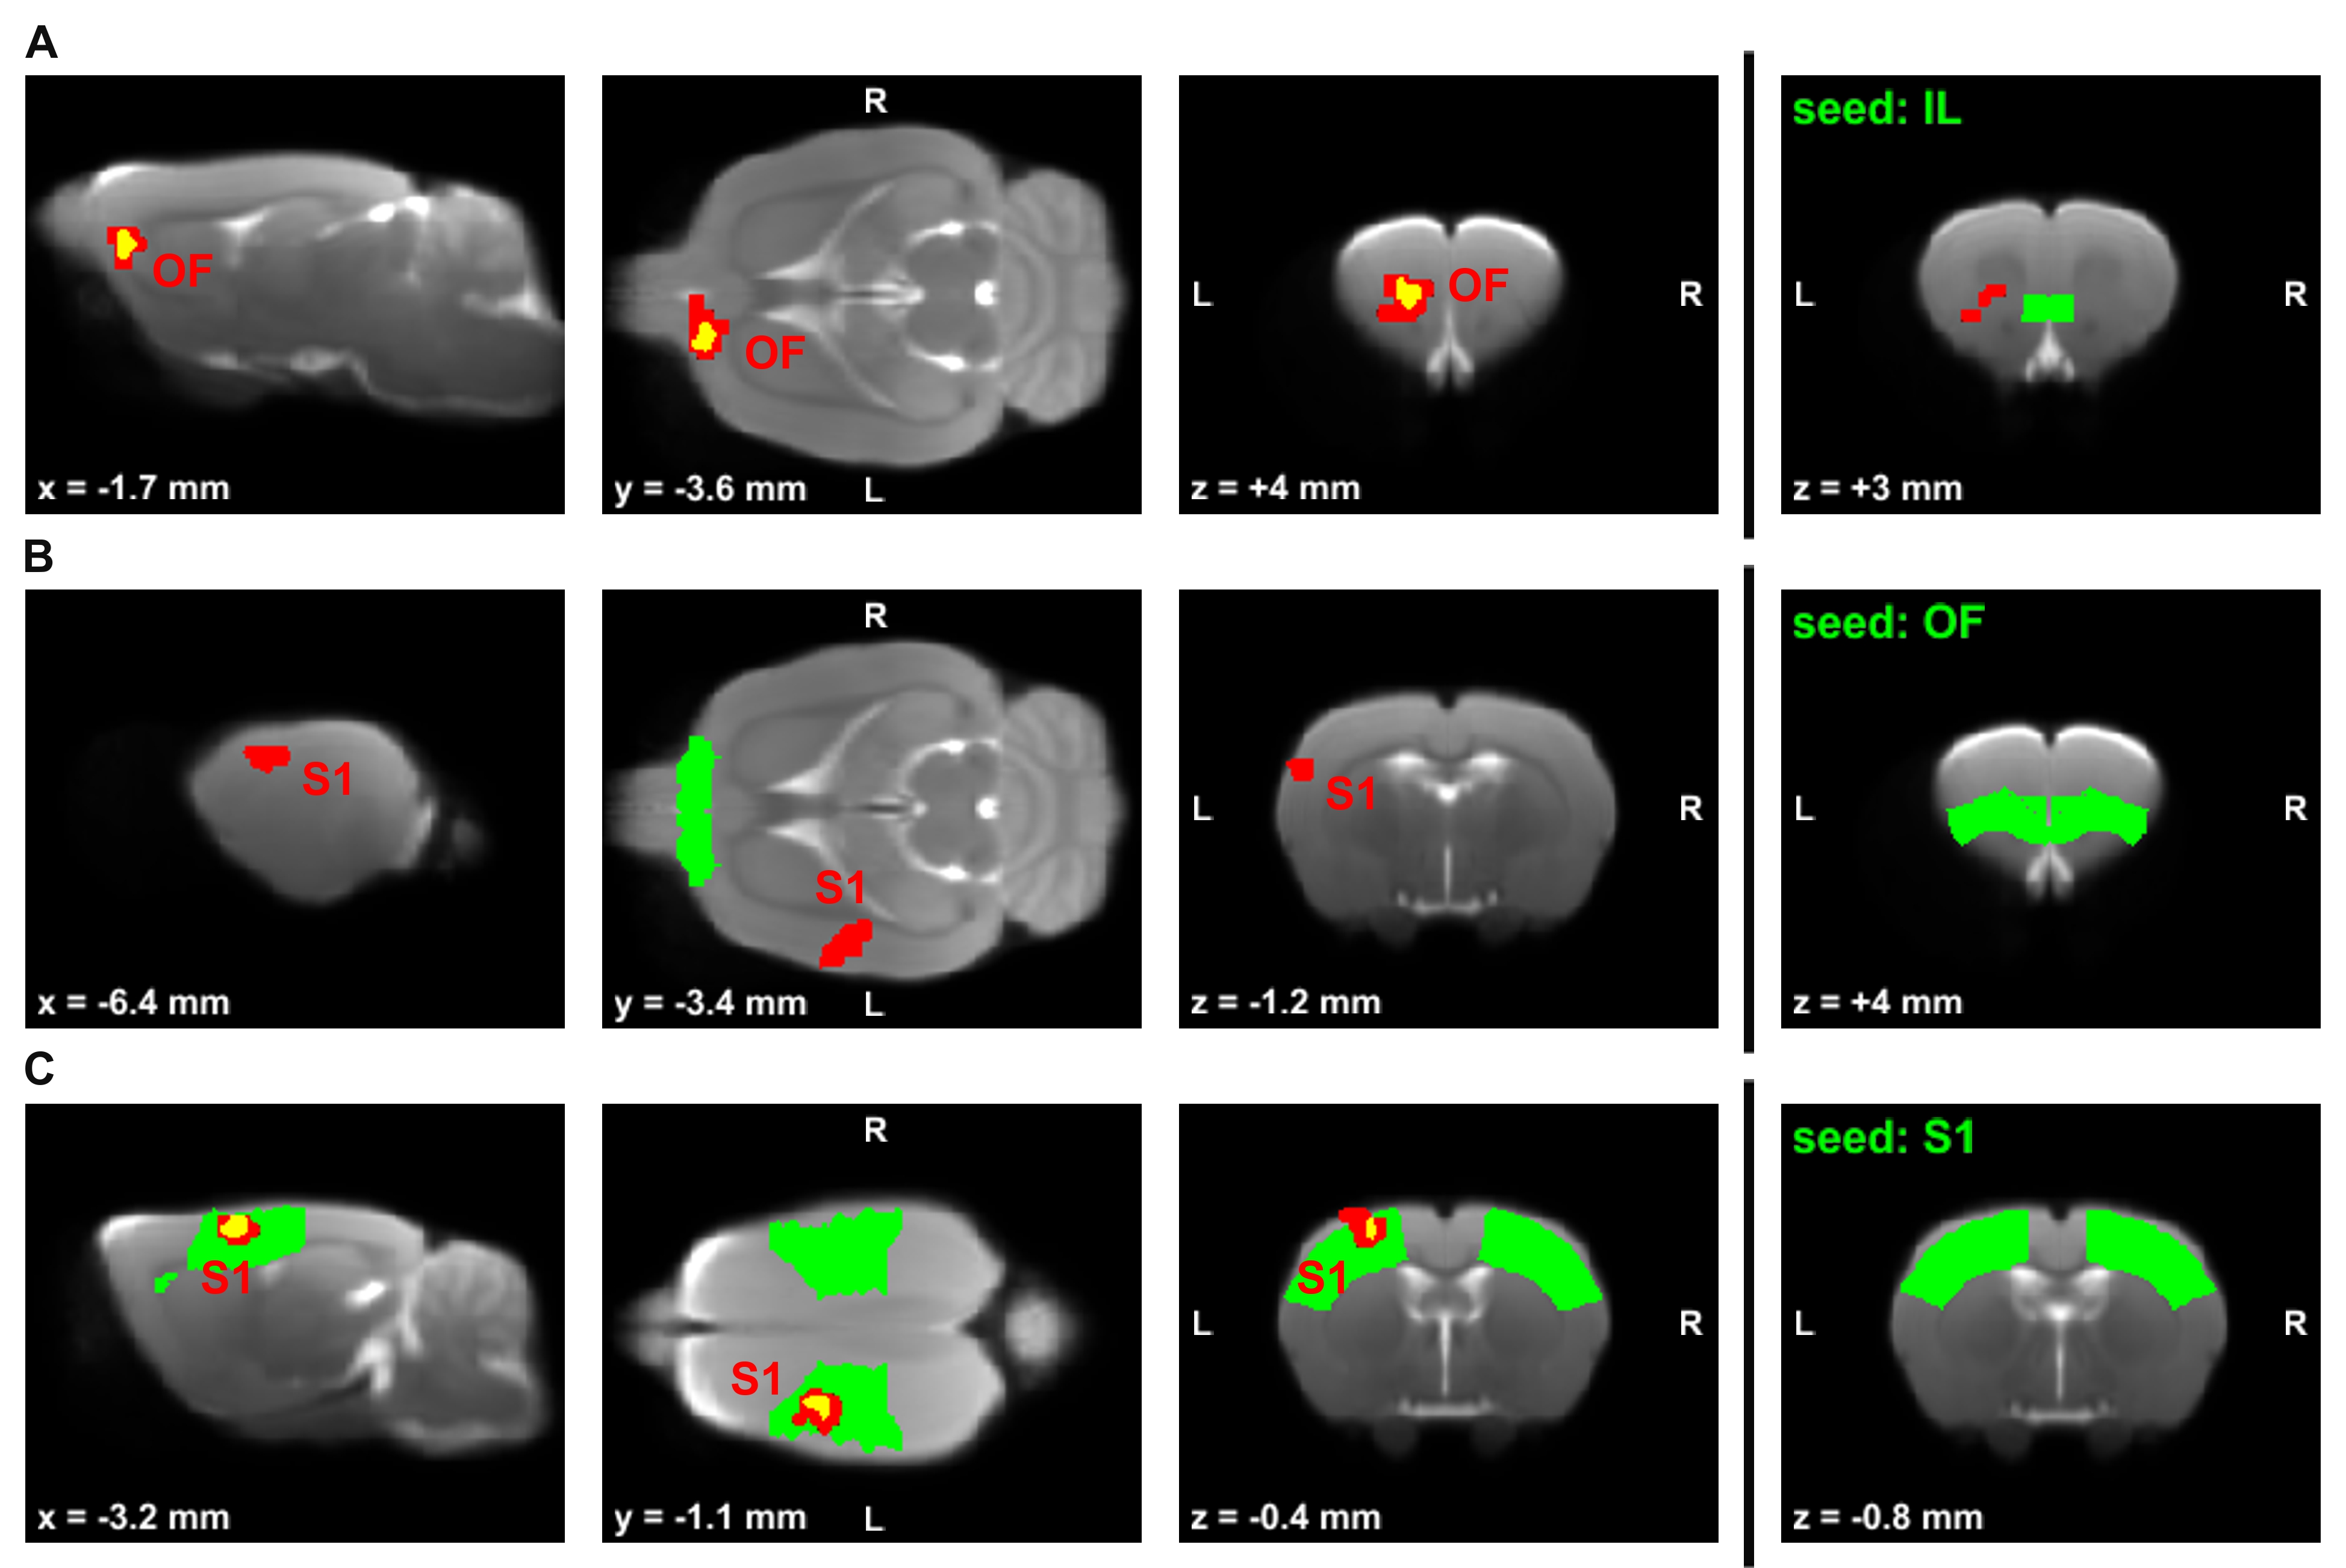
Figure 2: Comparison of rs-fMRI-measured seed-based connectivity between post-weaning social isolation (PWSI) rats and healthy controls (HC).
Seeds are located in the (A) infralimbic cortex (IL), (B) orbitofrontal cortex (OF) and (C) primary somatosensory cortex (S1) and marked in green. Two-sample t-tests with two different multiple comparison correction methods (red: cluster-wise family wise error rate pCW-FWE < 0.05; yellow: voxel-wise whole-brain non-parametric threshold-free-cluster enhancement with FWE pTFCE-FWE < 0.05) show significantly decreased connectivity in socially isolated rats. Cluster-defining threshold is p<0.002 for (A), p<0.001 for (B) and (C). Coordinates are in mm to Bregma. L, left; R, right
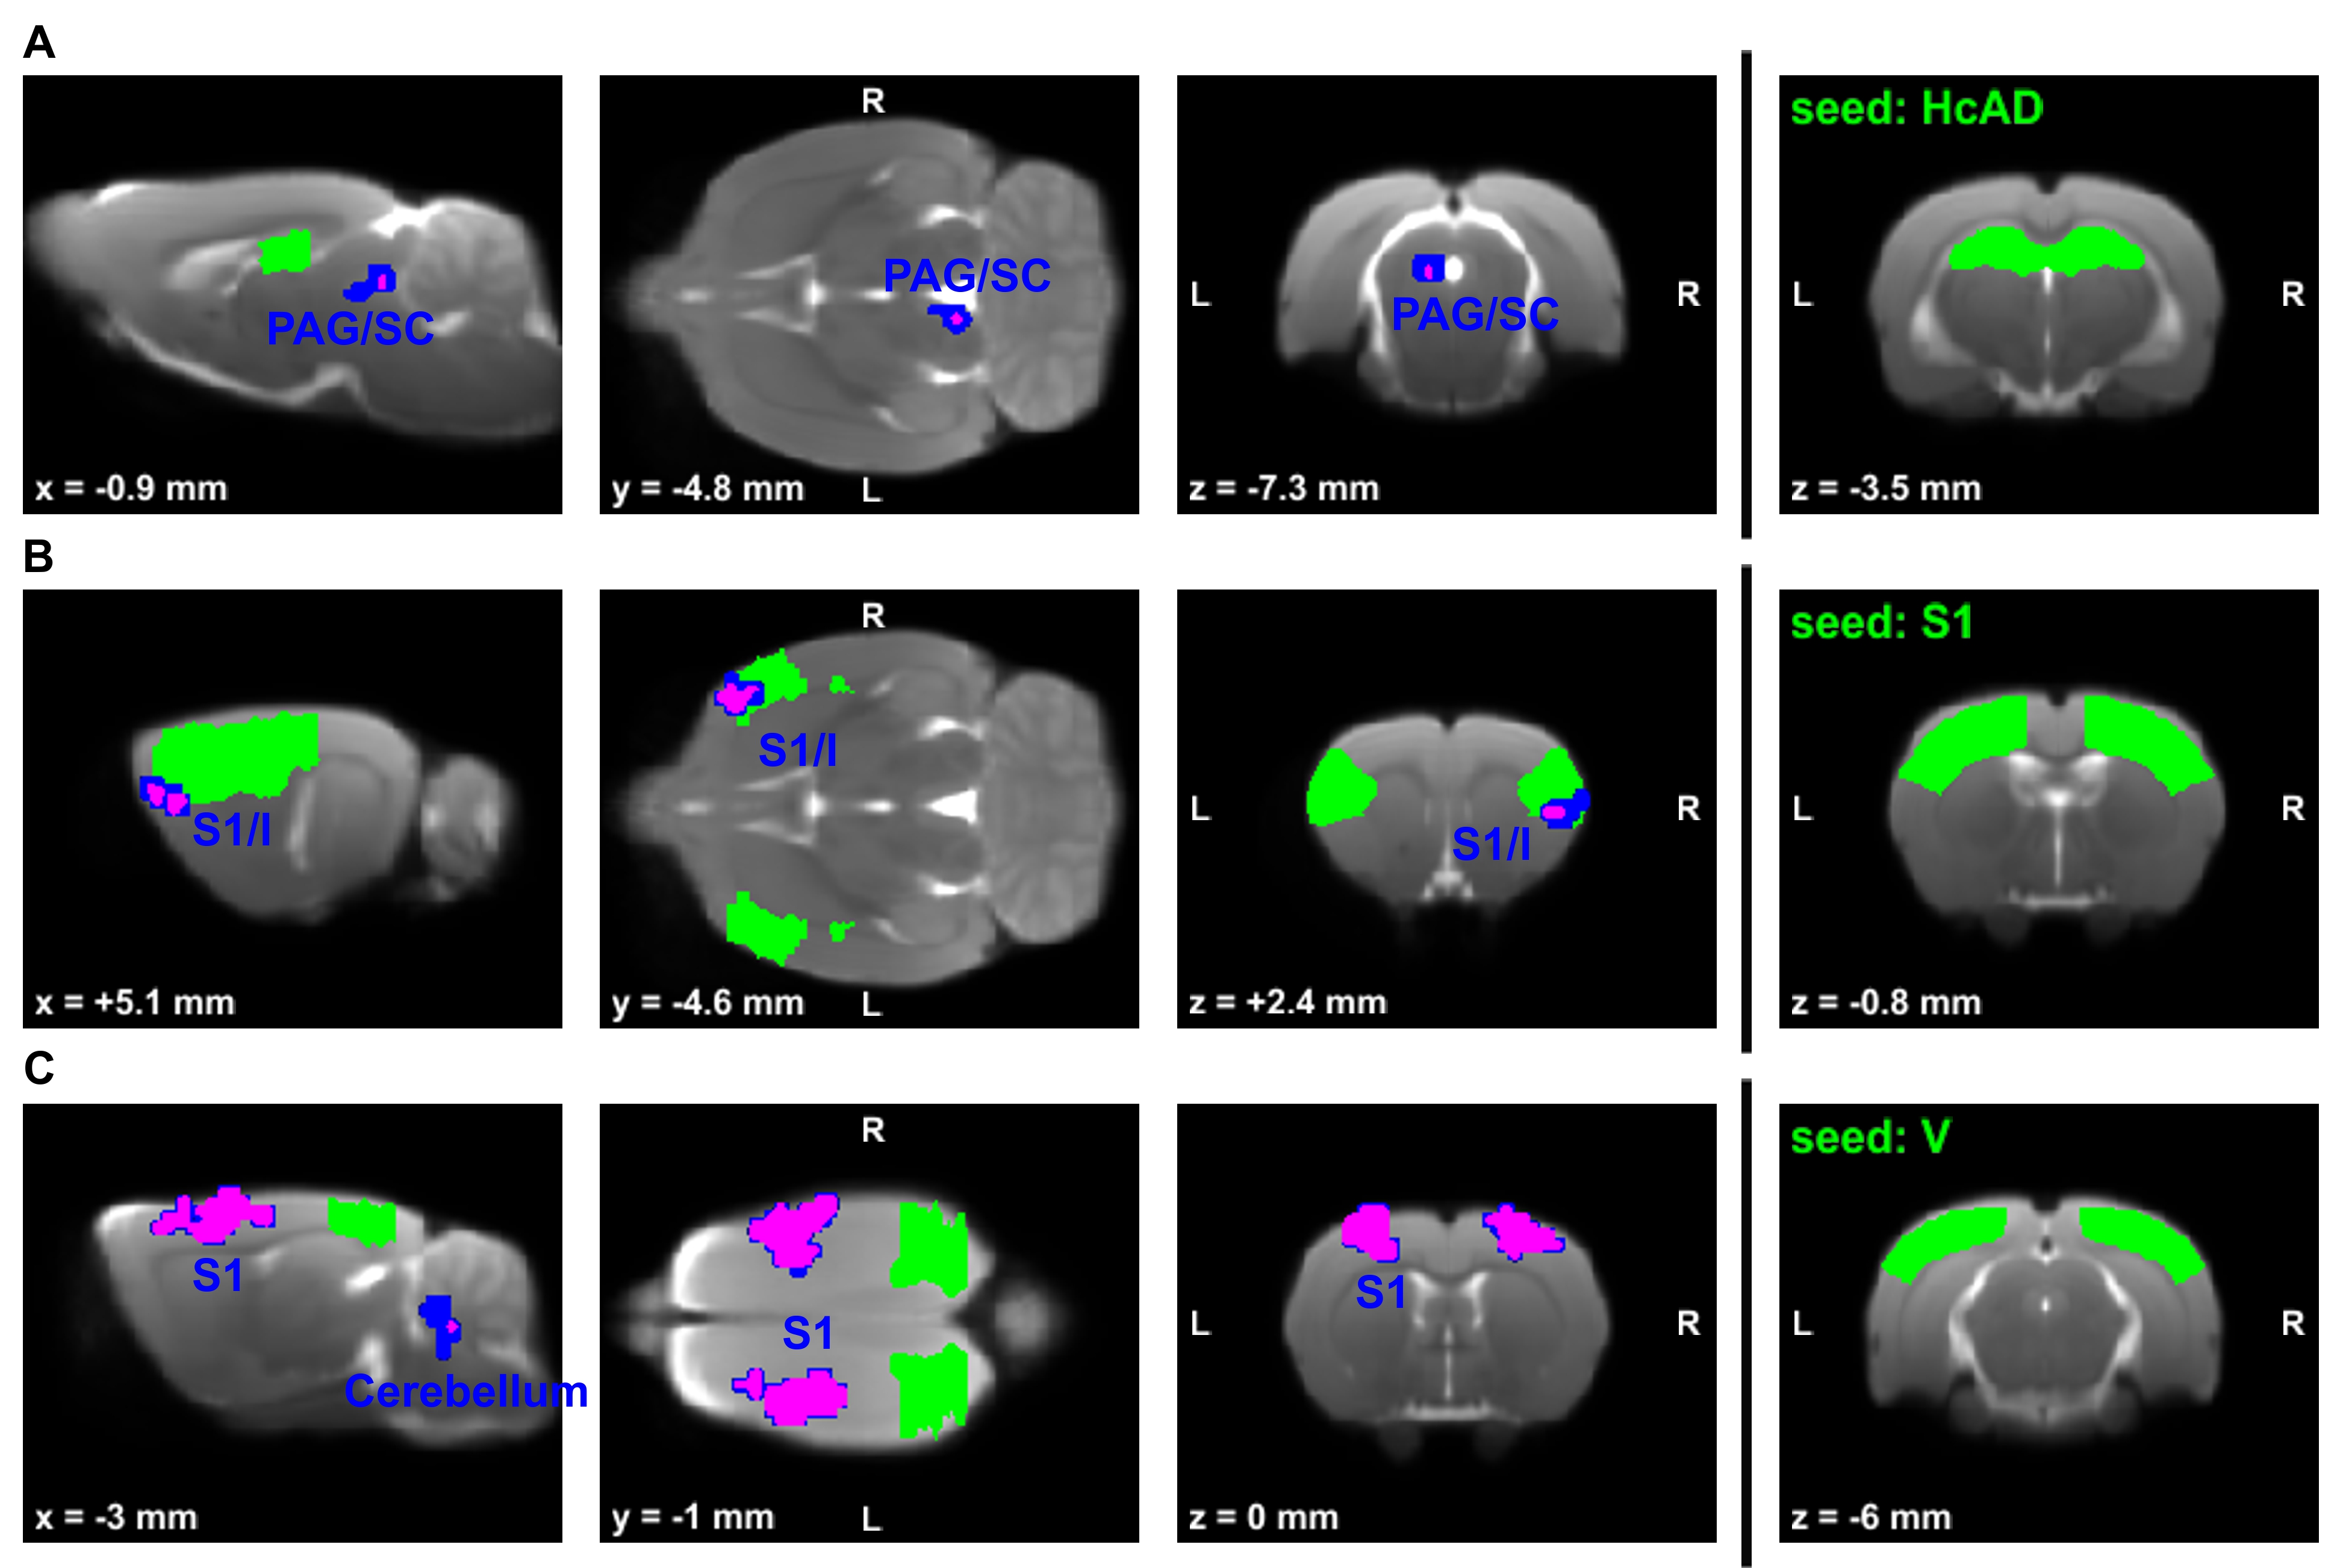
Figure 3: Comparison of rs-fMRI-measured seed-based connectivity between post-weaning social isolation (PWSI) rats and healthy controls (HC).
Seeds are located in the (A) anterodorsal hippocampus (HcAD), (B) primary somatosensory cortex (S1) and (C) visual cortex (V) and marked in green. Two-sample t-tests with two different multiple comparison correction methods (blue: cluster-wise family wise error rate (CW-FWE) pCW-FWE < 0.05; magenta: voxel-wise whole-brain non-parametric threshold-free-cluster enhancement with FWE (TFCE-FWE) pTFCE-FWE < 0.05) show significantly increased connectivity in socially isolated rats. Cluster-defining threshold is p < 0.001. Coordinates are in mm to Bregma. L, left; R, right
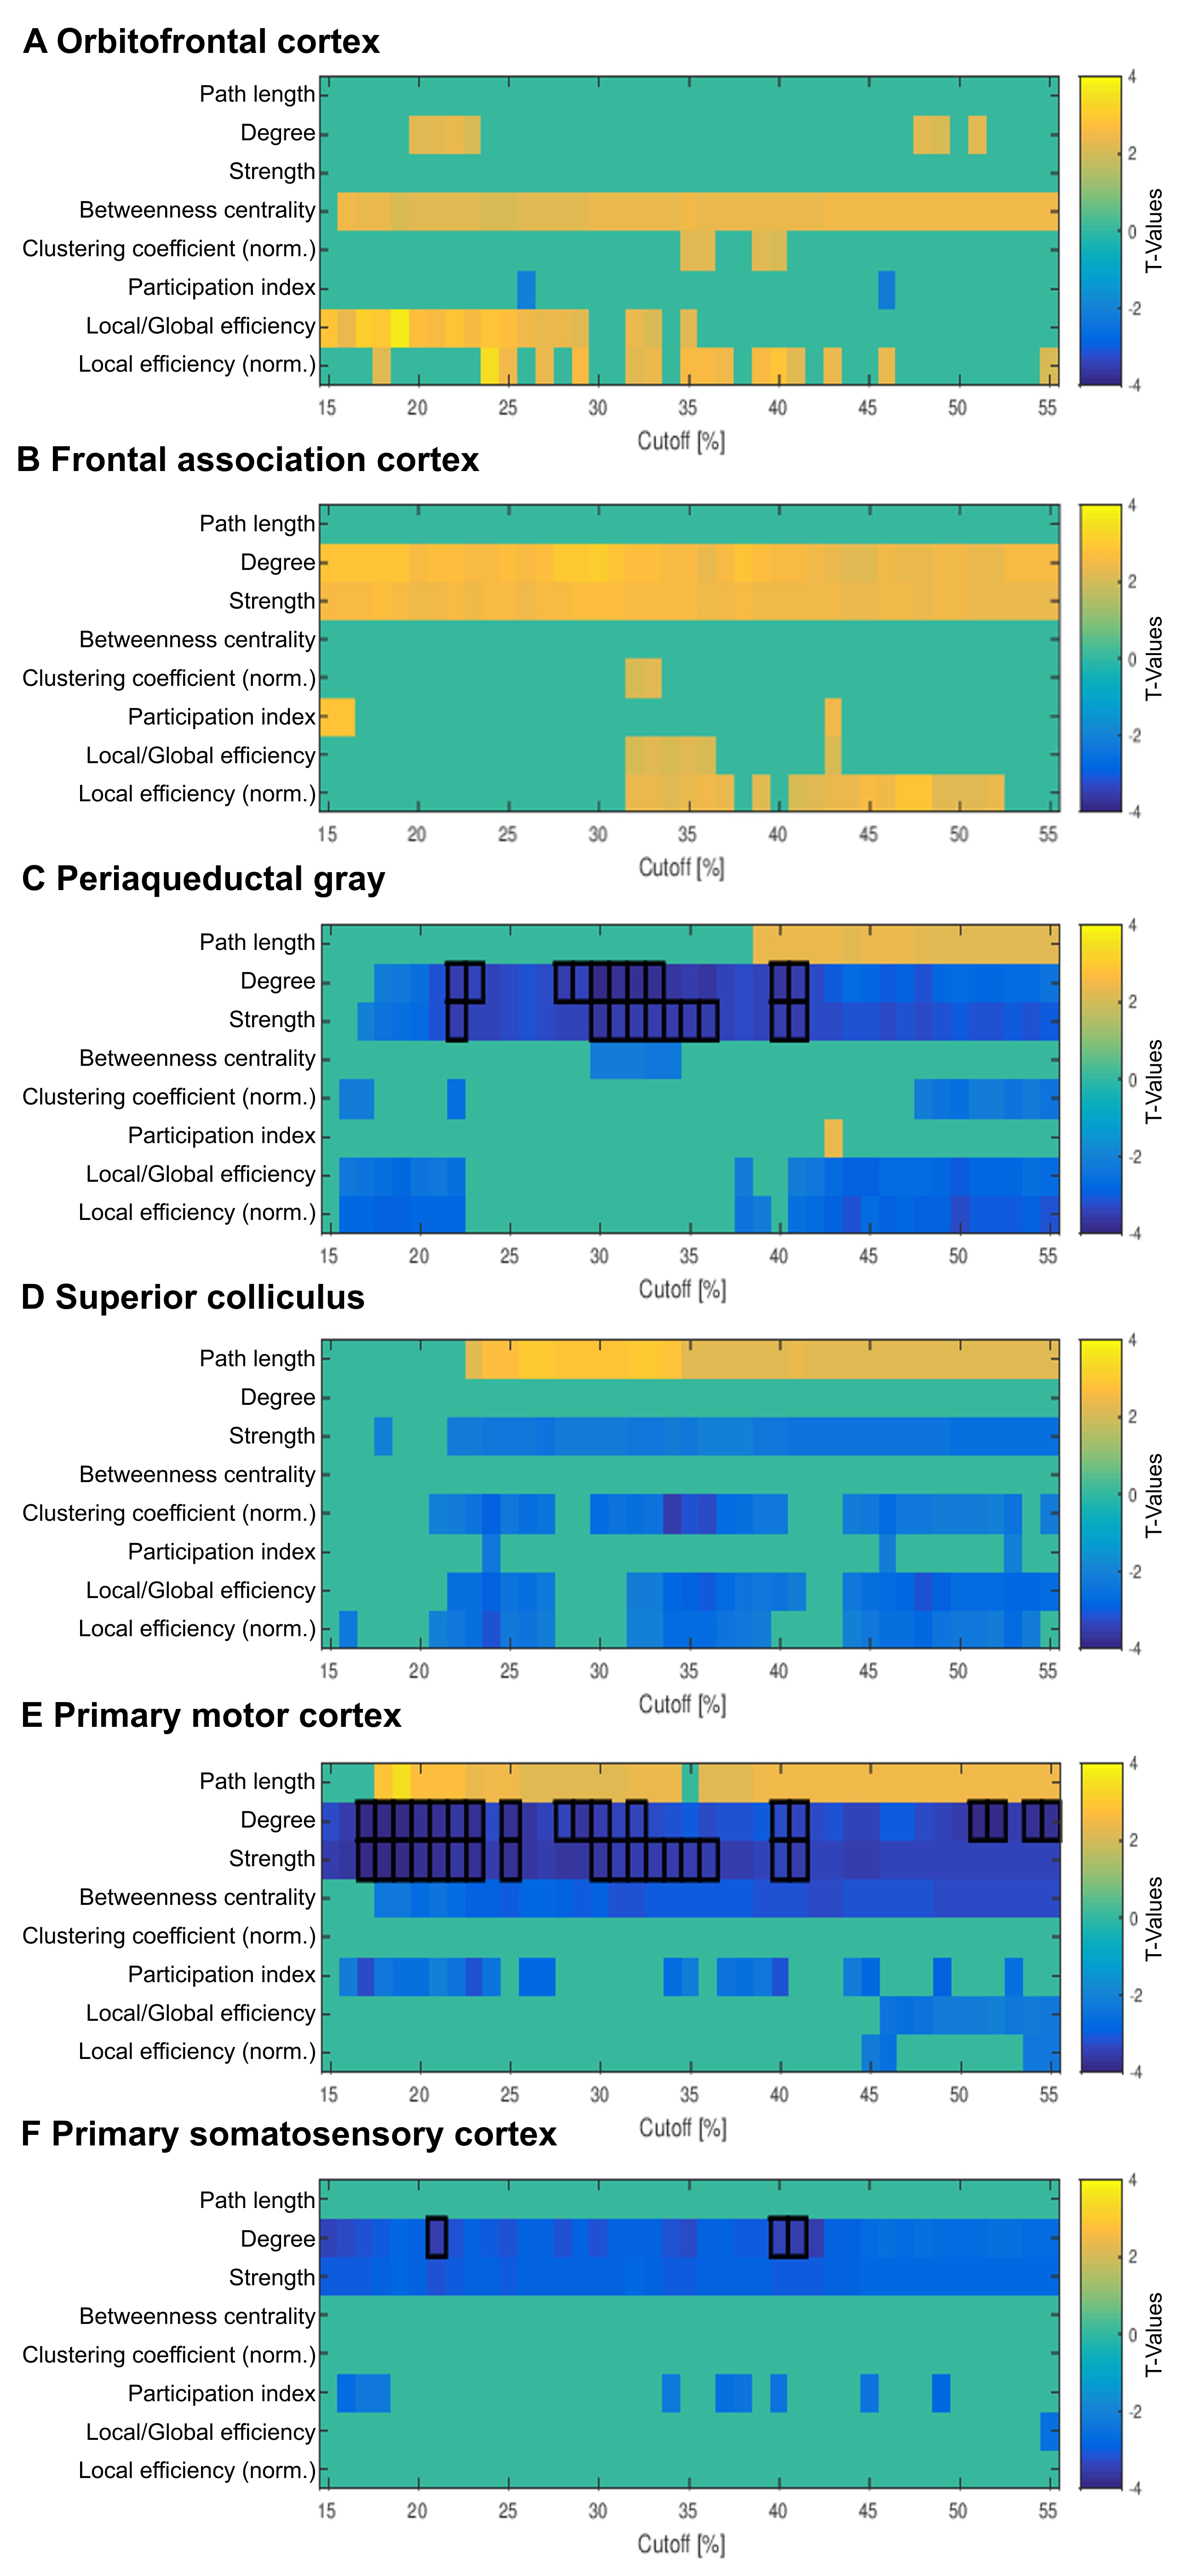
Figure 4: Comparison of eight local graph metrics’ t-values of the anatomical approach between post-weaning social isolation (PWSI) rats and healthy controls (HC) for six regions of interest.
Eight local graph metrics are shown over a range of network densities from 15% to 55%. Only significant values are shown (p < 0.05), values surviving FDR-correction for all 43 regions (pFDR < 0.05) are marked with a black frame. Positive t-values (yellow) indicate increased local graph metrics in HC compared to PWSI rats and vice versa (blue).