4076
Effects of SHH Signaling Pathway in Post-Stroke Recovery Assessed by MRI1Biomedical Engineering, Case Western Reserve University, Cleveland, OH, United States, 2Neurological Surgery, Case Western Reserve University, Cleveland, OH, United States
Synopsis
The current study investigated the effect of sonic hedgehog agonist (SAG) treatment in post-stroke recovery. SAG- and vehicle-treated mice were evaluated with MRI at day 2 and day 30 after middle cerebral artery occlusion (MCAO) surgery. Our results show that SAG treatment showed significantly increased cerebral perfusion in the ischemic penumbra at day 30, suggesting enhanced angiogenesis. In addition, SAG-treated mice also exhibited decreased T2, suggesting reduced neuronal damage. These results suggest that the sonic hedgehog signaling pathway can be a potential therapeutic target for stroke treatment.
Introduction
Ischemic stroke occurs as a result of interrupted blood supply to the brain. Except for delivery of tissue plasminogen activator (tPA) within a short time window after the onset of stroke, there is no other treatments in subacute and chronic stroke that can effectively regenerate tissue. Sonic hedgehog (SHH) has been shown to play a pleiotropic role in neurogenesis and gliosis after ischemic stroke1,2. However, whether it affects the sub-chronic post-stroke tissue recovery, angiogenesis and long term blood supply has not been investigated. In this study, we aim to evaluate the effect of sonic hedgehog agonist (SAG) treatment in mice with middle cerebral artery occlusion (MCAO). MRI studies were performed to evaluate the effects of SAG treatment in cerebral blood flow (CBF) and ischemic edema volume one-month after stroke.Methods
Ischemic stroke was induced by 35 minutes of middle cerebral artery occlusion in C57B6 mice (N=12). Six mice were given SAG orally starting from post stroke day 3 for 5 days. The remaining six mice were given vehicle solution (0.5% metrocellulose) without SAG. Two imaging sessions were repeated at 2 and 30 days after stroke. MRI studies were performed on a horizontal Bruker 9.4 T scanner with a 3-cm birdcage coil. Multi-slice, T2-weighted, axial images were acquired using a rapid acquisition with relaxation enhancement (RARE) sequence3 to quantify ischemic edema volume. Imaging parameters were: TE/TR, 15/2000 ms; RARE factor, 8; NAV, 4; matrix size, 256×256; slice thickness, 1 mm; number of slices, 13; field of view (FOV), 2.4×2.4 cm. One Bregma-containing slice was selected for CBF quantification by arterial spin labeling (ASL). ASL images were acquired with a flow-sensitive alternating inversion recovery (FAIR) preparation sequence followed by fast imaging in steady precession (FISP) readout4. The inversion pulse used a 3-ms hyperbolic secant adiabatic pulse, with the slice thickness set to three times that of the imaging slice thickness. FISP acquisition was implemented at 1420 ms following the inversion pulse with the follow parameters: flip angle, 60°; TR, 2.4 ms; TE, 1.2 ms; NAV, 20; matrix size, 128×128; FOV, 2.4×2.4 cm; slice thickness, 1.5 mm. A proton density image (M0) with no inversion preparation was also acquired. A T1-apparent map with the same spatial resolution was acquired with a FISP-based Look-Locker sequence with the following parameters: flip angle, 10°; TR, 4.0 ms; TE, 2.0 ms; NAV, 20. T2 map of the same slice was also acquired using the Carr-Purcell-Meiboom-Gill sequence with echo times varying from 30 to 240 ms5. Other acquisition parameters were: TR: 500 ms; number of echoes: 16; NAV, 2; matrix size, 180×180. Image reconstruction and analysis were performed offline using in-house developed, MATLAB-based (Natick, MA, USA) software. ROIs of ischemic edema volume and brain tissue were drawn from T2-weighted images. Consequently, the percentage of ischemic edema volume was calculated. CBF was calculated using the method proposed by Pell et al6, assuming a blood T1-apparent of 2.4 s. CBF in the ischemic edema volume was compared against that in the contralateral brain. Student’s unpaired t-tests was used for data comparison. p<0.05 was considered significant.Results
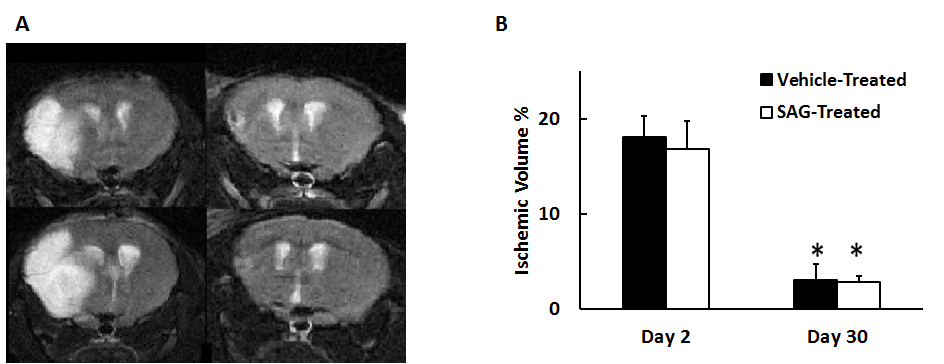
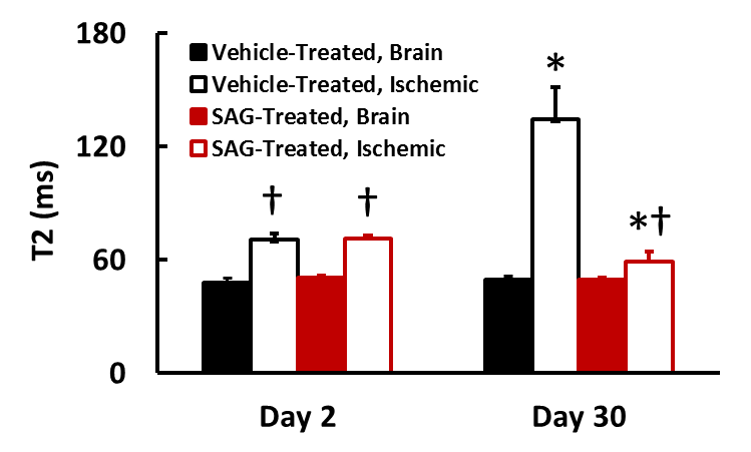
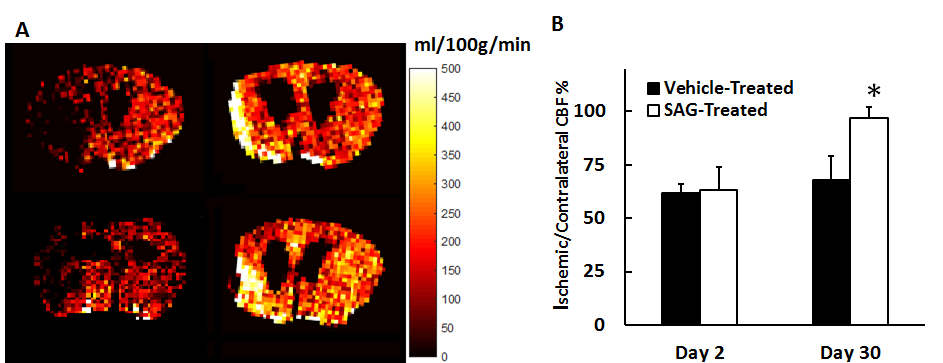
Figure 1 shows representative T2-weighted images of SAG and vehicle-treated mice. Ischemic edema volume in SAG-treated mice was similar to vehicle-treat mice at both day 2 and day 30. At day 2, ischemic region in both groups showed significantly higher T2 than the brain tissue. At day 30, vehicle-treated mice showed further increase in T2 in the ischemic region as compared to day 2, possibly implying irreversible neuronal damage7. On the contrary, SAG-treated mice showed decreased T2 in the ischemic area, reaching a similar level as the contralateral brain tissue. (Figure 2). In addition, SAG-treated mice also showed increased CBF in the penumbra at day 30 (Figure 3), suggesting enhanced angiogenic activity.Discussion and Conclusion
In the current study, we observed significantly decreased T2 and improved cerebral perfusion in SAG-treated mice. These results suggest that SHH signaling pathway has a potent functional role in restoring blood supply post stroke, facilitating tissue recovery and imply a potential clinical use in subacute chronic stroke.Acknowledgements
This study is by the American Heart Association National Scientist Development Award 13SDG17200019 and NIH R01 NS091213. The authors declare no conflict of interest.References
1. Chechneva OV, Mayrhofer F, Daugherty DJ, Krishnamurty RG, Bannerman P, Pleasure DE, Deng W. A Smoothened receptor agonist is neuroprotective and promotes regeneration after ischemic brain injury. Cell death & disease. 2014 Oct 1;5(10):e1481.
2. Jin Y, Raviv N, Barnett A, Bambakidis NC, Filichia E, Luo Y. The shh signaling pathway is upregulated in multiple cell types in cortical ischemia and influences the outcome of stroke in an animal model. PloS one. 2015 Apr 30;10(4):e0124657.
3. Hennig J, Nauerth A, Friedburg H. RARE imaging: a fast imaging method for clinical MR. Magnetic resonance in medicine. 1986 Dec 1;3(6):823-33.
4. Gao Y, Goodnough CL, Erokwu BO, Farr GW, Darrah R, Lu L, Dell KM, Yu X, Flask CA. Arterial spin labeling-fast imaging with steady-state free precession (ASL-FISP): a rapid and quantitative perfusion technique for high-field MRI. NMR in Biomedicine. 2014 Aug 1;27(8):996-1004.
5. Chen Y, Li W, Jiang K, Wang CY, Yu X. Rapid T2 mapping of mouse heart using the carr–purcell–meiboom–gill sequence and compressed sensing reconstruction. Journal of Magnetic Resonance Imaging. 2016 Feb 1
6. Pell GS, Thomas DL, Lythgoe MF, Calamante F, Howseman AM, Gadian DG, Ordidge RJ. Implementation of quantitative FAIR perfusion imaging with a short repetition time in time-course studies. Magnetic resonance in medicine. 1999 Apr 1;41(4):829-40.
7. Lansberg MG, Thijs VN, O'Brien MW, Ali JO, De Crespigny AJ, Tong DC, Moseley ME, Albers GW. Evolution of apparent diffusion coefficient, diffusion-weighted, and T2-weighted signal intensity of acute stroke. American Journal of Neuroradiology. 2001 Apr 1;22(4):637-44.
Figures