4074
Neurochemical Alterations and Behavioral Impairments in Late Stage Alcoholic Liver Fibrosis in Mice1Radiology, University of Maryland School of Medicine, Baltimore, MD, United States, 2Core for Translational Research in Imaging @Maryland, Baltimore, MD, United States, 3Pharmaceutical Sciences, University of Maryland School of Pharmacy, Baltimore, MD, United States, 4Harvard Medical School McLean Hospital, Belmont, MA, United States
Synopsis
A mouse model of late-stage alcoholic liver fibrosis (LALF) was used to investigate changes of neurochemical levels in specific brain regions that may relate to behavioral changes at LALF. Higher glutamine levels result in osmotic/oxidative stress were found in the thalamus and hippocampus of the alcohol-treated mice than in controls. Thalamic levels of taurine and creatine were significantly diminished and were strongly correlated with the alcohol-induced depressive behavior observed in an open field test. In addition, significant elevations in hippocampal glutamate were indicative of upregulated local glutamatergic activation. These pilot findings provide novel insight into the development of alcohol-induced HE.
Purpose
Chronic alcohol consumption has extensive effects on the liver and brain, although the precise mechanisms by which alcohol exerts these effects remain elusive. In order to gain insight into the development of alcohol-induced hepatic encephalopathy (HE), we used a mouse model of late stage alcoholic liver fibrosis (LALF) to investigate changes of neurochemical levels in specific brain regions that may relate to behavioral changes at LALF.Methods
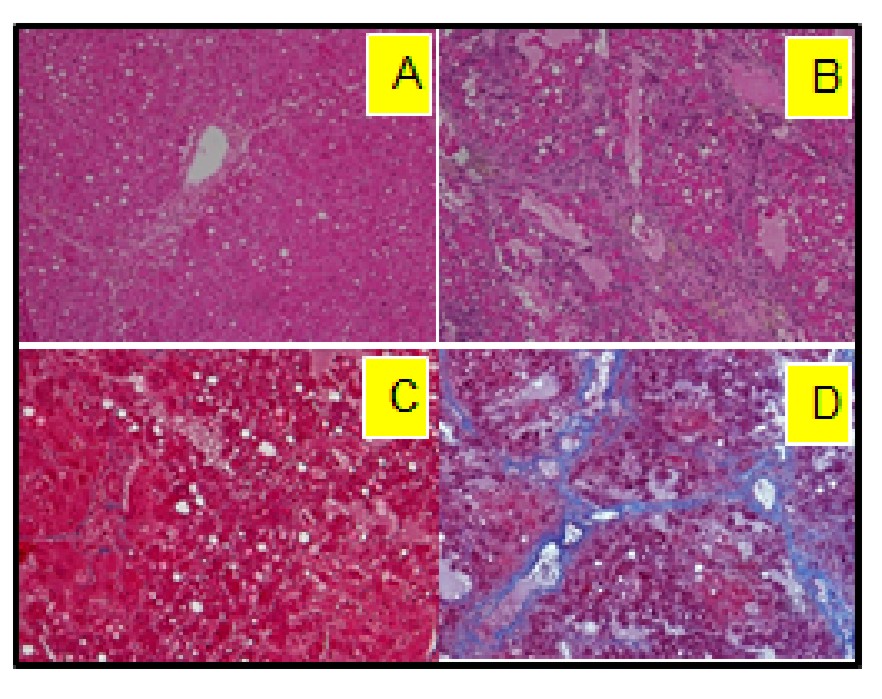
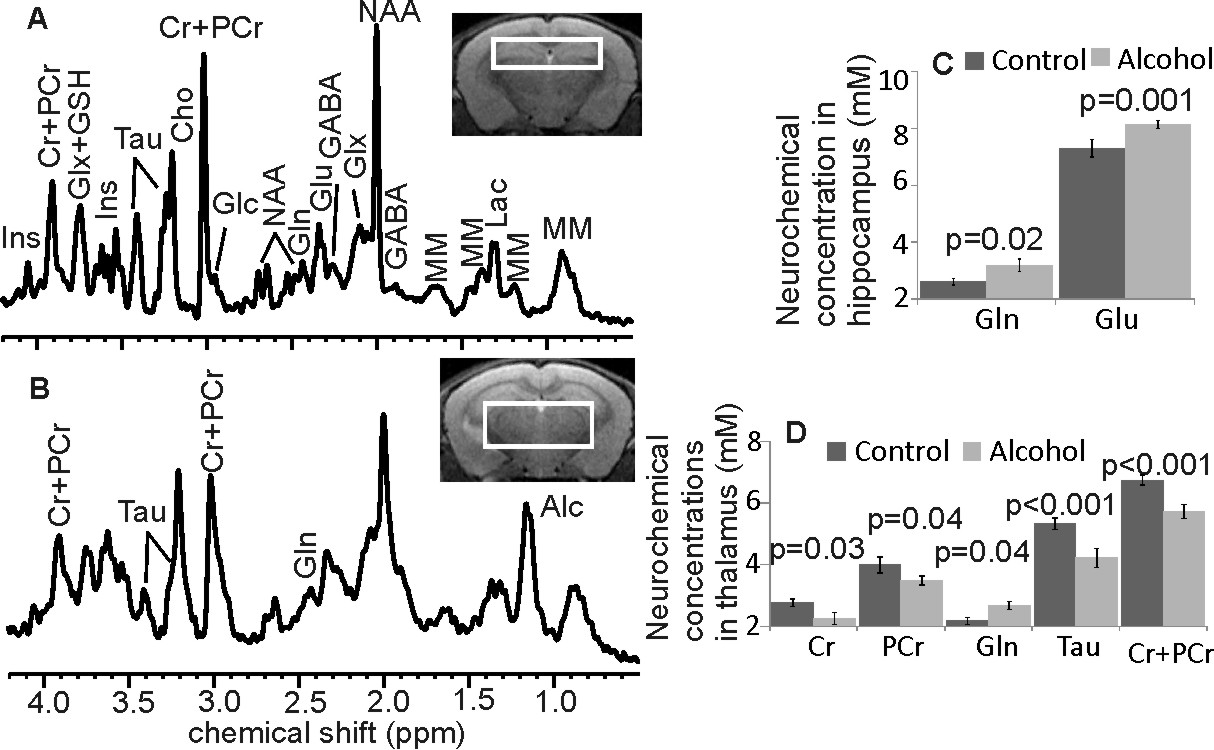
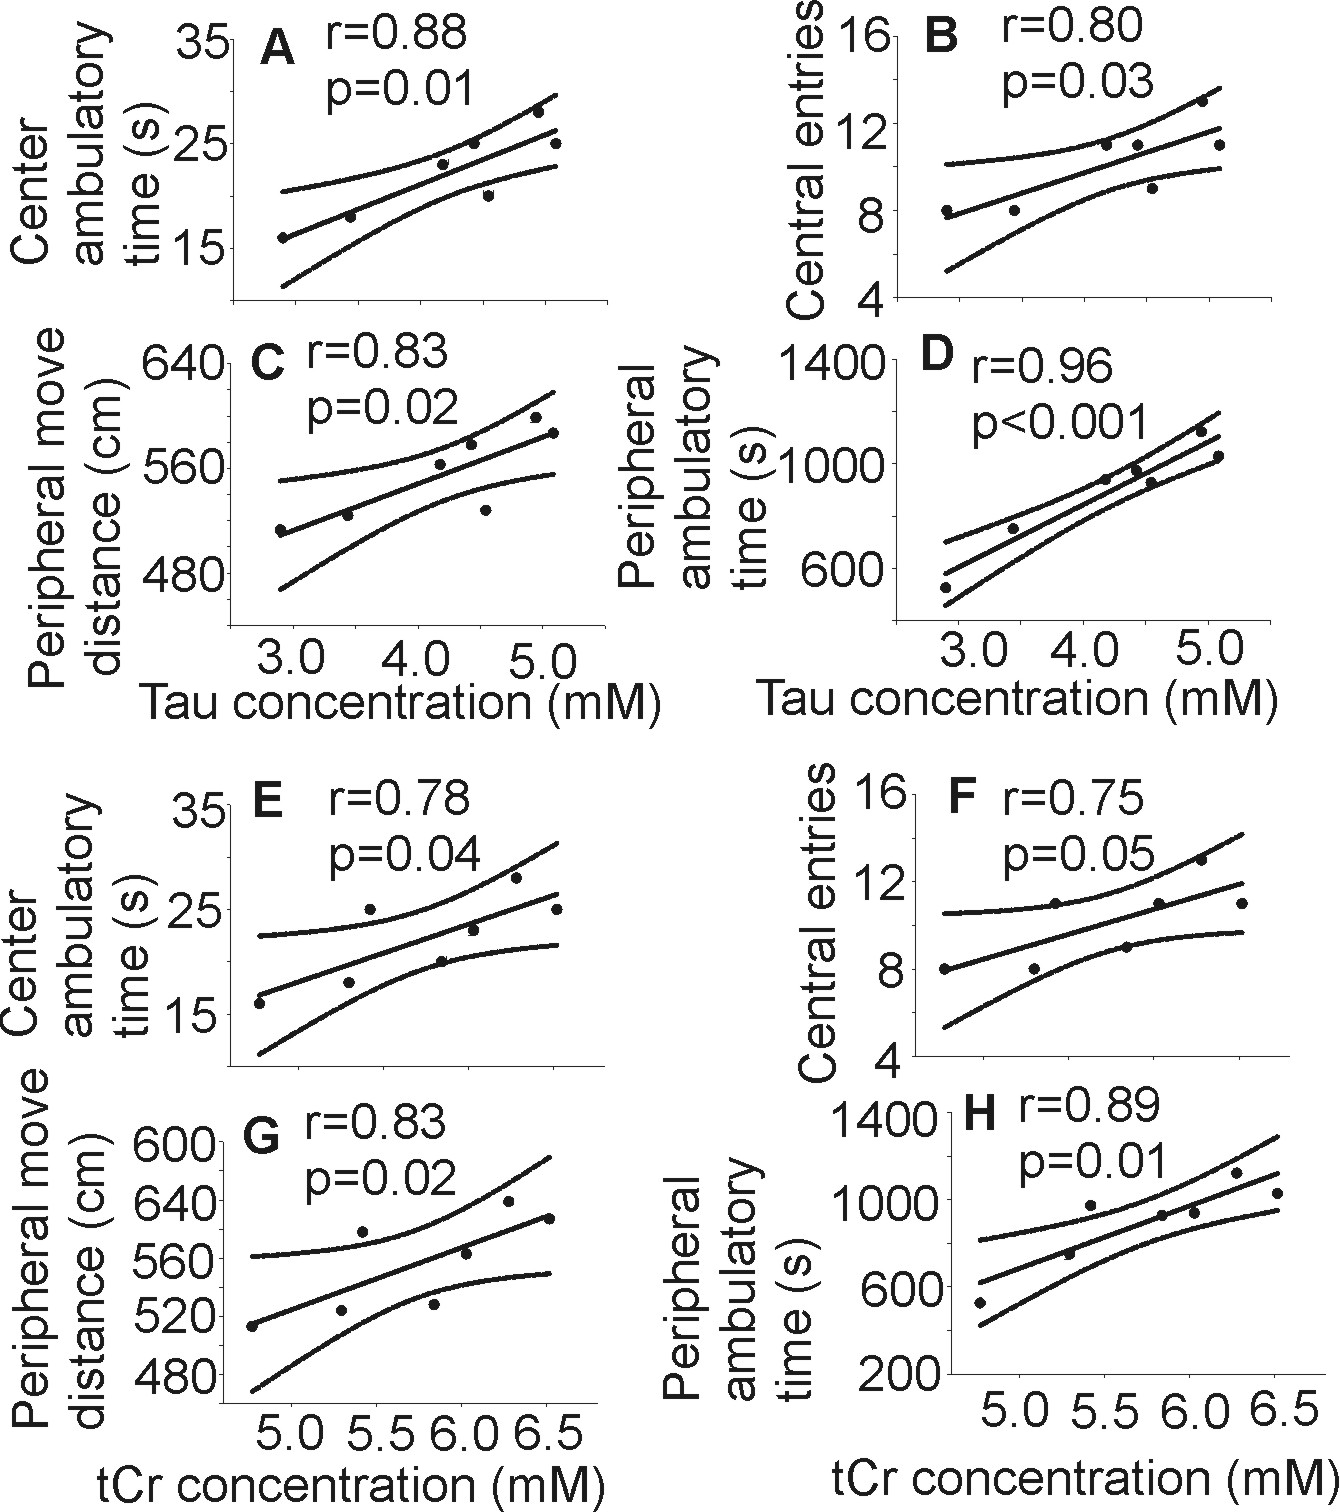
The model of LALF was established based on our previous methods1,2. At 6 - 8 weeks of age, female BALB/c mice were fed nutritionally adequate Lieber-DeCarli liquid diets (BioServ, Flemington NJ) for 7 months containing 27% of calories from alcohol. Equal calories of liquid diets with replacement of isocaloric dextrose were provided to controls. All animal procedures were approved by the Institutional Animal Care and Use Committee at our institution. Formalin-fixed liver sections were stained with hematoxylin and eosin to examine general morphology, and with Masson’s Trichrome for fibrosis. In vivo MRS experiments were performed on a Bruker BioSpec 7T MR scanner (Bruker Biospin MRI GmbH, Germany). Anatomic images were obtained by a RARE sequence in the coronal plane (TR/TEeff1/TEeff2 = 3500/19.4/56.8 ms, slice thickness = 0.5 mm, in-plane resolution = 100 x 100 μm2). For proton MRS, a PRESS pulse sequence3 (TR/TE = 2500/10 ms) was used from the hippocampus (1.5 x 6.0 x 1.5 mm3, NA=400) and the thalamus (2 x 5.5 x 1.5 mm3, NA =360). After completion of MRS studies, open field testing (OFT) was performed to examine locomotor activity4. Activity in the open field was quantified using a computer-operated activity monitor program. Peripheral move distance (cm), peripheral ambulatory time (sec) center entries (number of times), and center ambulatory time (sec) were recorded. Data were divided into 10-min and 20-min intervals over the 60 min test session.Results
Following 7 months of alcohol feeding, histopathological analysis of the liver revealed lipid droplet accumulation, hepatocyte ballooning and degeneration, inflammatory cellular infiltration, and fibrosis (Figure 1). Glutamine levels were significantly higher in both the thalamus and hippocampus of the alcohol-treated mice than in controls. Thalamic levels of taurine and creatine were significantly diminished (Figure 2) and were strongly correlated with the alcohol-induced depressive behavior observed in an open field test (Figure 3 and 4). In addition, significant elevations in hippocampal glutamate were indicative of upregulated local glutamatergic activation (Figure 2).Discussion
The main findings for the alcohol-fed mice are: 1) osmotic and/or oxidative stress in the brain resulting from Gln and Tau depletion; 2) depressive behavior is correlated with decreased levels of both thalamic Tau and tCr; and 3) upregulated hippocampal glutamatergic system, as demonstrated by Glu. All of these neurochemical abnormalities could contribute to the development of alcohol-induced HE, specifically expressing depressive behavior in the mouse model of LALF.
Gln is an end-product of ammonia detoxification, a process that gains importance in chronic alcoholism, in that ammonia toxicity is a key symptom of liver damage. Conversion of ammonia to Gln in astrocytes is a rapid, efficient process5,6. However, the elevated levels of Gln produced during this detoxification process can result in osmotic and oxidative stress, leading to excessive production of free radicals and induction of mitochondrial permeability (which precedes mitochondrial swelling), a phenomenon known to cause astrocyte dysfunction7.
Acute administration of Tau has been shown to inhibit locomotor activity that was stimulated by alcohol ingestion8, suggesting that Tau can alter the locomotor simulative and depressive actions of alcohol, which agrees with our observations. It is also possible that thalamic Tau depletion results from osmotic and oxidative stresses caused either directly by the metabolites of alcohol produced in the brain, and/or those derived from damaged liver.
Chronic alcohol consumption reduces hepatic mitochondrial oxidative phosphorylation by suppressing the synthesis of key protein subunits that are encoded by mitochondrial DNA (mtDNA)9,10. Since Cr/PCr balance reflects control of the brain’s high-energy phosphate metabolism11, decreased thalamic Cr and PCr levels may reflect energy depletion, which might also diminish locomotor activity12,13.
Chronic use of alcohol appears to upregulate NMDA receptor expression in the brain14. Alterations in the subunit composition of Glu receptors have been observed following chronic administration of alcohol to mice12. Observation of elevated hippocampal Glu in mice with late-stage alcoholic liver fibrosis provides further evidence that the chronic intake of alcohol results in upregulation of the glutamatergic system.
Our pilot findings provide novel insight into the development of alcohol-induced HE. In addition, proton MRS represents a valuable tool to study and monitor the process of the disease.
Acknowledgements
This work was supported in part by the Chair’s Research Seed Fund (2014), the University of Maryland Innovation Seed Grant (2012), and GE Healthcare/Radiology Society of North America Resident Research Grant, (#RR1250, 2012).References
1. de la M Hall P, Lieber CS, DeCarli LM, et al. Models of alcoholic liver disease in rodents: a critical evaluation. Alcohol Clin Exp Res. 2004; 25: 254S-261S.
2. Cao Q, Mak KM, Lieber CS. Dilinoleoylphosphatidylcholine decreases acetaldehyde-induced TNF-alpha generation in Kupffer cells of ethanol-fed rats,. Biochem Biophys Res Commun. 2002; 299: 459-464.
3. Xu S, Ji Y, Chen X, et al. In vivo high-resolution localized 1H MR spectroscopy in the awake rat brain at 7 T. Magn Reson Med. 2012; 69: 937-943.
4. Wang J, Cui Y, Feng W, et al. Involvement of the central monoaminergic system in the antidepressant-like effect of catalpol in mice. Biosci Trends. 2014; 8: 248-252.
5. Yudkoff M, Nissim I, Pleasure D. Astrocyte metabolism of [15N] glutamine: implications for the glutamine-glutamate cycle. J Neurochem. 1988; 51: 843-850.
6. Sonnewald U, Westergaard N, Jones P, et al. Metabolism of [U-13C5] glutamine in cultured astrocytes studied by NMR spectroscopy: First evidence of astrocytic pyruvate recycling. J Neurochem. 1996; 67: 2566-2572.
7. Albrecht J, Norenberg MD. Glutamine: a Trojan horse in ammonia neurotoxicity. Hepatology. 2006; 44: 788-794.
8. Aragon CMG, Trudeau LE, Amit Z. Effect of taurine on ethanol-induced changes in open-field locomotor activity. Psychopharmacology (Berlin). 1992; 107: 337-340.
9. Cunningham CC, Coleman WB, Spach PI. The effects of chronic ethanol consumption on hepatic mitochondrial energy metabolism. Alcohol. Alcohol. 1990; 25: 127-136.
10. Cahill A, Cunningham CC. Effects of chronic ethanol feeding on the protein composition of mitochondrial ribosomes. Electrophoresis. 2000; 21: 3420-3426.
11. A. Sartorius, P. Lugenbiel, M.M. Mahlstedt, et al. Proton magnetic resonance spectroscopic creatine correlates with creatine transporter protein density in rat brain, J. Neurosci. Methods. 172 (2008) 215-219. 12. D. P. Holschneider, J.M. Maarek. Brain maps on the go: functional imaging during motor challenge in animals, Methods. 45 (2008) 255-261.
13. P.W. Kalivas, L. Churchill, A. Romanides. Involvement of the pallidal-thalamocortical circuit in adaptive behavior, Ann. N.Y. Acad. Sci. 877 (1999) 64-70.
14. M. Qiang, M.K. Ticku. Role of AP-1 in ethanol-induced N-methyl-D-aspartate receptor 2B subunit gene up-regulation in mouse cortical neurons, J. Neurochem. 95 (2005) 1332-1341.
Figures