4073
Effect of administration time of hydrogen sulfide on neuroprotective effects in the cerebral ischemia/reperfusion injury model1Asan Institute for Life Sciences, Asan Medical Center, Seoul, Korea, Republic of, 2Department of Radiology, Asan Medical Center, 3Medical research institute, Gangneung Asan Hospital
Synopsis
Recent evidence indicated that hydrogen sulfide is capable of attenuating ischemia/reperfusion (I/R) injury in brain. However, the influence of H2S administration timing on its neuroprotective efficacy has not yet been assessed, thus we aimed to perform this study which used MRI and 1H-MRS in rats with focal cerebral I/R injury. Our study demonstrated that hydrogen sulfide administration at 1 minute before reperfusion showed better neuroprotective effect than that at 30 minutes before reperfusion.
PURPOSE
Emerging evidences have suggested that hydrogen sulfide (H2S) may alleviate the cellular damage associated with cerebral ischemia/reperfusion (I/R) injury by inhibiting oxidative stress, inflammation, and apoptosis.1,2 We hypothesized that the time of H2S delivery has influence upon its neuroprotective efficacy. We aim to prove our hypothesis with the use of magnetic resonance imaging (MRI) and 1H magnetic resonance spectroscopy (1H-MRS).METHODS
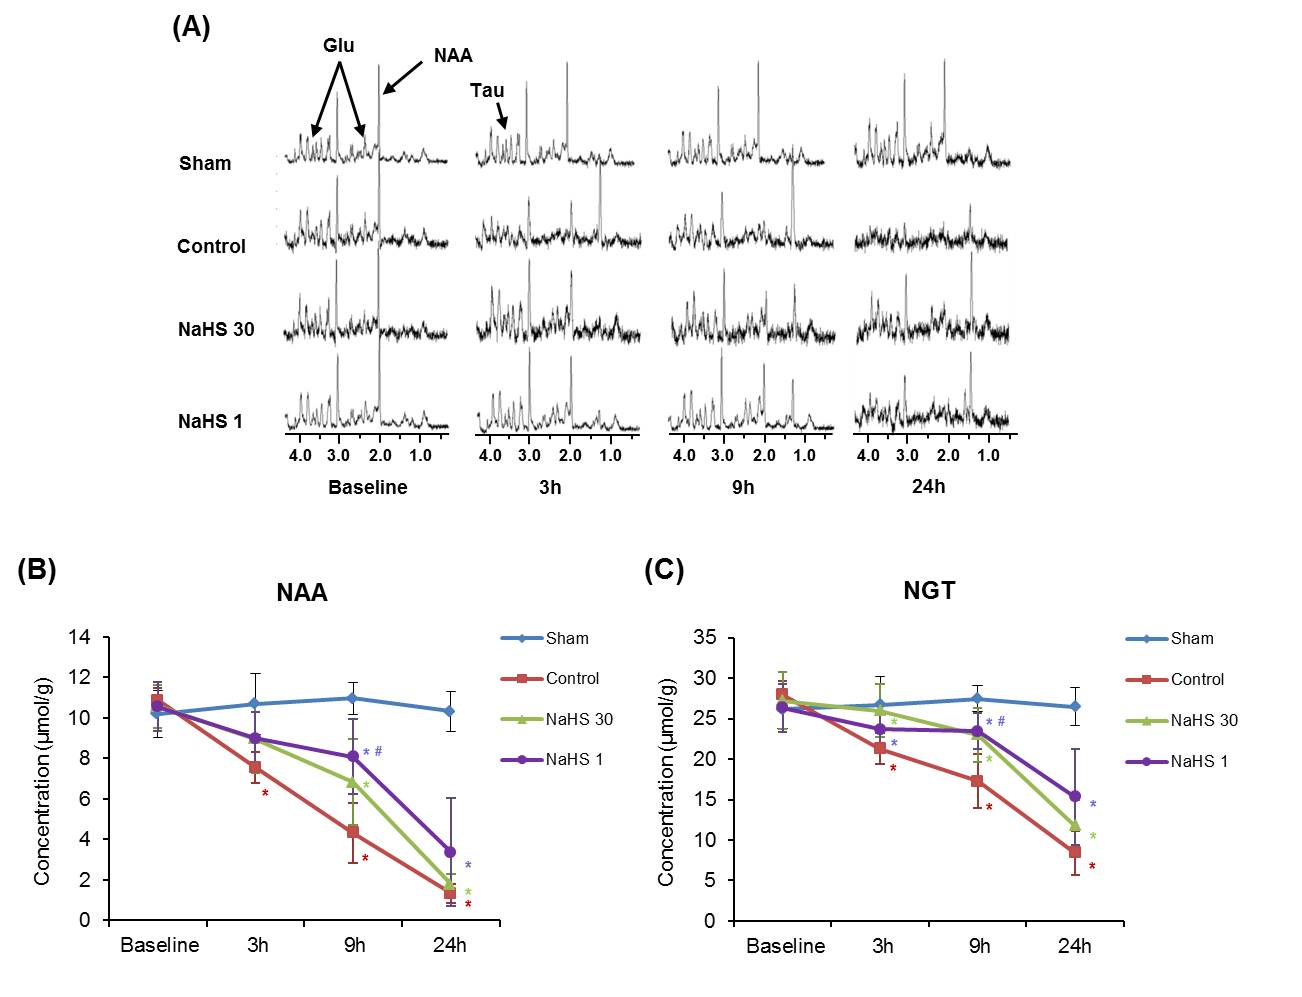
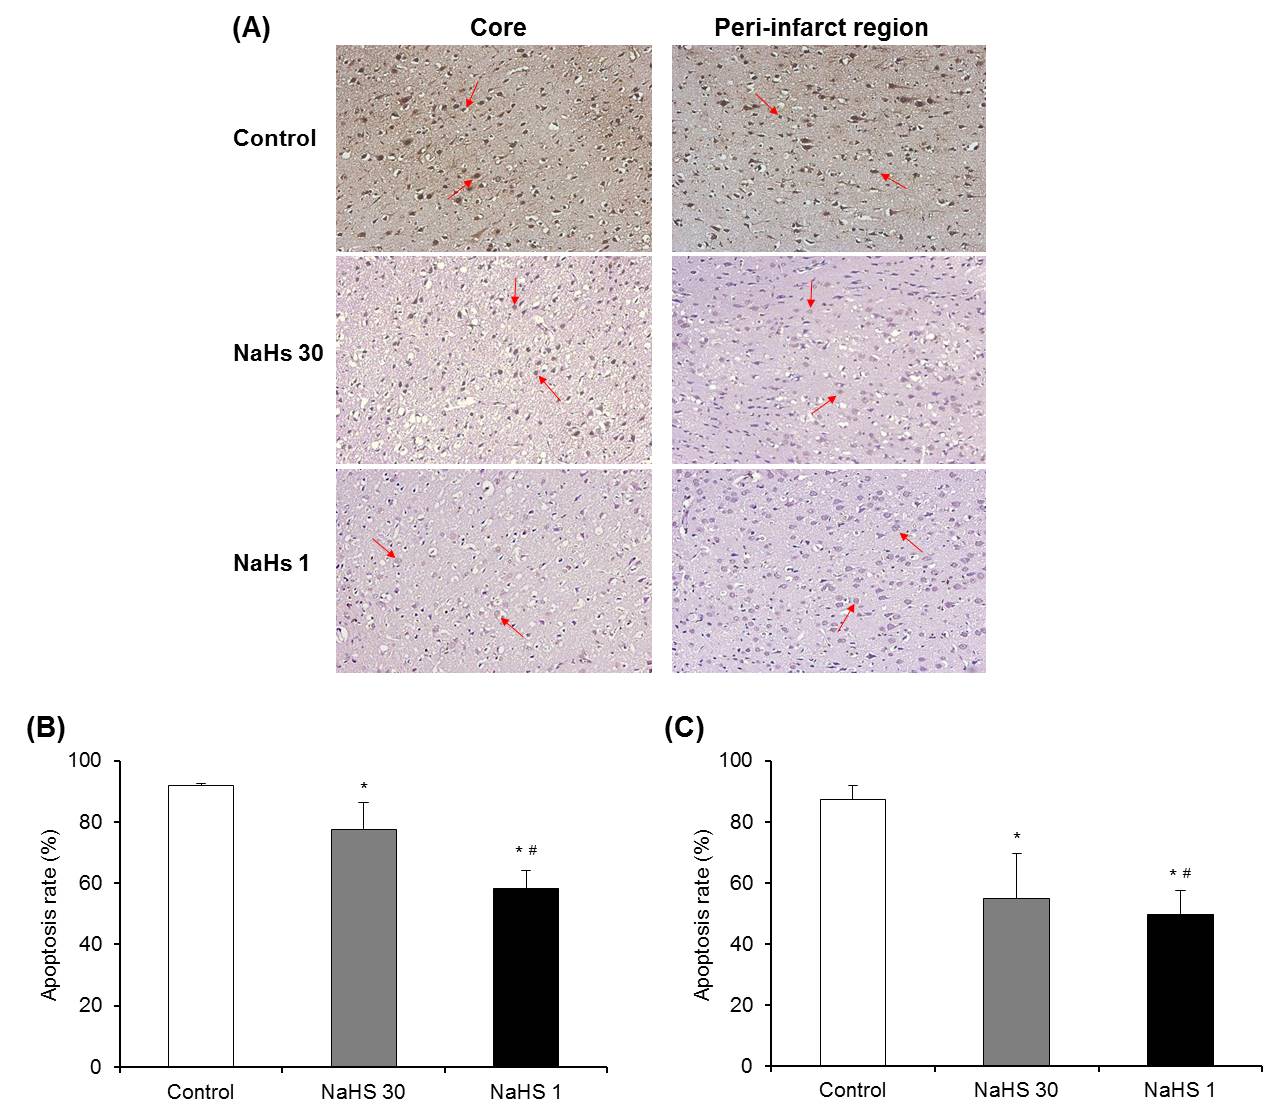
Animal model: Transient middle cerebral artery occlusion model with temporary intraluminal thread insertion for 60 minutes was used for I/R injury. As a H2S donor, sodium hydrosulfide (NaHS) dissolved in saline were used. Thirty-two male Sprague-Dawley rats were randomly divided into four groups: NaHS-30 and NaHS-1 (NaHS administration 30 and 1 minutes before reperfusion, respectively), sham (no I/R injury), and control (I/R injury) groups. Rats were sacrificed 24 hours after ischemia and histologic analysis was performed including apoptosis rate analysis using Terminal deoxynucleotidyl transferase dUTP nick end labeling (TUNEL).3MRI and 1H-MRS: MRI and 1H-MRS were obtained at baseline (i.e. before ischemia) and 3, 9, and 24 hours after ischemia. MRI included T2 map, T2-weighted images (T2-WI) and apparent diffusion coefficient (ADC) map. 1H-MRS was performed to analyze concentrations of N-acetyl-L-aspartate (cNAA) and NAA + glutamate + taurine (cNGT).4
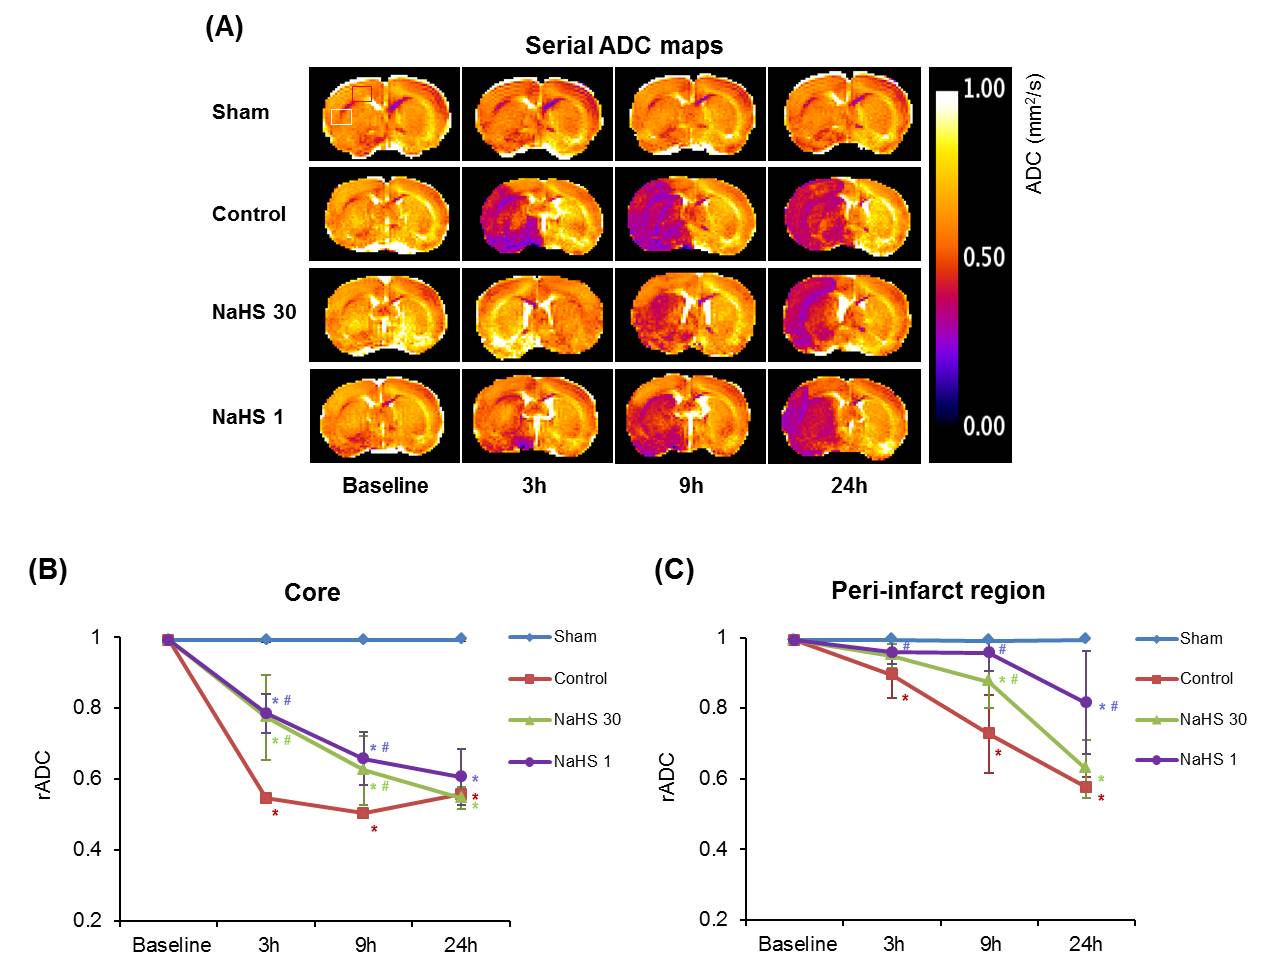
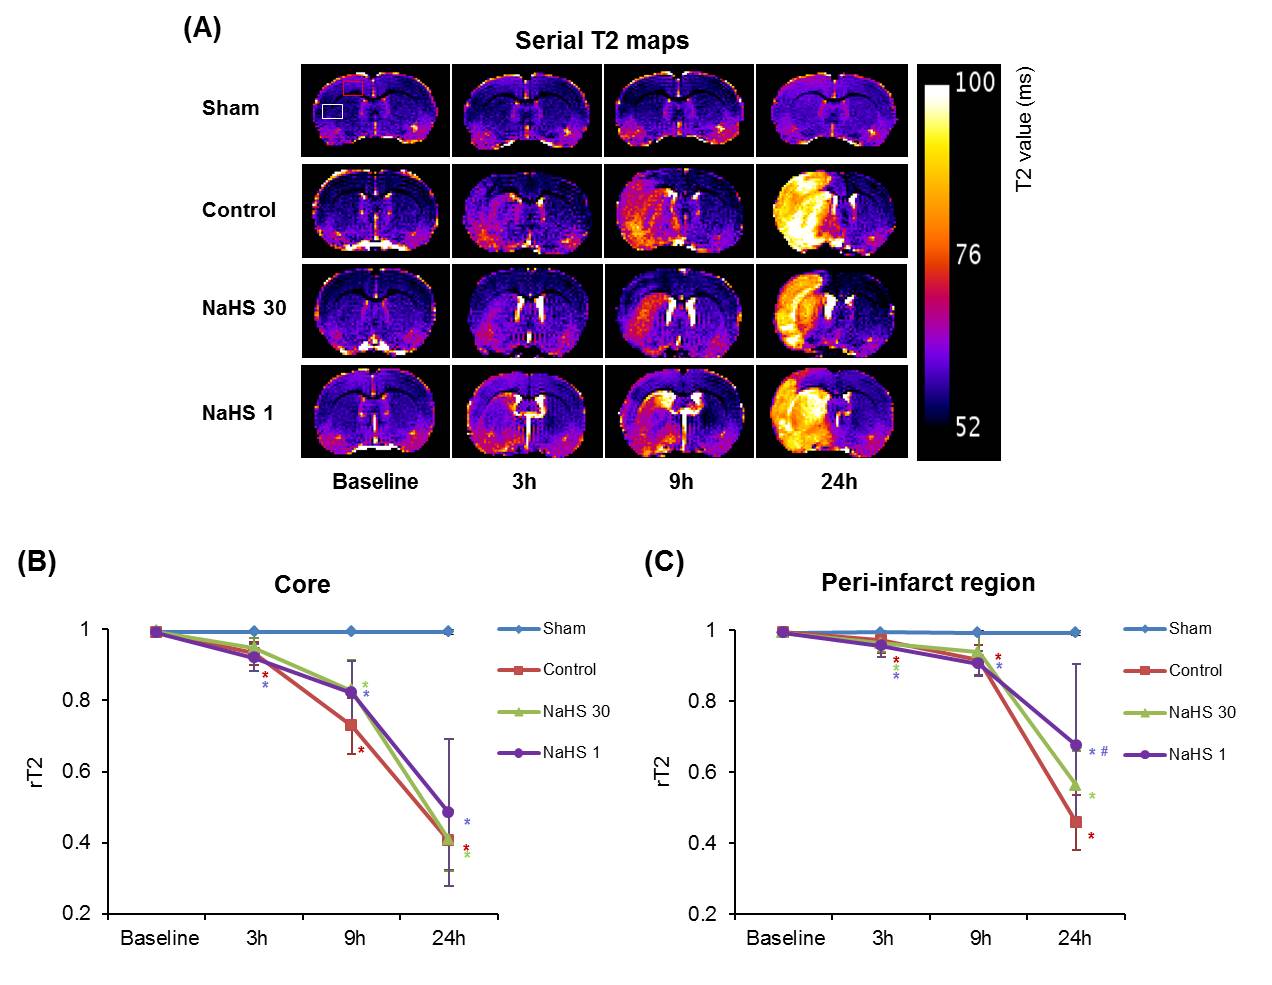
Image analysis: The total infarct volume at 24 hours after ischemia was measured at T2-WI using 2D volumetry technique. The degree of midline shift due to cerebral edema (MLS) was quantified at 24 hours after ischemia on T2-WI. The degree of ischemic injury in the ipsilateral (ischemic core and peri-infarct region) and contralateral regions was evaluated by measuring mean ADC values on ADC map, T2 values on T2 map, and cNAA and cNGT on 1H-MRS.5 The relative values of ADC (rADC) and T2 (rT2) were calculated as ratios, i.e., ipsilateral value / contralateral value.
Statistical analysis: The total infarct volume, MLS, rADC, rT2, cNAA, cNGT, and apoptosis rate in the four groups were compared by one-way ANOVA with multiple comparison post-hoc test.
RESULTS
Total infarct volume and midline shift: Both total infarct volume and MLS at 24 hours post-ischemia were lowest in the NaHS-1 group, followed by NaHS-30 group and control group, respectively (Fig 1), indicative of neuroprotective effect of NaHS (p<0.05, ANOVA).Degree of ischemic injury: The ischemic/infarcted area showed low rADC, high rT2, low cNAA, and cNGT levels on ADC map, T2 map, and 1H-MRS. On serial ADC maps, the rADC of ischemic core decreased over time and reached at similar level 24 hours post ischemia in control, NaHS-1, NaHS-30 groups (Fig 2). In contrast, the serial change of rADC of peri-infarct region differed significantly between groups; the highest value was observed in NaHS-1 group, followed by NaHS-30 group, and control group, also suggesting better neuroprotective effects in NaHS-1 group compared to NaHS-30 group. The rT2 value also showed similar tendency with rADC in that rT2 of peri-infarct region differed significantly between NaHS-1 group and NaHS-30 group (Fig 3). However, on serial 1H-MRS of both ischemic core and peri-infarct region (Fig 4), the cNAA and cNGT did not differ significantly between NaHS-1 group and NaHS-30 group.
Degree of apoptosis: In both the ischemic core and peri-infarct regions, apoptosis rate was significantly lower in NaHS treatment groups compared with control group and also significantly lower in NaHS-1 group than in NaHS-30 group (Fig 5).
DISCUSSION
The present study demonstrated that H2S treatment 1 minute before reperfusion showed better neuroprotective effect than H2S treatment 30 minutes before reperfusion based on volumetry, ADC map, and histologic examination. ADC map was the most sensitive sequence to evaluate the therapeutic effects of NaHS.CONCLUSION
The timing of H2S treatment has influenced on its neuroprotective effects. In order to incorporate these results into the clinical application, further studies investigating the precise time-dependent H2S efficacy against cerebral I/R injury and the mechanism of neuroprotective effect are required.Acknowledgements
No acknowledgement found.References
1. Gheibi S, Aboutaleb N, Khaksari M, et al. Hydrogen sulfide protects the brain against ischemic reperfusion injury in a transient model of focal cerebral ischemia. J Mol Neurosci. 2014;54(2):264-270.
2. Yin J, Zeng QH, Shen Q, et al. Neuroprotective mechanism of hydrogen sulfide after cerebral ischemia-reperfusion in rats. Zhonghua Yi Xue Za Zhi. 2013;93(11):868-872.
3. Zhao H, Sapolsky RM, Steinberg GK. Interrupting reperfusion as a stroke therapy: Ischemic postconditioning reduces infarct size after focal ischemia in rats. J Cereb Blood Flow Metab. 2006;26(9):1114-1121.
4. Prichard JW. The ischemic penumbra in stroke: Prospects for analysis by nuclear magnetic resonance spectroscopy. Res Publ Assoc Res Nerv Ment Dis. 1993;71:153-174.
5. Barber PA, Hoyte L, Kirk D, et al. Early t1- and t2-weighted mri signatures of transient and permanent middle cerebral artery occlusion in a murine stroke model studied at 9.4 t. Neurosci Lett. 2005;388(1):54-59.
Figures
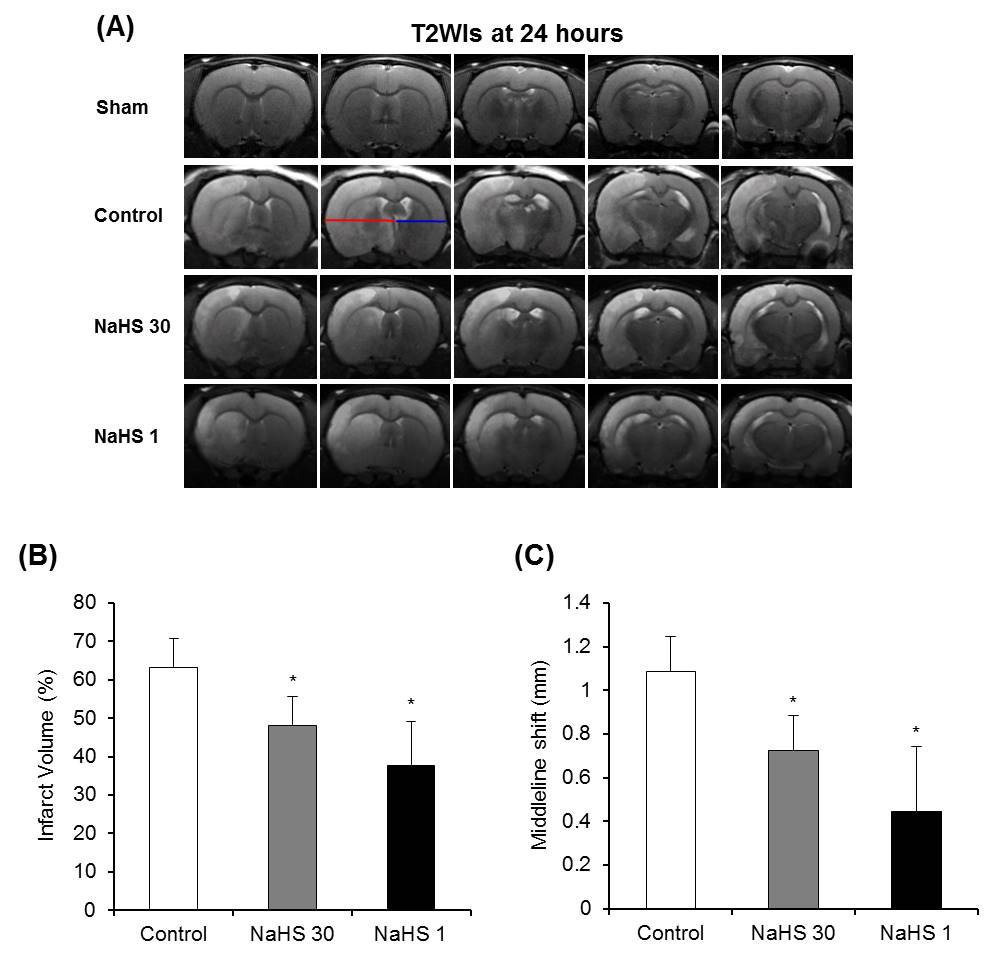
Figure 1. Total infarct volumes and Midline shift (MLS). (A) On T2-WIs at 24 hours after ischemia in representative rat of each group, MLS which is the distance between the outer border of the cortex and the middle of the third ventricle, was measured from the ipsilateral (red line) and contralateral (blue line) side. (B, C) Total infarct volume (B) and MLS (C) were lowest in the NaHS-1 group, followed by NaHS-30 group and control group, respectively. Data are the mean ± SD (n=8 rats in each group). *P < 0.001 vs. the control group.