4069
Predicting visual function clinical outcome in MS: a MRI and OCT metrics study.1Neurology, University of California, San Francisco, San Francisco, CA, United States, 2University of Pavia, Italy, 3DINOGMI, University of Genova, Italy, 4Imaging Genetics Center, Stevens Neuroimaging and Informatics Institute, University of Southern California, United States, 5Basel University Hospital, Switzerland
Synopsis
Fifty Multiple Sclerosis subjects were evaluated by optical coherence tomography and MRI, including multi-shell and putative myelin content imaging focused on primary visual area, thalamus and cerebellum. Predictive models of visual function performance, measured by visual evoked potentials and low contrast visual acuity were tested using a partial least square regression analysis. Combination of MRI and OCT metrics appears to strongly describe the visual function. Myelin content imaging, in particular, has a strong predictive value once there is history of optic neuritis. These preliminary results may improve the understanding of the pathological mechanisms underlying clinical dysfunction in multiple sclerosis.
INTRODUCTION
Multiple sclerosis (MS) is an autoimmune disease in which an aberrant immune response targets CNS myelin, leading to neurological disability. The initial inflammatory demyelinating injury that characterizes the earlier phases of disease appears to be accompanied by neurodegeneration and irreversible neuronal loss. Up to 70% of MS patients experience optic neuritis (ON) during the disease (1), causing acute visual dysfunction and leaving patients with some measurable visual dysfunction including deficits in low contrast vision and persistent latency delays on VEP. The visual pathway is anatomically well defined and functionally discrete with well-validated measures that are both quantifiable and sensitive. For this reason, it has been studied and used as model for understanding the pathological processes that underlie permanent neurological dysfunction in the disease (2). Magnetic resonance imaging (MRI) has been used to study MS and assess in-vivo lesion burden, demyelination and neurodegeneration (3). Morphological and conventional imaging shows a poor correlation with neurological disability (4). Optical coherence tomography (OCT) was developed and has been used to quantitatively assess inner retinal pathology in optic neuropathies. Despite multiple studies based on both techniques in MS, the capacity of these techniques to predict visual dysfunction in MS has not been explored. We investigated the ability of a combination of MRI and OCT metrics in describing the visual function, measured by low contrast letter acuity (LCLA) and visual evoked potentials (VEP), in MS patients with and without previous ON history.METHODS
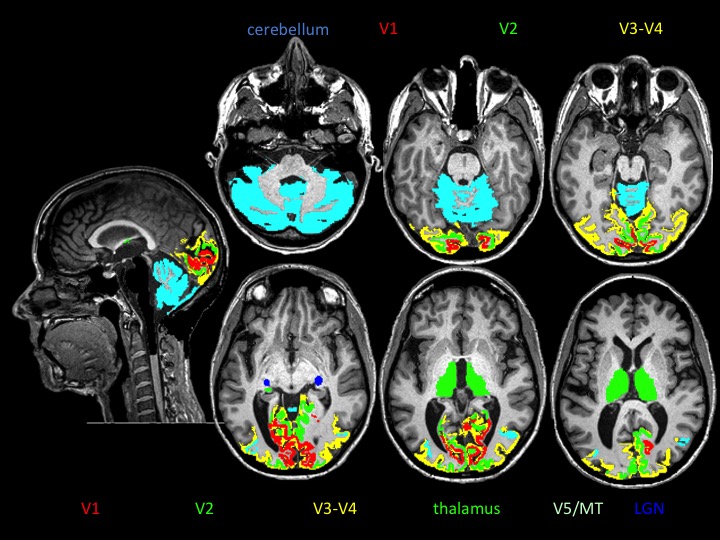
Subjects: 50 patients enrolled in a clinical trial were studied (age 40.1±10 years, EDSS 2.1±1, and disease duration 5.1±5 years) looking at baseline values and assessments (prior to treatment). Twenty-six patients had previous history of ON (interval 3.9±3). MRI acquisition: Each subject underwent brain MRI scan on a 3T Siemens Skyra. The MRI protocol included standard sagittal 3D MPRAGE (voxel size 1x1x1 mm3), two-shell NODDI protocol (30 & 64 directions at b = 700 & 2000 s/mm2, 2.2 mm3 cubic voxel) and multi echo gradient echo (MEGE) sequence for putative myelin content quantification (5). Lesion burden: The number of occipital cortical lesions and total white matter lesion burden in the optic radiation were detected and segmented, respectively, by an expert neuroradiologist. MRI processing: Automated parcellation of T1 volumes was performed using Freesurfer Image Analysis Suite Version 5.3. The thalamus, cerebellar cortex and primary visual area (V1, Brodman area 17) were selected as volumes of interest (VOIs) (Figure 1). After correcting for distortions due to eddy current and head motion, maps of mean diffusivity (MD) were calculated by fitting the diffusion tensor model within each voxel using dipy_fit_tensor (6). The NODDI model was fitted to the diffusion datasets in MATLAB. Maps of orientation dispersion index (ODI) (7) and “myelin water” content were computed (5). Maps were registered to T1 space using FLIRT and FNIRT. Mean values per each MRI metric were calculated within each VOI averaging left and right hemisphere. OCT: Spectral-Domain OCT (Spectralis, Heidelberg Engineering). We evaluated peripapillary retinal nerve fiber layer (pRNFL) thickness and macular volume (6 mm ring area) with automated segmentation of retinal layers for the quantification of Ganglion Cell Layer (GCL) thickness.RESULTS
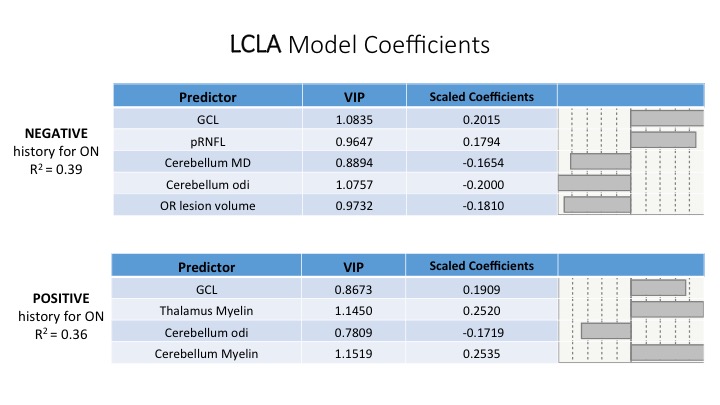
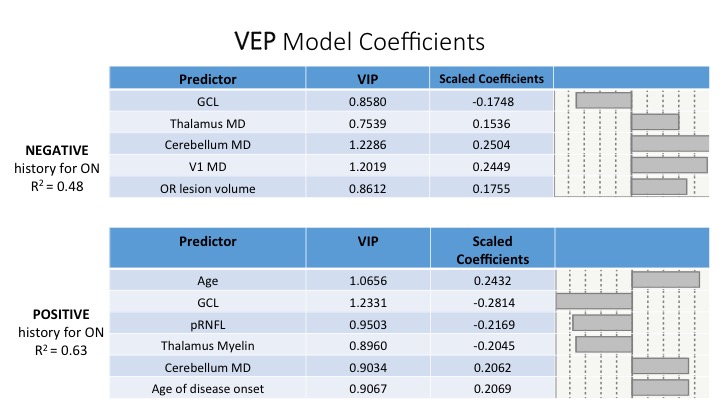
We performed a partial least square regression analysis to model LCLA and VEP based on a combination of demographics, MRI (MD, myelin, ODI) and OCT metrics (GCL, pRNFL) considering negative/positive history of ON. Left and right MRI and OCT metrics were averaged in a single measure. We identified model predictors of LCLA with R-squared up to 0.39 and 0.36 for ON negative and positive respectively (Figure 2). We determined model predictor of VEP with R-squared up to 0.48 and 0.63 for ON negative and positive respectively (Figure 3). Across the different models GCL (VIP=1.06, 0.87, 0.86, 1.23) showed to be the best partial predictor. Diffusion measures (ODI, MD) appeared to be more informative for patients with no history of ON, whereas putative measures of myelin content (in the thalamus and cerebellum) gained importance when we evaluated ON positive patients.DISCUSSION & CONCLUSION
We report multimodality models (including MRI and OCT metrics) as predictors of the variability of MS patients’ visual performance. Looking at subjects with negative history of ON, OCT metrics, lesion burden and diffusion metrics, possibly markers of neurodegeneration, seem to better describe the visual function outcome. Putative myelin content marker assumes a stronger predictor role once analyzing patients with previous history of ON. In conclusion a combination of advanced MRI technique and OCT metrics seem to predict visual performance and may improve our understanding of the pathological mechanism underlying clinical dysfunction in MS patients.Acknowledgements
No acknowledgement found.References
1) Toosy AT, Mason DF, Miller DH. Optic neuritis. Lancet Neurol. 2014;13(1):83-99.
2) Martínez-Lapiscina EH, Sanchez-Dalmau B, Fraga-Pumar E, et al. The visual pathway as a model to understand brain damage in multiple sclerosis. Mult Scler. 2014;20(13):1678-85.
3) Filippi M. MRI measures of neurodegeneration in multiple sclerosis: implications for disability, disease monitoring, and treatment. J Neurol. 2015;262(1):1-6.
4) Filippi M, Rocca MA, Barkhof F, et al. Association between pathological and MRI findings in multiple sclerosis. Lancet Neurol. 2012;11(4):349-60.
5) Neeb H, Schenk J, Weber B. Multicentre absolute myelin water content mapping: Development of a whole brain atlas and application to low-grade multiple sclerosis. Neuroimage Clin. 2012;1(1):121-30.
6) Garyfallidis E, Brett M, Amirbekian B, et al. Dipy, a library for the analysis of diffusion MRI data. Front Neuroinform. 2014;8:8.
7) Zhang H, Schneider T, Wheeler-Kingshott CA, et al. NODDI: practical in vivo neurite orientation dispersion and density imaging of the human brain. Neuroimage. 2012;61(4):1000-16.
Figures