4068
Progressive Iron Accumulation in Multiple Sclerosis Phenotypes Revealed by Sparse Classification of Deep Gray Matter1Biomedical Engineering, University of Alberta, Edmonton, AB, Canada, 2Division of Neurology, University of Alberta, Edmonton, AB, Canada
Synopsis
Purpose: To create an anatomically-interpretable framework for localized analysis of brain iron accumulation/demyelination, and apply this framework to Multiple Sclerosis (MS) Deep Gray Matter (DGM).
Materials and Methods: Quantitative Susceptibility and R2* maps were computed for 110 MS and 75 control subjects.
Results: Significant iron accumulation and insignificant demyelination were detected in MS DGM. Common MS pathological volumes and their pathological effect size progressively increased with advanced phenotypes. The developed framework offered improved statistical power and iron specificity compared to whole structure and singular analysis.
Conclusion: Using a novel localized analysis pipeline, we demonstrated the progressive iron accumulation in MS DGM.
INTRODUCTION
Deep Gray Matter (DGM) iron in Multiple Sclerosis (MS) has been studied using whole structure analysis1-4 and threshold-based Voxel Based Analysis (VBA)5-6 of R2* maps1-4,6 or phase images1,5. Whole structure analysis does not allow investigation of localized changes within the structures, while VBA cannot identify pathologies that cover multiple anatomical regions because it considers each voxel independently. Furthermore, delineation of iron accumulation and demyelination has been shown to be possible with the combined use of Quantitative Susceptibility (QS) and R2* mapping7, where a mutual increase would indicate iron accumulation, while an an opposing change in QS and R2* would indicate neuronal myelin changes.PURPOSE
To create an anatomically interpretable automated framework for localized analysis of DGM iron accumulation/demyelination, and apply this framework to comparatively evaluate MS phenotypes relative to healthy controls.METHODS
We prospectively enrolled 16 Clinically Isolated Syndrome (CIS), 41 Relapsing Remitting (RR), 40 Secondary Progressive (SP), 13 Primary Progressive (PP) MS patients, and 75 healthy control subjects. To account for correlation of DGM iron with healthy aging8, control and patient datasets were retrospectively selected to optimize age matching. Written informed consent was obtained from all participants after the internal institutional review board approved the study design.
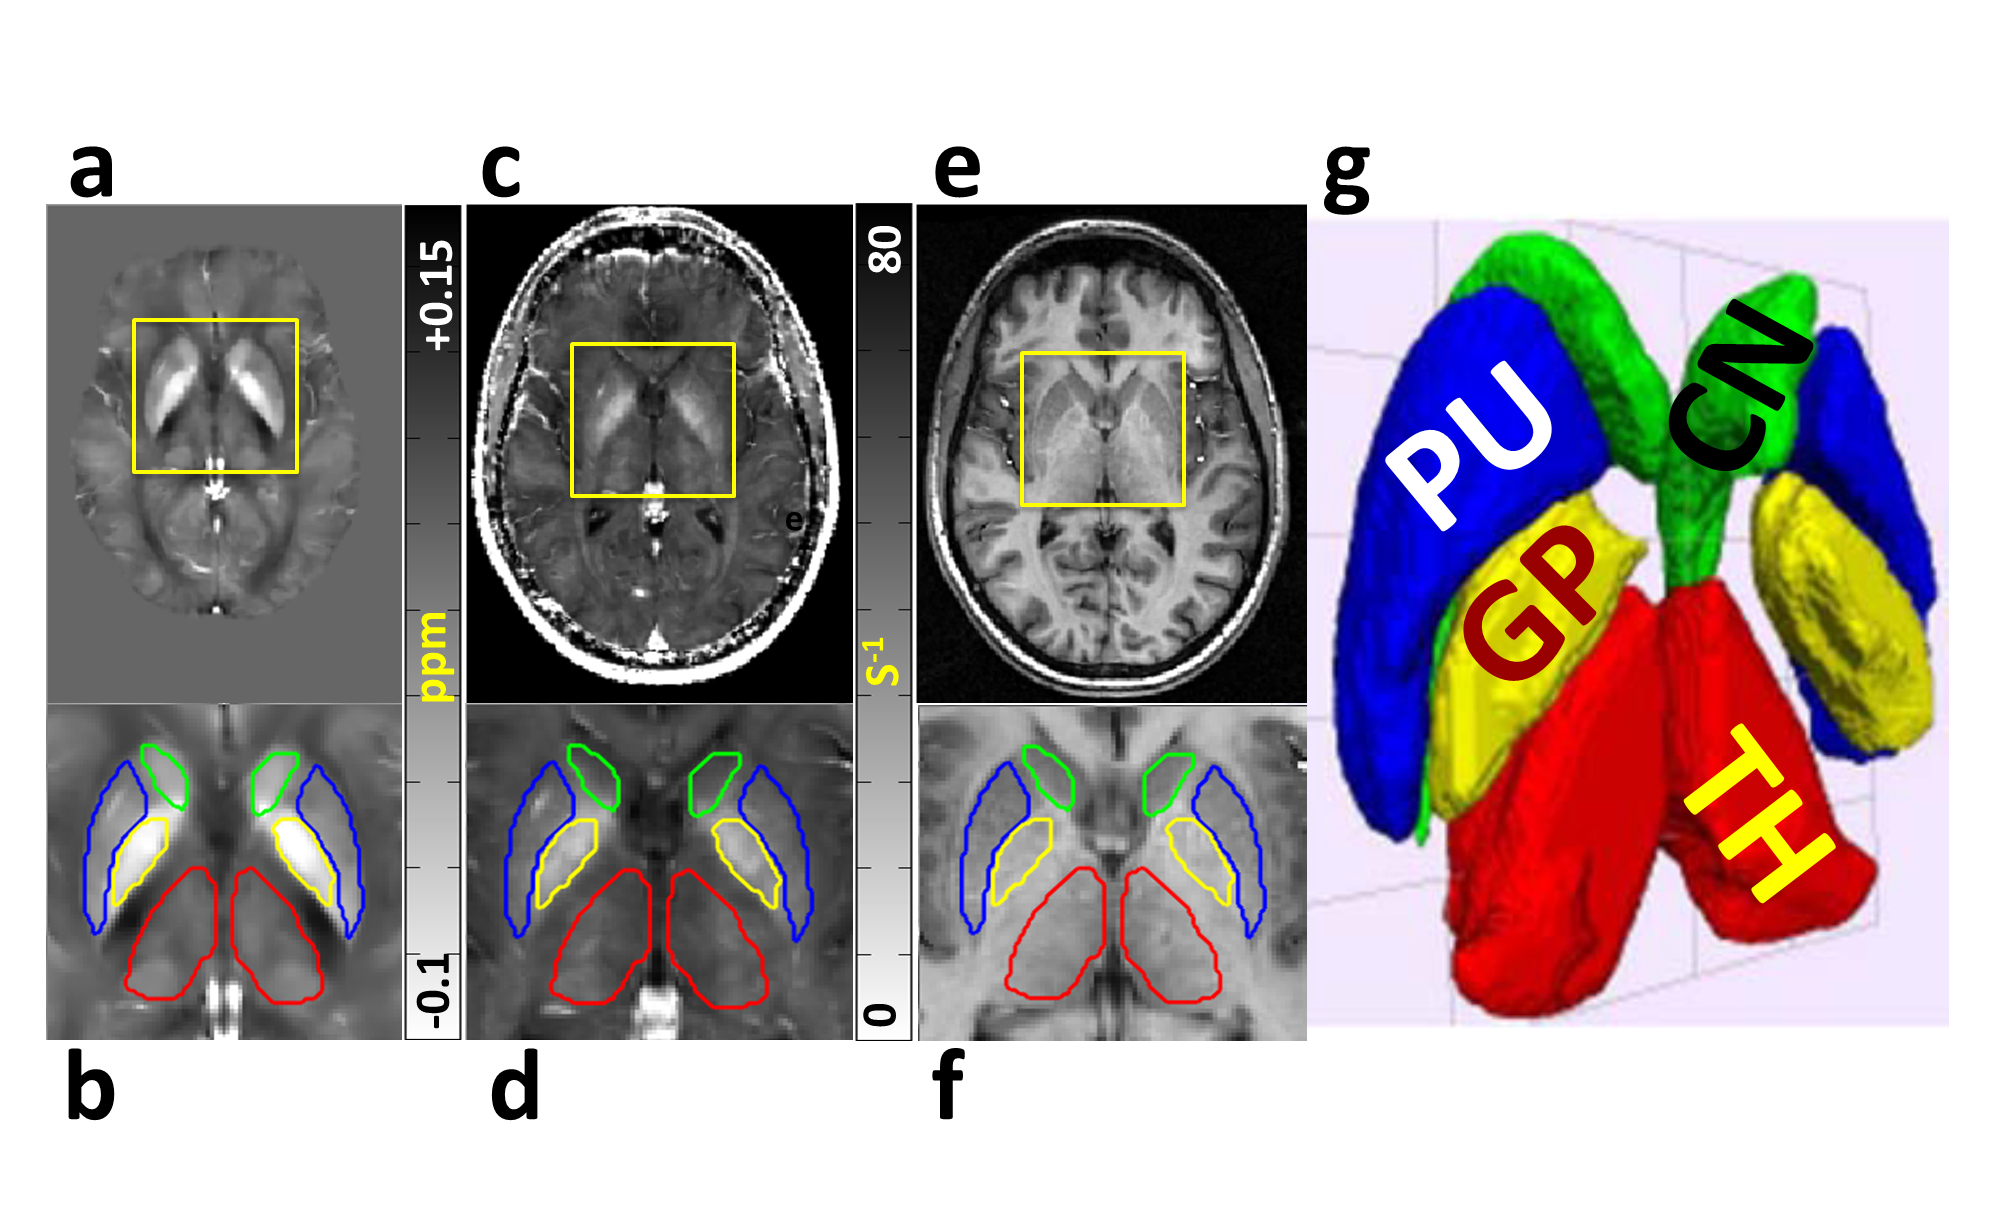
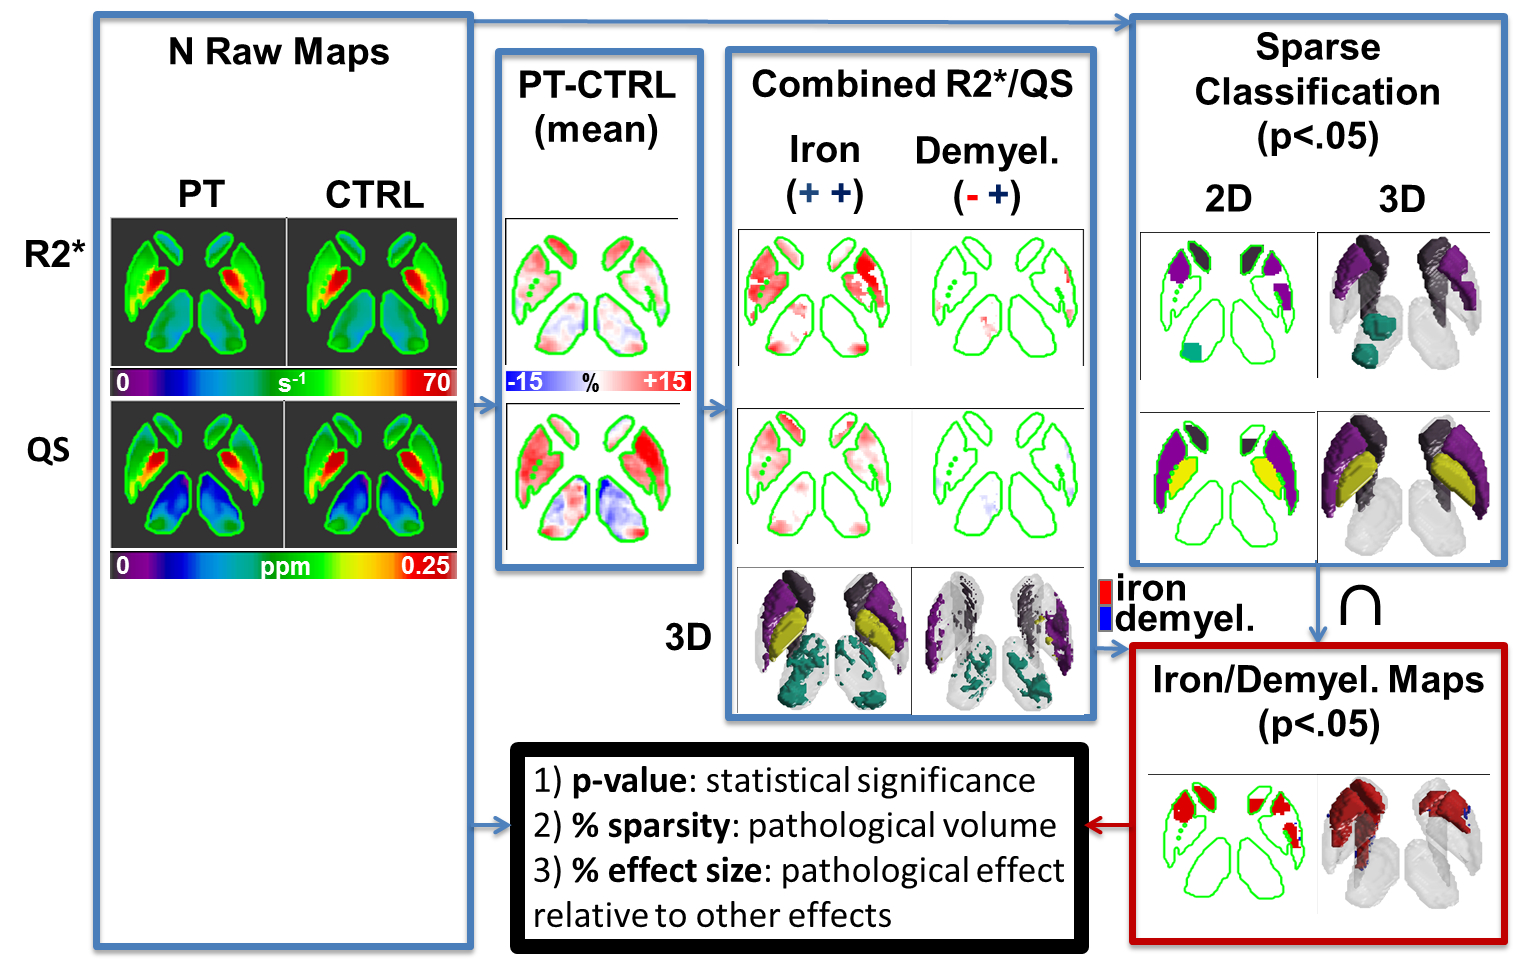
R2* and QS maps were calculated from a multi-echo gradient echo acquisition. R2* maps were computed using mono-exponential fitting. QS maps were calculated after phase unwrapping using PRELUDE/FSL, brain extraction using FSL Brain Extraction Tool, background field removal using Regularization-Enabled Sophisticated Harmonic Artifact Reduction for Phase data9, and finally deconvolution using total variation dipole inversion.10 Segmented DGM structures were extracted from R2* and QS maps (Figure 1), after registering all patients and controls to a global atlas computed from QS maps and T1-weighted images.6 The difference between the mean of all patient and control data was used to identify areas of positive/negative change in MS compared to control, which was then used to identify clusters of iron accumulation / demyelination. Sparse classification was used to identify regions that are significantly different between patients and controls. Sparsity and compactness were imposed through penalty terms on a logistic regression loss function.
Finally, iron/demyelination voxel labels and the intersection of the R2* and QS significant regions were used to produce maps of common areas of iron/demyelination in patients compared to controls. These maps produced the level of significance of the results (p-value), the percentage of the structure that is commonly contributing to the pathology in patients (% sparsity), and the magnitude of the pathological effect in the DGM compared to other contributing effects (% effect size) (Figure 2).
RESULTS
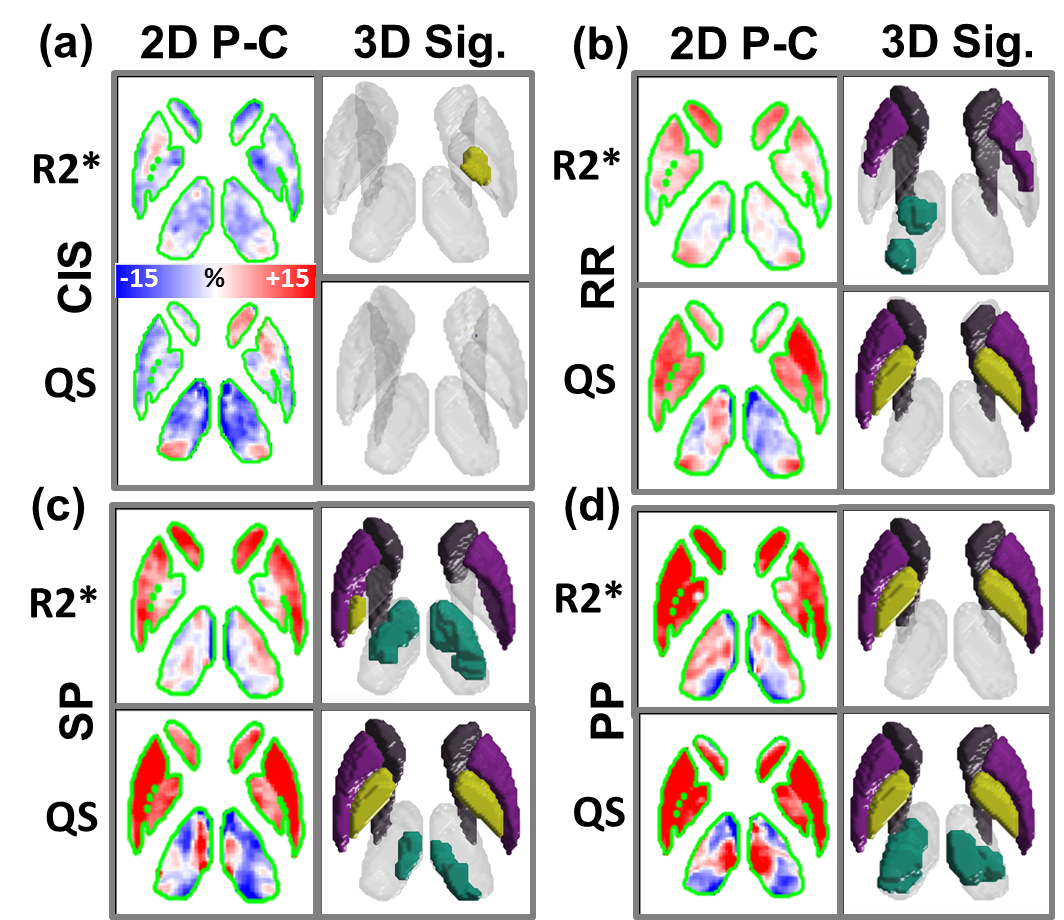
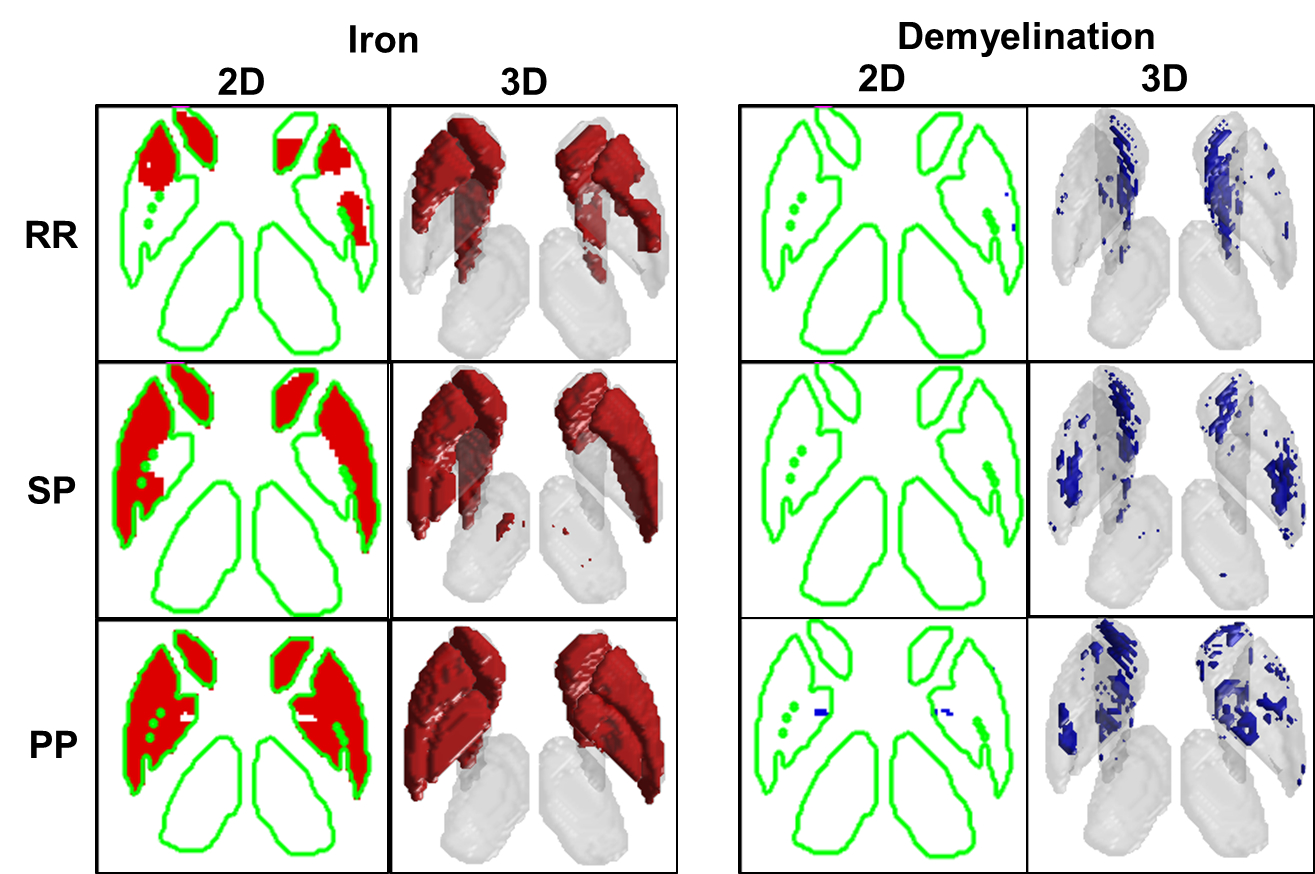
In confirmation of histochemical analysis of formalin-fixed MS brains11, Figure 3 and Figure 4 demonstrates significant (p<0.05) iron accumulation and demyelination in the DGM of MS patients. While DGM volumes labeled with iron accumulation clearly appears to progressively increase with advanced MS phenotypes, demyelination appears to be a highly variable process in MS DGM.
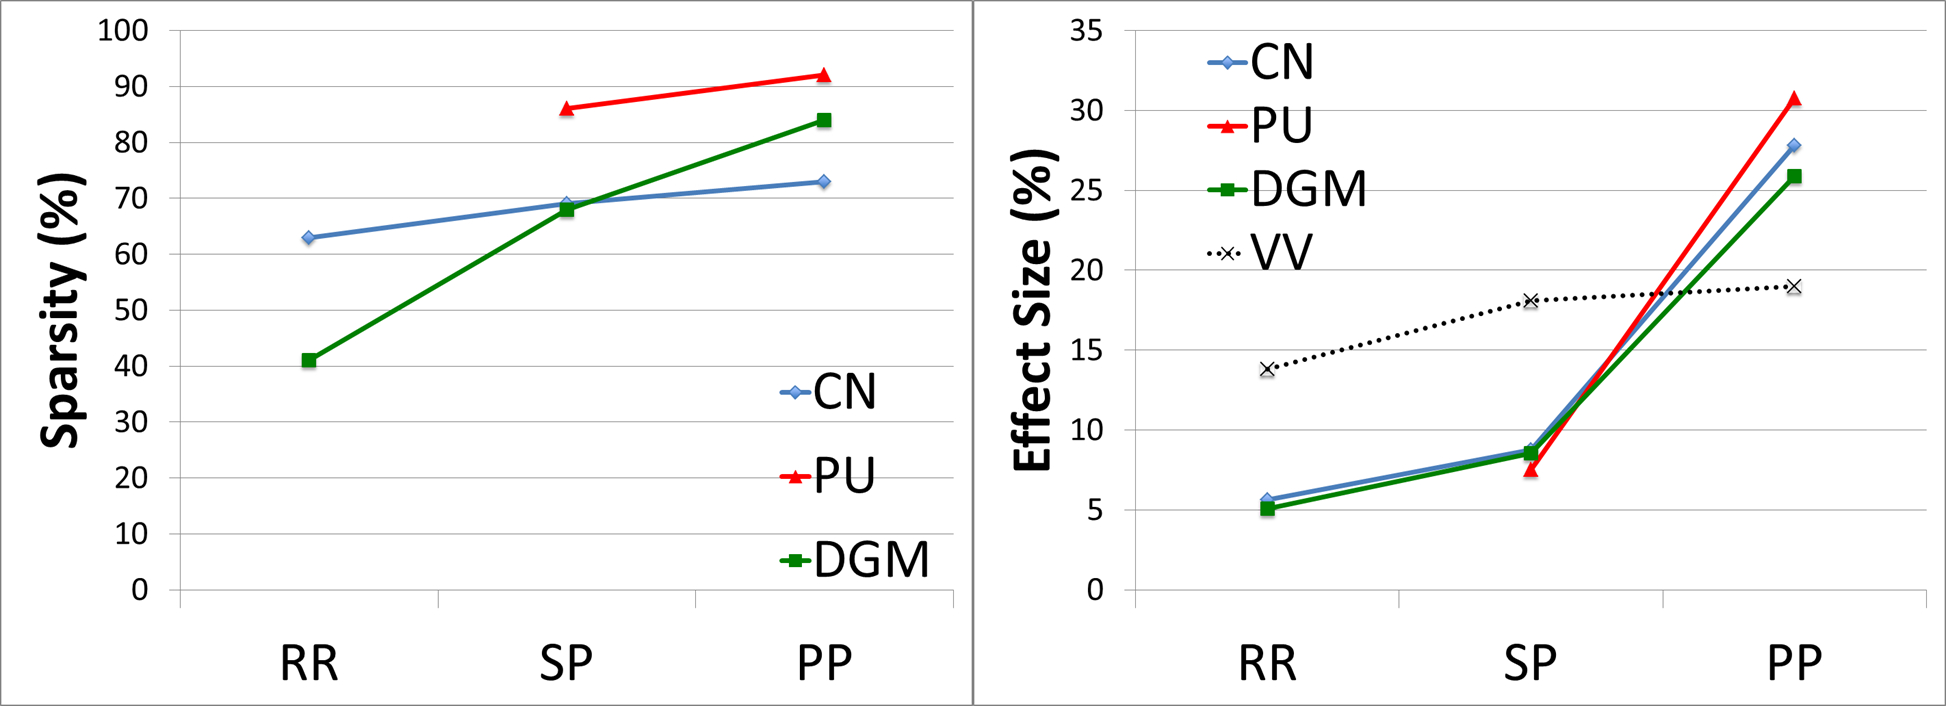
Figure 5 quantitatively demonstrates progressive increase of iron accumulation throughout the disease course of MS. No significant iron accumulation was found in the CIS group, and no significant demyelination in any MS group was detected for any DGM structure using this sample size.
DISCUSSION
In this study, we have shown the progressive iron accumulation in MS using compact and sparse maps of significant iron accumulation throughout the disease course. We have also quantitatively demonstrated the progressive increase of pathological volume suggestive of iron accumulation and effect size in MS. As for the relationship between ventricular volume and iron accumulation, we have confirmed previous reports identifying their negative correlation, which may be suggestive of a degenerative, rather than an inflammatory role.12
Furthermore, we have shown that the pathological effect size of iron accumulation is greatest for PP MS compared to SP MS, while the effect size of ventricular volumes is highest for SP MS compared to RR MS. These observations suggest that inflammation and brain shrinkage dominate the earlier stages of MS, while iron accumulation and neuro-degeneration may be more accentuated in advanced stages of the disease.
These results have been demonstrated by applying a newly developed sparse classification framework to analyze iron accumulation and demyelination patterns in MS case control studies. Advantages of this framework include improved statistical power compared to whole structured analysis, and increased specificity to iron compared to singular R2*/QS analysis.
CONCLUSIONS
Significant iron accumulation and limited demyelination was observed in MS DGM for the studied sample size. Size and pathological effect of common volumes suggestive of iron accumulation has been shown to progressively increase during the clinical stages of MS.Acknowledgements
Grant Support: Multiple Sclerosis Society of Canada and Canadian Institutes of Health Research.References
1. Walsh AJ, Blevins G, Lebel RM, Seres P, Emery DJ & Wilman AH. Longitudinal MR imaging of iron in multiple sclerosis: an imaging marker of disease. Radiology 2014:270:186-196.
2. Ropele S, Kilsdonk ID, Wattjes MP, et al. Determinants of iron accumulation in deep grey matter of multiple sclerosis patients. Mult Scler 2014:20:1692-1698.
3. Khalil M, Langkammer C, Ropele S, et al. Determinants of brain iron in multiple sclerosis: a quantitative 3T MRI study. Neurology 2011:77:1691-1697.
4. Langkammer C, Liu T, Khalil M, et al. Quantitative susceptibility mapping in multiple sclerosis. Radiology 2013:267:551-559.
5. Zivadinov R, Heininen-Brown M, Schirda CV, et al. Abnormal subcortical deep-gray matter susceptibility-weighted imaging filtered phase measurements in patients with multiple sclerosis: a case-control study. Neuroimage 2012:59:331-339.
6. Cobzas D, Sun H, Walsh AJ, Lebel RM, Blevins G & Wilman AH. Subcortical gray matter segmentation and voxel-based analysis using transverse relaxation and quantitative susceptibility mapping with application to multiple sclerosis. J Magn Reson Imaging 2015:42:1601-10.
7. Schweser F, Deistung A, Sommer K, Reichenbach JR Disentangling contributions from iron and myelin architecture to brain tissue magnetic susceptibility by using Quantitative Susceptibility Mapping (QSM). Proc Intl Soc Mag Reson Med 2012; 20: 409.
8. Hallgren B & Sourander P. The effect of age on the non-haemin iron in the human brain. J Neurochem 1958:3:41-51.
9. Sun H & Wilman AH. Background field removal using spherical mean value filtering and Tikhonov regularization. Magn Reson Med 2013:71:1151-7.
10. Bilgic B, Pfefferbaum A, Rohlfing T, Sullivan EV, Adalsteinsson E. MRI estimates of brain iron concentration in normal aging using quantitative susceptibility mapping. Neuroimage. 2012;59:2625-35.
11. Haider L, Simeonidou C, Steinberger G, et al. Multiple sclerosis deep grey matter: the relation between demyelination, neurodegeneration, inflammation and iron. J Neurol Neurosurg Psychiatry 2014:85:1386-1395.
12. Khalil M, Enzinger C, Langkammer C, et al. Quantitative assessment of brain iron by R(2)* relaxometry in patients with clinically isolated syndrome and relapsing-remitting multiple sclerosis. Mult Scler 2009:15:1048-1054.Figures