4067
Reproducibility of Brain Network Metrics in People with Multiple Sclerosis1Radiological Sciences, University of Nottingham, Nottingham, United Kingdom, 2Clinical Neurology, University of Nottingham, Nottingham, United Kingdom
Synopsis
Knowledge of reproducibility of graph-theoretic brain network metrics in disease populations is critically important for applications in clinical studies but non-existent in published literature. We compared reproducibility of graph metrics over time in a cohort of MS patients to reported values in published studies of reproducibility in healthy volunteers. We found that reproducibility was good in MS patients but slightly lower than in healthy people. Reproducibility of graph-theoretic brain network metrics in MS patients is not greatly dissimilar to that in healthy populations, which supports their use in clinical studies.
Introduction
There has been a recent trend toward the application of the graph theoretic model to the analysis of MRI data in patient populations. It is critically important for clinical studies, and especially for clinical trials, that results drawn from graph analyses are reliable. However, while the reproducibility of graph-theoretic brain network metrics in healthy people is well-studied1, there is a paucity of information on reproducibility of graph metrics in disease. We aimed to test the reproducibility of these metrics over time in a cohort of MS patients and compare it to data reported in published studies of reproducibility in healthy people. The null hypothesis was that the reproducibility of metrics over time in MS patients would be equal to that in healthy people.Methods
Volunteers with MS made two visits separated by 4-6 weeks (during which they were clinically stable; this is also the period relevant for subchronic therapeutic interventions), each with an MRI scan at 3T including fMRI (TE=36ms, TR=2200ms, FA=80°, matrix 64x64x37, voxel size 3.75x3.75x3.6mm) and T1-weighted (TE=3ms, TR=7.9ms, TI=900ms, FA=8°, matrix 256x256x156, voxel size 1x1x1mm) sequences and cognitive assessment. In order to be comparable, our image analysis in MS patients followed the approach taken in most studies of reproducibility in healthy people1. We first tested our resting-state fMRI data for quality before and after preprocessing based on the frequency spectrum and even-odd difference image to identify any excessively noisy datasets. Data were then preprocessed in FSL FEAT with the following steps: high-pass filter at 0.01Hz, motion correction to the middle volume, registration to the MNI152 average brain. Spatial smoothing was not used to avoid introducing correlations between adjacent ROIs. 63 ROIs were defined by the Harvard-Oxford atlas and a timeseries extracted for each. Signals from eroded masks of CSF and white matter as well as 6 motion parameters were regressed from the timeseries. Adjacency matrices were constructed based on the functional connectivity (correlation) between every possible pair of ROIs. These matrices were thresholded at a range of densities (0.2 – 0.5) and the 3 most common graph metrics calculated1. Summary scores were the integral over the range of densities2. Reproducibility was quantified by the intra-class correlation coefficient (ICC; two-way random effects, single measures, consistency). We compared our findings to the reported values in healthy people based on a recent systematic review1. To identify factors contributing to reproducibility, we tested for correlations between the between-visit difference in graph metrics and extent of motion, followup time, age and disease severity.Results
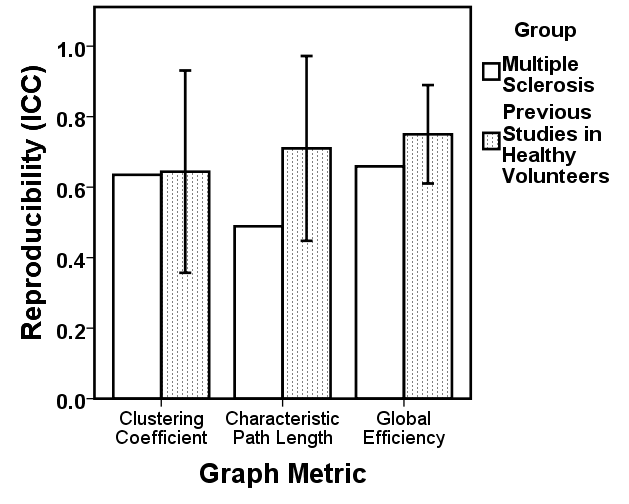
20 datasets were included from 10 people with MS (70% female, mean age 41±9 years, mean followup time 46.6±14.8 days). None were excluded. Reproducibility of graph metrics over time in people with MS was graded as “good” for clustering (ICC=0.635) and efficiency (ICC=0.659), and “fair” for characteristic path length (ICC=0.489), according to guidelines3. Compared to studies in healthy people (fig. 1), reproducibility of graph metrics in people with MS was only slightly lower (median ICC across 5 studies; clustering ICC=0.723, efficiency ICC=0.788, path length ICC=0.704). None of the between-visit differences in graph metrics were explained by differences in disease severity, motion, followup time or age.Conclusions
· Reproducibility of graph-theoretic brain network metrics in MS patients is not greatly dissimilar to that in healthy populations. This lends credence to their application in clinical studies and to the possibility that they may be useful in future as markers in clinical trials.
· Disease status may not be a large factor in reproducibility, despite the increased propensity for motion.
· More and larger studies are required to further establish the reproducibility of graph metrics in disease populations.
Acknowledgements
No acknowledgement found.References
1. Welton T, Kent D, Auer DP, Dineen RA. Reproducibility of brain network metrics: a systematic review. Brain Connectivity 2014; 5(4):193-202.
2. Hosseini SMH, Hoeft F, Kesler SR. GAT: A Graph-Theoretical Analysis Toolbox for Analyzing Between-Group Differences in Large-Scale Structural and Functional Brain Networks. PloS One 2012; 7(7):e40709.
3. Fleiss JL, Levin B, Paik MC. Statistical methods for rates and proportions, 2013; John Wiley & Sons.
Figures