4066
Using multi-inversion time ASL to explore gray matter perfusion in patients with multiple sclerosis: repeatability and relationship to disease characteristics1CUBRIC, Cardiff University, Cardiff, United Kingdom, 2IRCCS Fondazione Santa Lucia, Rome, Italy
Synopsis
The first aim of this study was to investigate retest-reliability of gray matter perfusion estimates in patients with multiple sclerosis. Using multi-inversion time pulsed ASL, we demonstrate good repeatability of global and local perfusion estimates over a four-week interval. The perfusion estimates were consistently lower in the patients than in a group of healthy controls. The second aim was to relate GM perfusion to disease characteristics. We could not find an effect of disease duration or stage (relapsing-remitting vs progressive) on perfusion, but we did observe a weak correlation with cognition, supporting previous studies.
Purpose
Hypo-perfusion in gray matter (GM) in multiple sclerosis (MS) has been demonstrated using various methods1-3. However, the spatial pattern of perfusion impairment and the reported relationship with disease characteristics are often inconsistent between studies. Here, we first test the retest-reliability of GM perfusion measures obtained through multi-TI pulsed ASL in MS patients and healthy controls. Then we relate perfusion to disease characteristics.Methods
75 right-handed MS patients4 and 26 healthy controls underwent a T1-weighted structural and a pulsed ASL scan (single subtraction PICORE QUIPSS II5 with 10 inversion times (300-2000ms), 16 tag-control pairs each for 300-700ms, and 8 tag-control pairs for 800-2000ms). A subgroup (25 patients and 19 controls) had a second scan four weeks later to assess reproducibility of perfusion, using intraclass correlation coeffients (ICC) and within subject coefficient of variation (CVwithin)6.
Perfusion was estimated using oxford_asl with partial volume correction7. Global perfusion was calculated within each participant's GM mask, obtained through FAST8 segmenting the structural image. Perfusion maps were registered to the structural scan (FLIRT9 with 6 dof) and then to MNI space (FLIRT with 12 dof), using registration matrices that were obtained by registering a non-perfusion weighted EPI image acquired in the same space. Perfusion values from various regions (WFU-PickAtlas 3.0.4) were obtained by calculating median perfusion in nonzero voxels.
Disease characteristics were assessed using the following clinical measures: disease duration, type of MS (relapsing-remitting vs progressive) and self-reported symptom severity using the MS Impact Scale (MSIS10). Cognition was assessed in patients and controls using the 3-second version of the Paced Auditory Addition Test (PASAT11) and the Symbol Digit Modalities Test (SDMT11).
Averages are presented as median±iqr. Group comparisons of perfusion values were performed with Mann-Whitney U tests, as implemented in Matlab’s (2015a) ranksum function. All correlations reported are Pearson correlation coefficients, using bivariate outlier exclusion12.
Results
Patients and controls did not differ in gender [patients: 42 women (56%); controls: 15 women (57%)], but controls were slightly younger (patients: 45±14 years, controls: 38±20 years; Z=1.9,p=.053). Whenever comparing perfusion between groups, age was regressed out of the perfusion values (across all participants) first.
The patient population was highly variable. Disease duration varied between 1 and 31 years (8±8), 55 patients had relapsing-remitting and 20 patients progressive MS; MSIS scores varied between 29 and 145 (51±45). Cognitive performance as measured by the PASAT (Z=-3.9,p<.0001) and the SDMT (Z=-4,p<.0001) was significantly lower in patients than controls.
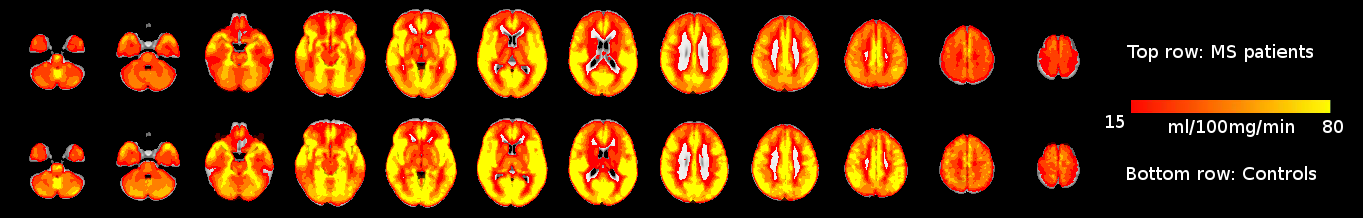
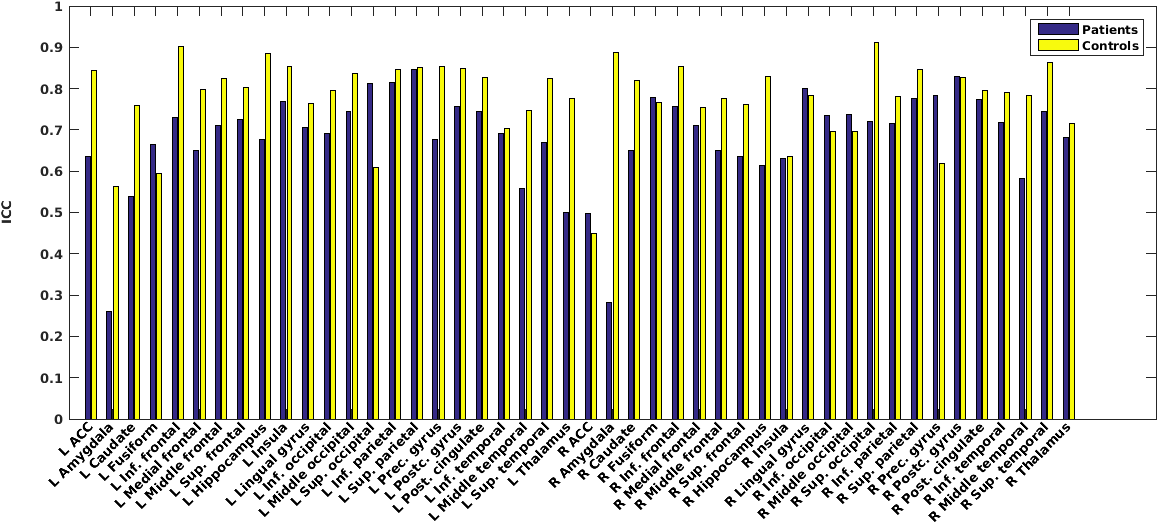
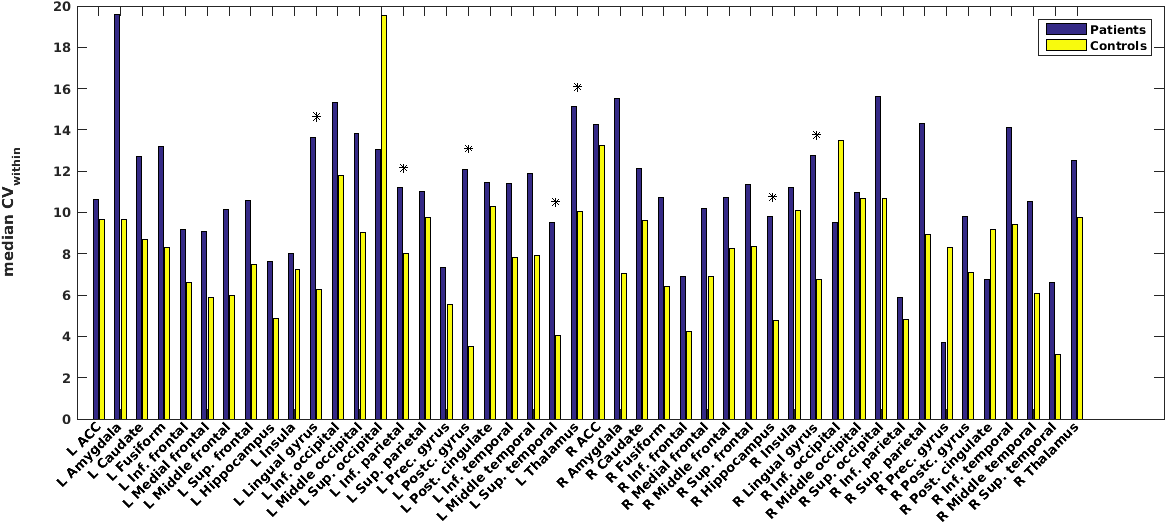
Average perfusion maps are shown in Figure 1. Global perfusion had good repeatability (patients: ICC=.72,p<.0001, controls: ICC=.79,p<.0001) and local perfusion estimates were repeatable in most, but not all regions, with ICCs ranging from .07 to .93 and average CVwithin ranging from 3.1 to 19.6 (Figures 2 and 3). In a number of regions, e.g. in the lingual gyrus, repeatability in patients as measured by CVwithin was lower than in controls.
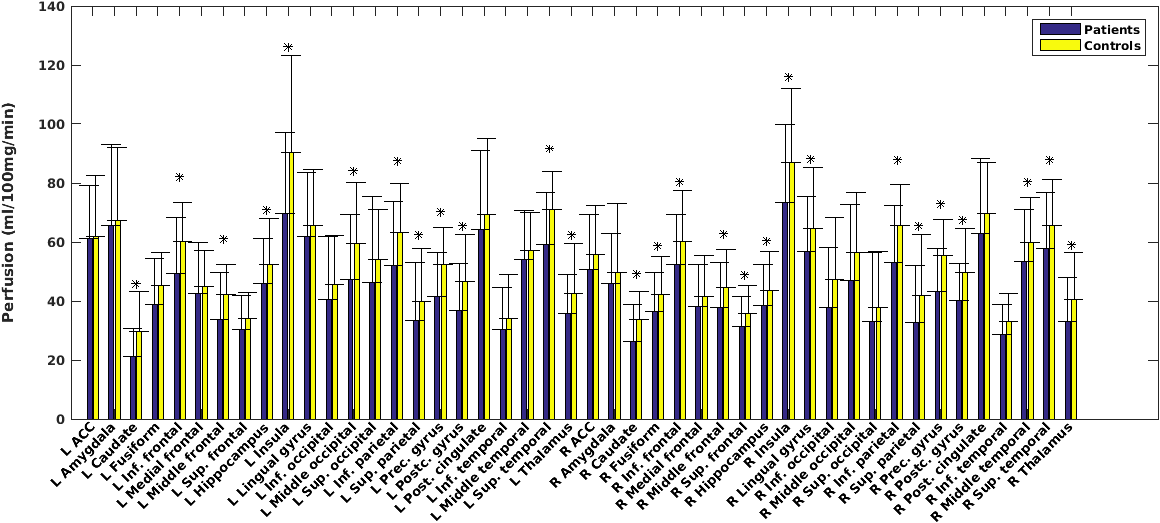
Partial volume corrected global perfusion was significantly lower in patients (56±18 ml/100g/min) than in controls (68±16 ml/100g/min; Z=2.6,p=.009). Local perfusion estimates showed that GM hypo-perfusion was widespread over the brain, including cortical as well as sub-cortical structures (Figure 4).
Global perfusion was not correlated with age (r=-.06,p=.62), disease duration (r=-.11,p=.33), self-reported symptom severity (r=.05,p=.65), or PASAT score (r=.09,p=.45), or type of MS (Z=-1,p=.30). There was a trend for a positive correlation between SDMT scores and perfusion (r=.23,p=.06). Women with MS had higher perfusion than men (Z=3.3,p=.001).
Discussion
Previous studies show good repeatability for PASL measures in GM for healthy volunteers13-14. We demonstrate that this is also the case for measures obtained in MS patients over a 4 week interval. In both, patients and controls, repeatability varied across brain regions, suggesting that either measurement error or temporal stability of perfusion is not consistent across the brain. In some regions, repeatability was lower in patients than in controls, suggesting that disease processes might affect perfusion estimates during the retest interval.
We found widespread hypo-perfusion for MS patients. However, despite a variable patient sample, we could not demonstrate a relationship between global perfusion and symptom severity or type of MS. We did, however, report a trend for a correlation with cognition, when measured with the SDMT. This is in line with previous studies demonstrating that hypo-perfusion is predominantly present in cognitively impaired MS patients15-18.
Conclusions
Our results demonstrate that it is possible to reliably measure cortical and sub-cortical GM hypo-perfusion in MS patients. The correlations between GM perfusion and disease characteristics suggest that hypo-perfusion may be a disease process prevalent in all stages and severities of MS, i.e., a disease trait, that is more prominent for cognitively impaired patients.Acknowledgements
No acknowledgement found.References
1. Debernard, L, Melzer, TR, Van Stockum, S, et al. Reduced grey matter perfusion without volume loss in early relapsing-remitting multiple sclerosis. J Neurol Neurosurg Psychiatry. 2014;85:544-551.
2. Inglese, M, Park, S, Johnson, G, et al. Deep gray matter perfusion in multiple sclerosis. Arch Neurol. 2007;64:196-202.
3. Rashid, W, Parkes, LM, Ingle, GT, et al. Abnormalities of cerebral perfusion in multiple sclerosis. J Neurol Neurosurg Psychiatry. 2004;75: 1288-1293.
4. Polman, CH, Reingold, SC, Banwell, B, et al. Diagnostic criteria for multiple sclerosis: 2010 revisions to the McDonald criteria. Ann Neurol. 2011;69(2): 292-302.
5. Wong EC, Buxton RB, Frank LR. Quantitative imaging of perfusion using a single subtraction (QUIPSS and QUIPSS II). Magn Reson Med. 1998;39(5):702–8.
6. Lipp, I, Murphy, K, Caseras, X, et al. Agreement and repeatability of vascular reactivity estimates based on a breath-hold task and a resting state scan. NeuroImage. 2015;133:387-396.
7. Chappell, MA, Groves, AR, MacIntosh, BJ, et al. Partial volume correction of multiple inversion time arterial spin labeling MRI data. Magnetic Resonance in Medicine. 2011;65:1173-1183.
8. Zhang, Y, Brady, M, Smith, S. Segmentation of brain MR images through a hidden Markov random field model and the expectation-maximization algorithm. IEEE Trans Med Imag. 2011;20(1):45-57.
9. Jenkinson, M, Bannister, PR, Brady, JM, et al. Improved optimisation for the robust and accurate linear registration and motion correction of brain images. NeuroImage. 2002;17(2):825-841.
10. Hobart, J, Lamping, D, Fitzpatrick, et al. The Multiple Sclerosis Impact Scale (MSIS-29): A new patient-based outcome measure. Brain. 2001;124:962-973.
11. Rao, SM. A manual for the brief, repeatable battery of neuropsychological tests in multiple sclerosis. New York: National Multiple Sclerosis Society. 1990.
12. Pernet, CR, Wilcox, R, Rousselet, GA. Robust correlation analyses: false positive and power validation using a new open source Matlab toolbox. Frontiers in Psychology. 2012; 3:606.
13. Chen, Y, Wang, DJ, Detre, J. Test–retest reliability of arterial spin labeling with common labeling strategies. Journal of Magnetic Resonance Imaging. 2011;33:940-919.
14. Jahng, G, Song, E, Zhu, X, et al. Human Brain: Reliability and reproducibility of pulsed arterial spin-labeling perfusion MR imaging. Radiology. 2005;234:909-916.
15. Debernard, L, Melzer, TR, Alla, S, et al. Deep grey matter MRI abnormalities and cognitive function in relapsing-remitting multiple sclerosis. Psychiatry Research: Neuroimaging. 2015;234(3): 352–361.
16. Hojjat, S, Cantrell, CG, Carroll, TJ, et al. Perfusion reduction in the absence of structural differences in cognitively impaired versus unimpaired RRMS patients. Multiple Sclerosis Journal. 2016.
17. Inglese, M, Adhya, S, Johnson, G, et al. Perfusion magnetic resonance imaging correlates of neuropsychological impairment in multiple sclerosis. J Cereb Blood Flow Metab. 2008; 28(1):164-171.
18. Vitorino, R, Hojjat, S, Cantrell, CG, et al. Regional frontal perfusion deficits in relapsing-remitting multiple sclerosis with cognitive decline. Am J Neuroradiol. 2016.
Figures