4063
Monitoring Disease Progression in Experimental Autoimmune Encephalitis using VDMP-CEST MRI1Johns Hopkins School of Medicine, Baltimore, MD, United States, 2Kennedy Krieger, 3Johns Hopkins School of Medicine
Synopsis
VDMP-CEST MRI can spatiotemporally monitor disease progression in a mouse model of multiple sclerosis. Lower VDMP-CEST signals corresponded to a decreased lipid and metabolite content in the peri-ventricular region of the brain, characteristic of the disease, with magnetic resonance spectroscopy used as validation.
Purpose
Multiple sclerosis (MS) is an autoimmune disease characterized by a loss of myelin1 and the alteration of metabolite content in the central nervous system2, which results in progressive paralysis. We evaluated the ability of on-resonance variable-delay multi-pulse chemical exchange saturation transfer (VDMP-CEST) MRI3, that distinguishes fast exchanging protons in neuronal tissue, to monitor the progression and severity of disease in a mouse model of MSMethods
Experimental autoimmune encephalomyelitis (EAE) was induced in C57Bl/6 mice (n=4) by i.p. injection of 250 ng of pertussis toxin and s.c. injection of 300 μg of MOG35-55 in complete Freud’s adjuvant supplemented with 4 mg/ml tuberculin on day 0 and day 2. Naïve mice (n=4) did not receive these injections. Mice were monitored daily and assessed for paralysis using the following clinical scoring system: 0=healthy, 1=tail paralysis, 2=mild hindlimb paralysis, 3=total hindlimb paralysis, 4=forelimb paralysis, and 5=moribund/death.
Mice were imaged biweekly with T2-weighted and VDMP CEST MRI using a horizontal bore 11.7T scanner (Biospec, Bruker). For transmission, a 72 mm volume resonator was used. For MRI acquisition, 2x2 and 4x1 phased array coils were used for the brain and spinal cord, respectively. For T2-weighted images, a TE=30 ms, TR=2.5 s, RARE factor = 8, NA=4, and a slice thickness=0.7 mm was used. For VDMP-CEST MRI, 32 pulse-exchange modules with a 2 ms pulse width, a B1 = 46.8 μT, ,ten delays (0 to 150 ms), and a slice thickness=2.0 mm were used. Significance was defined at p<0.05 using ANOVA.
Results
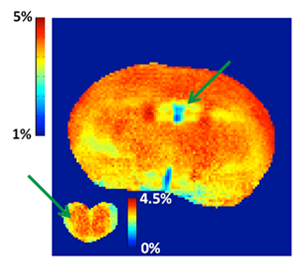
Regional differences in VDMP-CEST signal were seen in the brain and spinal cord of EAE-induced mice. In brain frontal cortex, the lateral ventricular region exhibited lower VDMP-CEST signal than the parenchyma-rich region (Figure 1). In the lumbar spinal cord, the white matter region also had a lower VDMP-CEST signal compared to grey matter region (not shown).
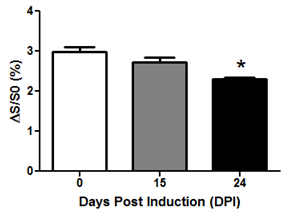
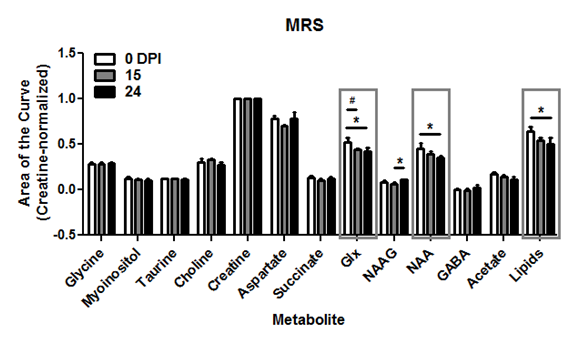
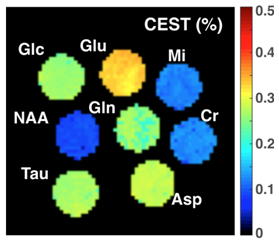
Temporal changes in VDMP-CEST signal were seen in the peri-ventricular region of the brain in EAE-induced mice (Figure 2). VDMP-CEST signal was lower in this region during the acute phase (day 24 post-induction) compared to that observed at disease onset (day 15 post-induction) or before induction (day 0). Reduction of VDMP-CEST signal in the peri-ventricular region corresponded to a reduced presence of glutamine/glutamate (Glx), N-acetyl aspartate (NAA), and free lipids in magnetic resonance spectroscopy (MRS, Figure 3), in agreement with the metabolic changes revealed using mass spectroscopy3. Phantom images of brain metabolites at 20 mM concentration revealed that glutamine/glutamate is a major contributor of the VDMP-CEST signal (Figure 4).
Conclusion
The progression of MS is characterized by an autoimmune response that results in the damage of myelin and the release of glutamate1, ultimately reducing the presence of this metabolite. We found that changes in the VDMP-CEST signal can be used to spatiotemporally monitor the progression of EAE, with the lower VDMP-CEST signal in the periventricular region of EAE-induced mice at least partially resulting from lowered glutamate levelsAcknowledgements
This work was funded by the NMSS RG 4494-A-3.References
1. Calabrese M et al, Exploring the origins of grey matter damage in multiple sclerosis, Nat Rev Neurosci. 2015 Mar;16(3):147-58.
2. Xu J et al,
Variable delay multi-pulse train for fast chemical exchange saturation
transfer and relayed-nuclear overhauser enhancement MRI, Magn Reson Med.
2014 May;71(5):1798-812.
3. Noga MJ et al, Metabolomics of cerebrospinal fluid reveals changes in the central nervous system metabolism in a rat model of multiple sclerosis. Metabolomics. 2012 Apr;8(2):253-263
Figures