4062
Longitudinal outer and inner cortical MTR abnormalities in different MS clinical phenotypes1UCL Institute of Neurology, Queen Square MS Centre, University College London, London, United Kingdom, 2Translational Imaging Group, Centre for Medical Image Computing, Department of Medical Physics and Biomedical Engineering, University College London, London, United Kingdom, 3Dementia Research Centre, Department of Neurodegenerative Diseases, UCL Institute of Neurology, University College London, London, United Kingdom, 4Division of Neuroscience and Experimental Psychology, University of Manchester, Manchester, United Kingdom, 5Department of Neurology, Nottingham University Hospitals, Nottingham, United Kingdom, 6Department of Neurology, University Hospital Basel, Basel, Switzerland, 7National Institute for Health Research (NIHR) University College London Hospitals Biomedical Research Centre, United Kingdom, 8Department of Brain and Behavioural Sciences, University of Pavia, Pavia, Italy, 9Brain MRI 3T Center, C. Mondino National Neurological Institute, Pavia, Italy
Synopsis
Outer cortical magnetisation transfer ratio (cMTR) is potentially a sensitive measure of pathology linked to clinical disease progression in multiple sclerosis (MS). Here we aimed to investigate longitudinal outer and inner cMTR changes in healthy controls (HC) and people with MS of different clinical subtypes. Follow-up (FU) outer cMTR showed larger reductions in secondary progressive (SP)MS than other subtypes, and inner cMTR was also reduced more than in HC and relapsing-remitting (RR)MS, although cMTR was reduced in all MS patients at FU. This supports histopathological findings and suggests that cMTR measurement may be relevant to clinical disease progression in MS.
Purpose
Cortical grey matter (CGM) pathology is common in multiple sclerosis (MS)1-3. Histopathological studies have shown that demyelinating lesions preferentially form in the outer (subpial) CGM4-5. In some people with secondary progressive (SP)MS neuroaxonal loss is also greater adjacent to the outer surface of the brain, and it has also been suggested that these abnormalities may be associated with meningeal inflammation6. Recent in vivo studies have measured the MTR, thought to be sensitive to tissue myelin content7,8, to investigate abnormalities at different depths in the cortex in healthy controls (HC) and MS9,10. Greater disease effects were observed in outer than inner cortical MTR (cMTR) in people with relapsing-remitting (RR) and SPMS9. We have investigated outer and inner cMTR in different MS clinical subtypes and HC longitudinally, with follow-up (FU) MRI scans performed approximately 2 years after the baseline (BL) scan.Methods
Subjects: Ten HC and 51 people with MS were included in this study. Subject demographics are given in Figure 1.
MR acquisition: A 3T Philips Achieva system (Philips Healthcare, Best, The Netherlands) with a 32-channel head coil and multi-transmit technology was used for scanning. T1-weighted (T1-w) volumes and MTR data were acquired sagittally, with field-of-view 256x256x180mm3; voxel size1x1x1mm3. Acquisition parameters are given in Figure 2.
Image Analysis: Each subject’s lesion-filled11 T1-w volume was segmented using the Geodesic Informational Flows algorithm12. The normalised central curve of the Laplace equation based cortical thickness map was used to bisect the cortex9,13,14, taking into account local curvature and different regional thicknesses. MTR data were affine registered to each subject’s T1-w volume using NiftyReg15,16, and a 90% threshold was applied to CGM probability maps to limit potential partial volume effects9. Inner and outer cortical masks were applied to calculated MTR maps to obtain mean cortical band MTR values. These processes are illustrated in Figure 3.
Statistical analysis: All statistical analyses were performed using SPSS (IBM SPSS version 22 (SPSS, Inc., Chicago, IL, USA)). Between-group differences in FU MTR values were tested using one-way analysis of covariance (ANCOVA) tests, adjusted for age, gender, Δt, BL MTR and BL cortical volume. Comparisons between BL and FU MTR for each subgroup were also made using paired t-tests. Between-group differences at both BL and FU in inner and outer mean cMTR were examined using ANCOVA tests, adjusted for age, gender and cortical volumes.
Results
Examining FU cMTR (adjusting for age, gender, Δt, BL cMTR and BL cortical volume) we found that SPMS outer cMTR was lower than in HC (p<0.01), primary progressive (PP)MS (p<0.01) and RRMS (p<0.05), and inner cMTR was lower than in HC and RRMS (p<0.05) but not PPMS. No other significant differences between subgroups were seen. Adjusting for relative cortical volume change confirmed these results were not due to atrophy alone.
Comparing subgroup BL to FU: In all patients, outer (p<0.01) and inner cMTR (p=0.001) were reduced at FU. In SPMS, FU outer (p<0.05) and inner (p=0.001) cMTR were reduced. In PPMS, FU outer cMTR (p<0.05) was lower than at BL, but no significant changes were observed in RRMS. As expected, no significant differences were observed between BL and FU cMTR values in HC.
At BL and FU, the SPMS group had significantly lower outer (p<0.001) and inner (p<0.01) cMTR compared to HC, primary progressive (PP) MS and RRMS patients had a reduced outer cMTR (p<0.05), and cMTR was reduced in PPMS (p<0.05) but not RRMS (values reported in Figure 4).
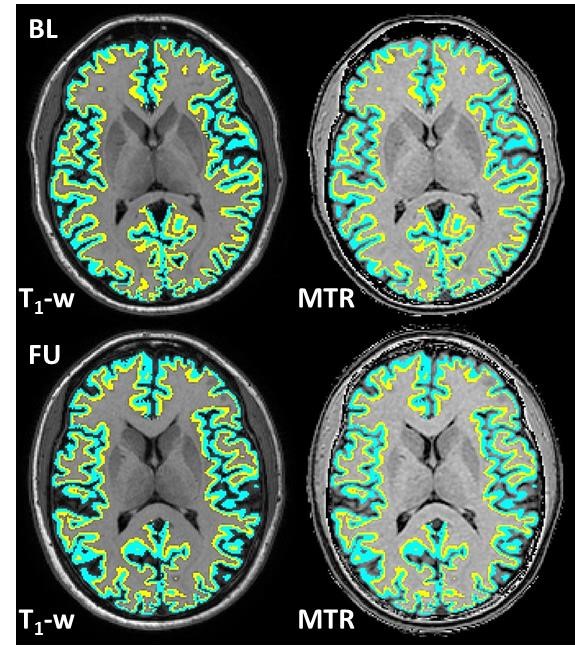
Example HC single slice T1-w images and corresponding MTR maps with inner and outer cortical bands superimposed at BL and FU are shown in Figure 5.
Discussion and Conclusions
The larger cMTR changes observed in SPMS compared to other subgroups is consistent with histopathology studies, and previous MTR findings in vivo9.
Reductions in outer cMTR in all patient groups at both points supports previous work9 and is consistent with histopathological findings1-5, and supports the inference of a potential role of meningeal inflammation6 contributing to outer cortical pathology.
There was a trend in MTR reduction at FU compared to BL inner and outer cMTR in all subgroups, however significance was only reached for SPMS outer and inner, and PPMS outer cMTR, and interestingly larger inner cMTR changes were observed in SPMS than in outer cMTR. This may suggest that later in the disease course pathology is spreading inwards from the outer cortex, and the changes observed could be relevant to disease progression.
Future studies including larger cohorts of all clinical subtypes would be desirable, and further longitudinal observations are necessary to determine the dynamics and clinical significance of cMTR abnormalities.
Acknowledgements
The authors would like to thank the UK MS Society, the EPSRC and the Department of Health’s NIHR Biomedical Research Centres funding scheme (NIHR BRC UCLH/UCL High Impact Initiative-BW.mn.BRC10269) for funding. We would also like to thank all the participants of the study.References
[1] Luchinetti CF et al. NEJM. 2011; 365(23):2188-97; [2] Peterson JW et al. Ann Neur. 2001; 50(3):389-400; [3] Bo L et al. J Neuropath Exp Neurol. 2003; 62(7):723-32; [4] Kutzelnigg A et al. Brain. 2005; 128(11):2705-12; [5] Wegner C et al. Neurology. 2006;67(6):960-7; [6] Magliozzi et al. Ann Neurol. 2010 Oct;68(4):477-93; [7] Schmierer K et al. Ann Neurol. 2004;56(3):407-15; [8] Schmierer K et al. J Magn Reson Imaging. 2007; 26(1):41-51) ; [9] Samson RS et al. MSJ 2014; 20(10):1322-30; [10] Rudko, D et al. NI Clinical, in press, accepted October 2016; [11] Prados F et al. Lect Notes in Comp Sci 2014. 8674:781-788;) [12] Cardoso, MJ et al. IEEE Transactions on Medical Imaging 2015; 34:1976–88; [13] Yezzi A, Prince JL. Comp Vis; 2002. p. 575-89; [14] Cardoso MJ et al. IPMI, 2011. p. 159-70; [15] Modat M et al. Comp Methods Prog Biomed. 2010; 98: 278-84; [16] Ourselin S et al. Image & Vis Comp. 2001; 19: 25-31.Figures
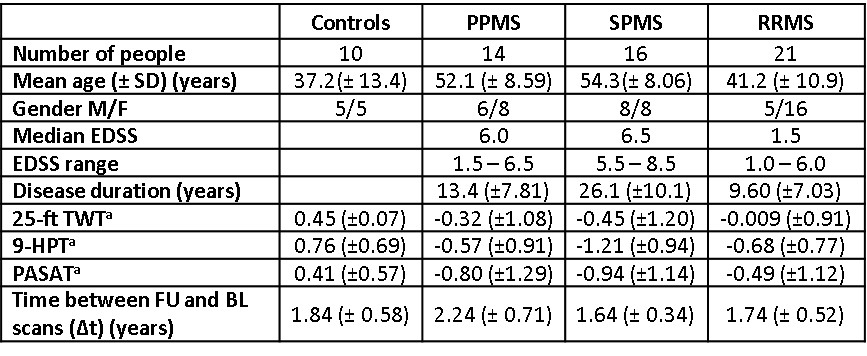
Figure 1: Subject Demographics
aComponents of the MS Functional Composite (MSFC) (nine hole peg test [9HPT], 25 foot timed walk test [TWT] and Paced Auditory Serial Addition Test [PASAT], expressed as z-scores (Fischer JS et al. Mult Scler. 1999; 5(4):244-50) were determined, calculated using published normative data.
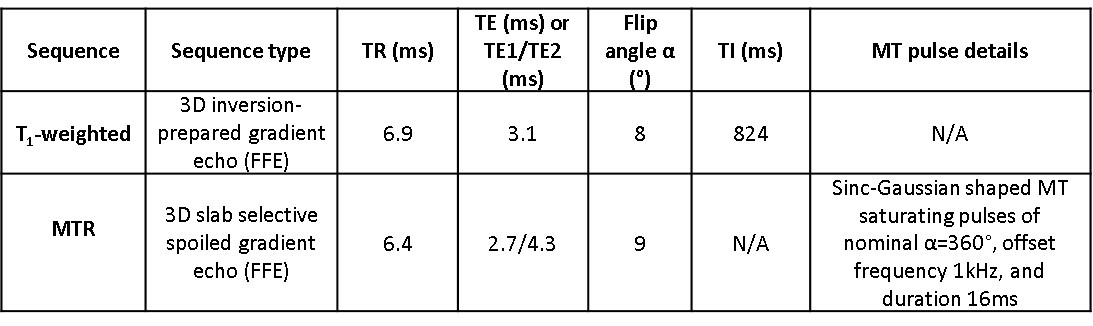
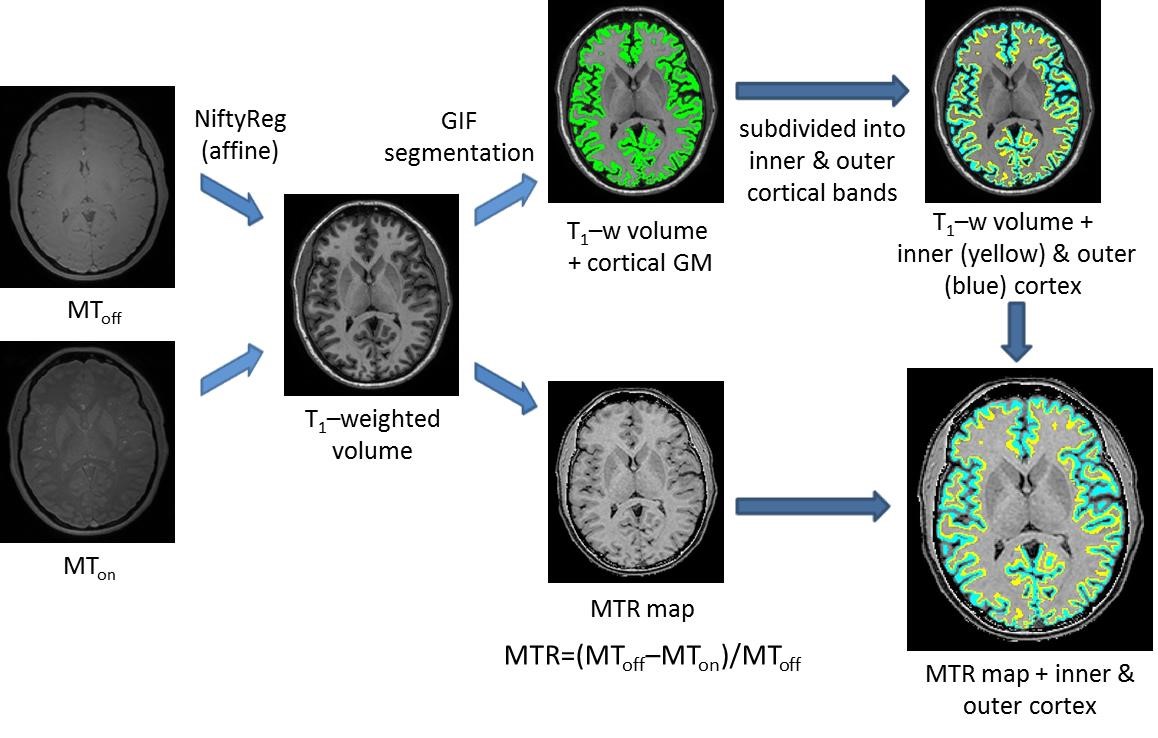
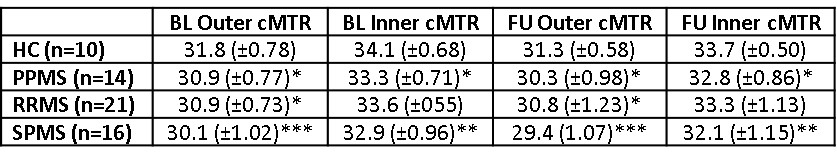
Figure 4: Inner and outer cMTR values for all subgroups, at both BL and FU
*p<0.05, **p<0.01, ***p<0.001 compared to controls (at each respective time point), with age, gender and cortical volume included as covariates (ANCOVA)