4061
THE EVOLUTION OF CORTICAL AND SUB-CORTICAL LESION SIZE AND NUMBER CORRELATES WITH CHANGES IN COGNITION IN EARLY-STAGE RELAPSING-REMITTING MULTIPLE SCLEROSIS PATIENTS1Department of Radiology, Valais Hospital, Sion, Switzerland, 2Advanced Clinical Imaging Technology, Siemens Healthcare AG, Lausanne, Switzerland, 3Department of Radiology, Centre Hospitalier Universitaire Vaudois (CHUV) and University of Lausanne (UNIL), Lausanne, Switzerland, 4Signal Processing Laboratory (LTS 5), Ecole Polytechnique Fédérale de Lausanne (EPFL), Lausanne, Switzerland, 5Martinos Center for Biomedical Imaging, Massachusetts General Hospital and Harvard Medical School, Boston, MA, United States, 6Department of Clinical Neurosciences, Centre Hospitalier Universitaire Vaudois (CHUV) and University of Lausanne (UNIL), Lausanne, Switzerland, 7Siemens Medical Solutions USA, Boston, MA, United States, 8Medical Image Analysis Laboratory (MIAL), Centre d'Imagerie BioMédicale (CIBM), Lausanne, Switzerland
Synopsis
Lesion load and activity in multiple sclerosis (MS) patients, as identified by conventional magnetic resonance imaging (MRI), correlate only moderately with patients clinical status and evolution. Cortical lesion number and volume measured with advanced MRI may provide better correlates to cognitive dysfunction and disability. In this work, we studied the clinical impact of advanced MRI metrics of cortical and subcortical lesion evolution in a cohort of early relapsing-remitting MS patients. The number and volume of lesions that “shrunk”, disappeared or remained stable over time were strong determinants of changes in cognition in our patients cohort.
Introduction
Lesion load and activity, as identified by conventional magnetic resonance imaging (MRI), provide important biomarkers of central nervous system pathology in multiple sclerosis (MS). However, these biomarkers correlate only moderately with patients clinical status and disease evolution1,2. Advanced MRI acquisitions may provide additional imaging biomarkers - such as cortical lesion load - which better relate to cognitive dysfunction and disability in MS patients3-5. However, a systematic assessment of the clinical impact of changes in cortical and white matter lesions over time has not been performed to date. In this work, we studied the influence of advanced MRI metrics of lesion evolution on cognition, motor function and disability in a cohort of early relapsing-remitting MS (RRMS) patients.Methods
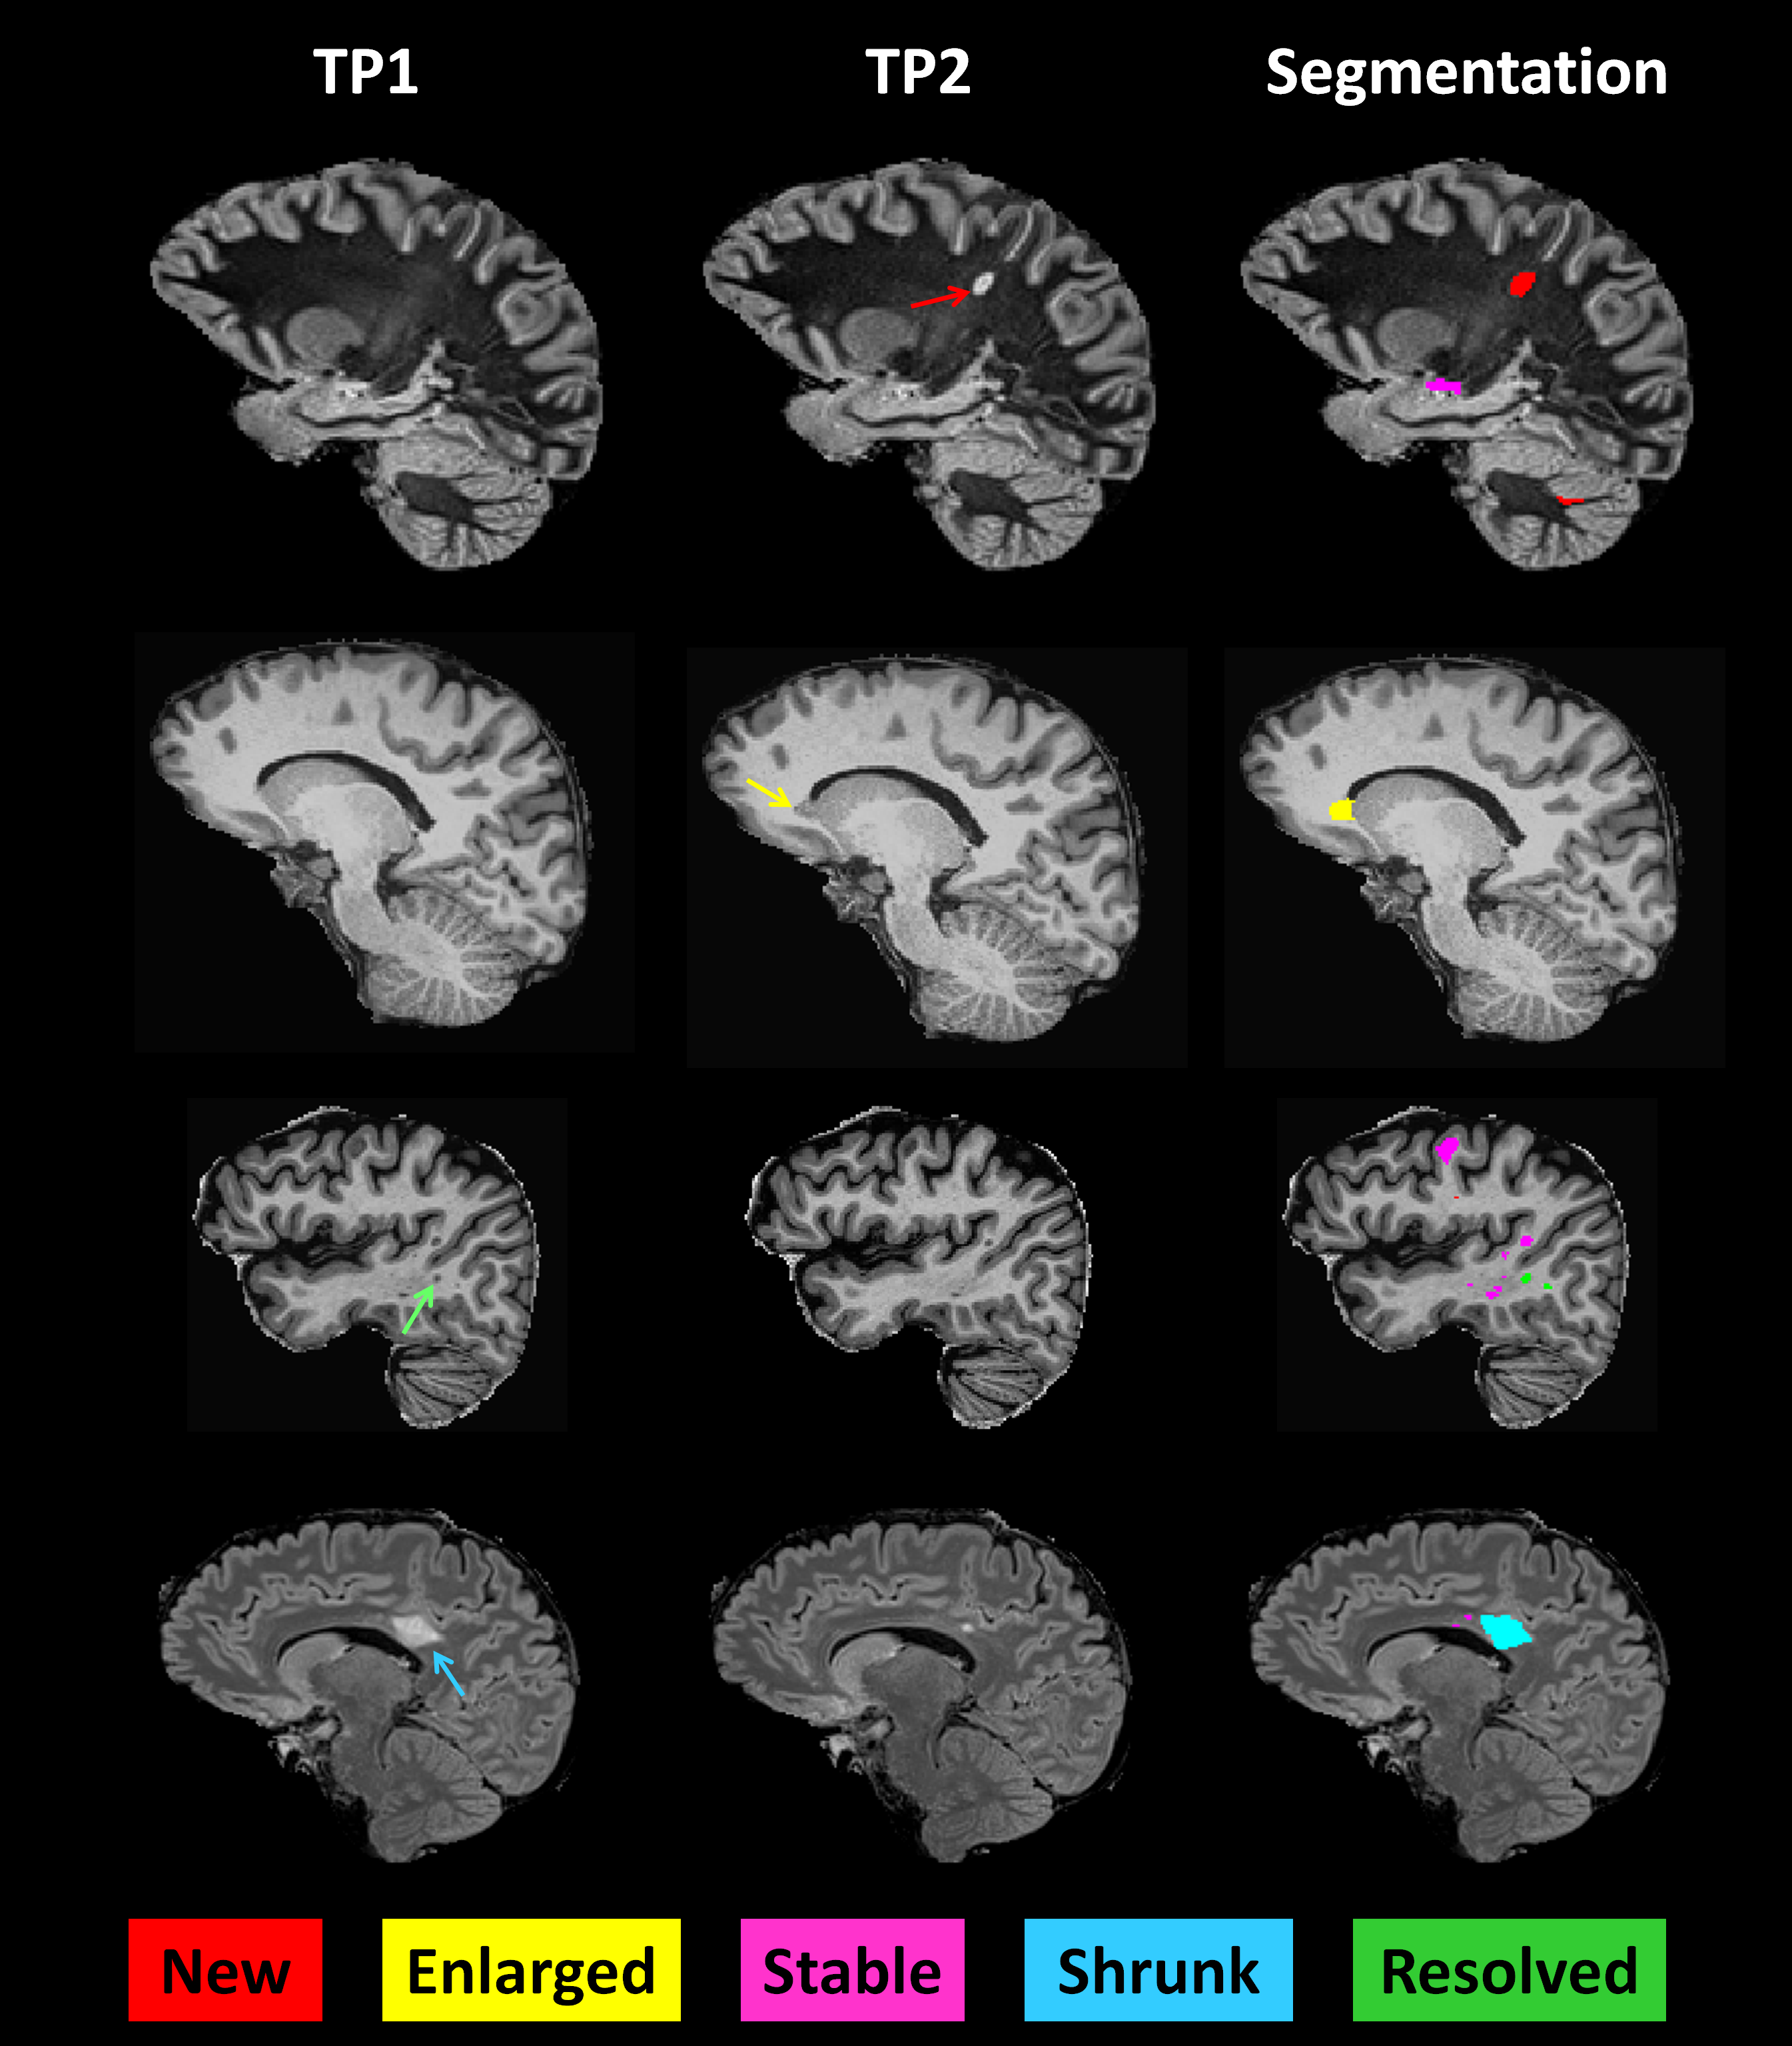
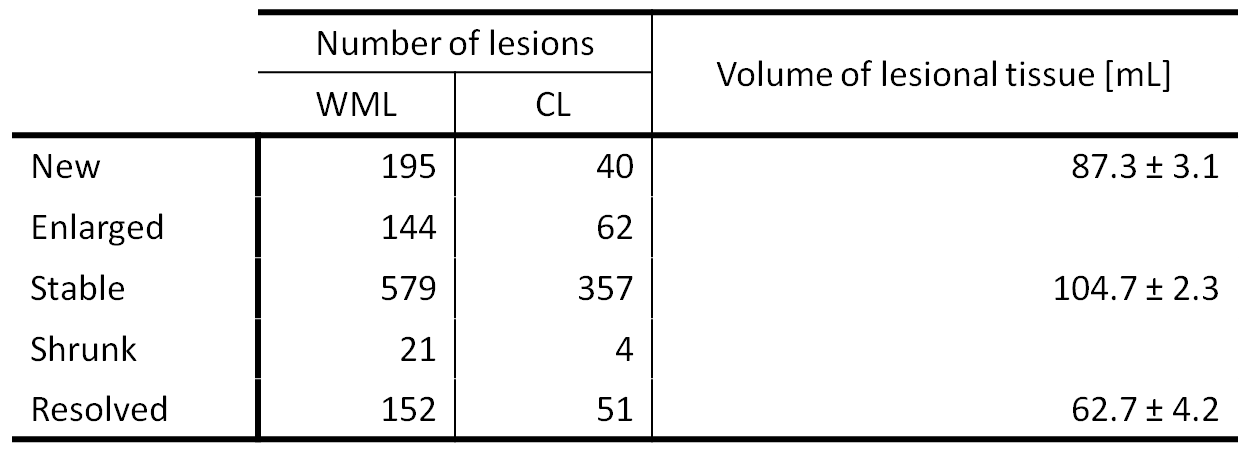
Thirty-two early RRMS patients with < 5 years disease duration were enrolled in the study (tp1) and followed up two years later (tp2). The cohort consisted of 13 males and 19 females, age range 20-60 years at tp1, who had a median Expanded Disability Status Scale (EDSS) of 1.5 (range: 1-3) at both time points; 88 % of patients were on therapy at tp1 and 94% at tp2. At both time-points, each subject underwent advanced MRI and a clinical examination including: (i) EDSS; (ii) Multiple Sclerosis Functional Composite score; (iii) Brief Repeatable Battery of Neuropsychological Tests; (iv) Hospital Anxiety and Depression scale; (v) Fatigue Scale for Motor and Cognitive functions. Images were acquired on a 3T scanner (MAGNETOM Trio a Tim system, Siemens, Erlangen, Germany) using a 32-channel head coil, and the protocol included: magnetization-prepared rapid acquisition gradient echo (MPRAGE, TR/TI=2300/900 ms, voxel size (vs)=1.0x1.0x1.2mm3, acquisition time, AT:~5min); magnetization-prepared 2 rapid acquisitions gradient echo (MP2RAGE, TR/TI1/TI2=5000/700/2500ms, vs=1.0x1.0x1.2 mm3, AT:~8min ); 3D fluid-attenuated inversion recovery (FLAIR, TR/TE/TI=5000/394/1800ms, vs=1.0x1.0x1.2mm3, AT:~6min); and 3D double inversion recovery (DIR, TR/TE/TI1/TI2=10000/218/450/3650ms, vs=1.0x1.0x1.2mm3, AT: ~12min). Manual segmentation of MS lesions was performed by a neurologist and a radiologist by consensus on MP2RAGE, FLAIR and DIR images separately. MS lesions were classified in 5 groups as proposed in6:
- New: identifiable on the tp2 images but not on the tp1 images;
- Enlarged: characterized by a diameter increased at tp2 by at least 50%;
- Resolved: clearly visible on the tp1 images but not on the tp2 images;
- Shrunken: characterized by a diameter decrease at tp2 by at least 50%;
- Stable: do not follow any of the above criteria.
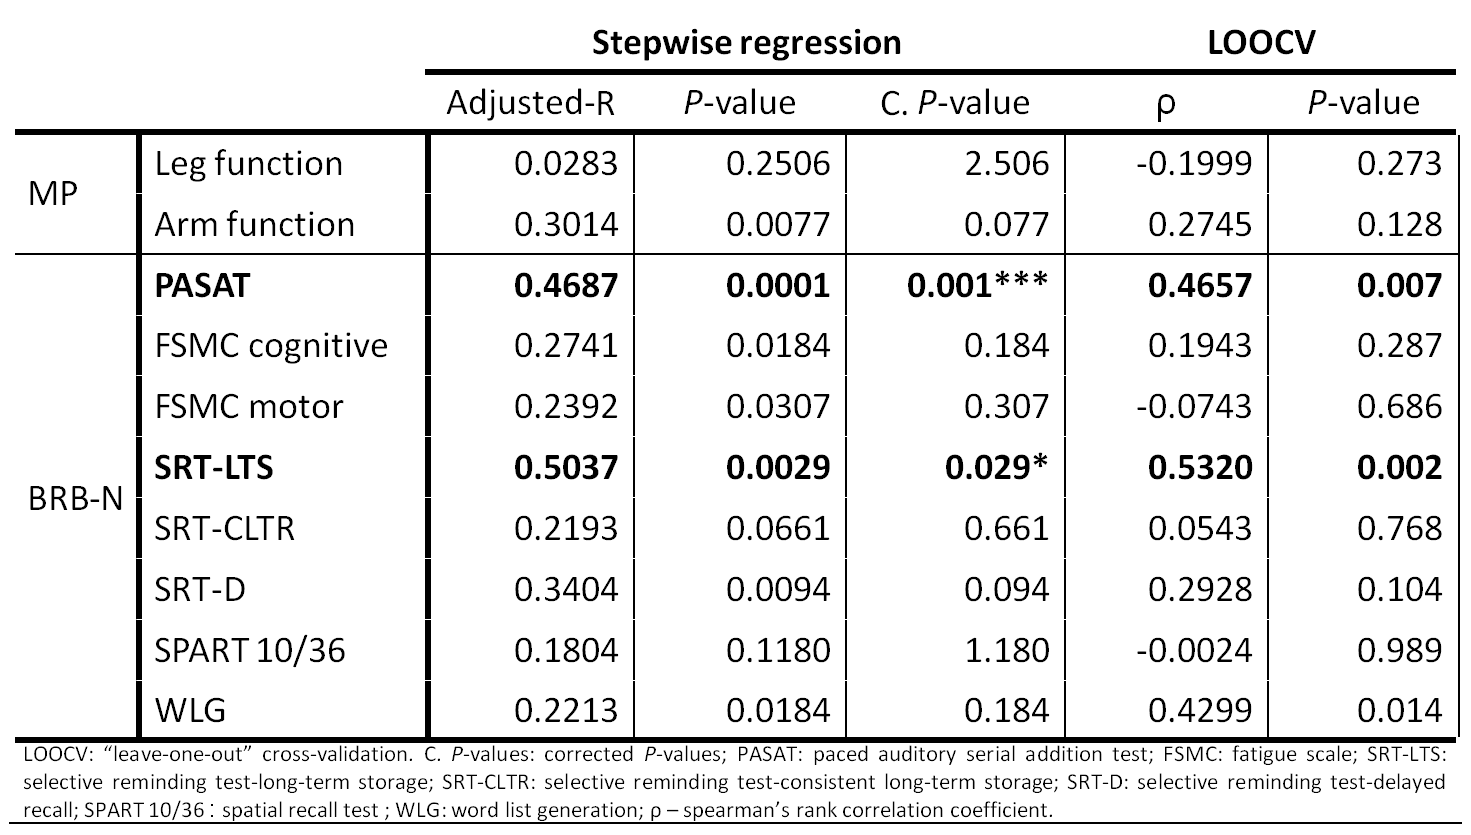
A generalized linear model was performed using the number and volume of new, enlarged, resolved, shrunken, stable lesions as predictors and the difference in each clinical score between time-points as outcome. Age, gender, number of education years, anxiety, and depression scores were considered as covariates. Backward-stepwise analyses were performed to select the best prediction model for each clinical score. Bonferroni correction was applied for multiple comparisons. A leave-one-out cross-validation (LOOCV) was conducted to assess the prediction quality of each model.
Results
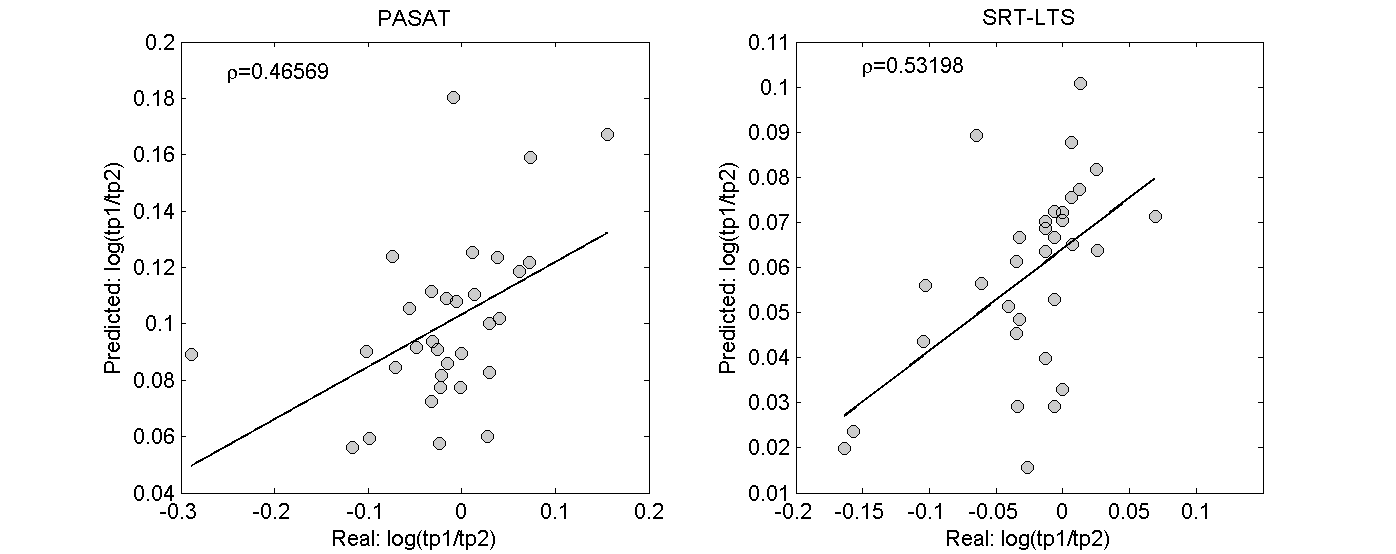
The longitudinal changes in cortical and WM lesions size as well as the appearance of new lesions strongly influenced changes in (i) sustained attention, auditory information processing speed and flexibility (PASAT, adjusted-R2: 0.5, corrected P<.001 and ρ=0.47 after LOOCV) and in (ii) spatial memory (SRT-LTS, adjusted-R2: 0.5, corrected P< .001 and ρ=0.53 after LOOCV, see Figure 3 and Figure 4). Specifically, changes in PASAT score were strongly influenced by the patients’ age and number of lesions that shrunk in size (P<.001). Changes in SRT-LTS were mainly determined by the number and volume of shrunk (P<.01), resolved (P<.05) as well as stable lesions (P<.05 and P<.01, respectively).Discussion
We assessed the clinical impact of changes in cortical and WM lesions in early RRMS patients on stable therapy. In this cohort of patients, the number and volume of lesions that shrunk, disappeared or remained stable over time appeared to be strong determinants of changes in sustained attention, auditory information, processing speed and flexibility as well as spatial memory. Changes in cortical and WM lesions may be evaluated in a clinically compatible protocol at 3T (AT < 30 min) and provide biomarkers of disease evolution already in early MS stages. We are currently working on an automated tool to identify new, resolved, shrunk and stable lesions in order to confirm and extend our findings in larger cohorts and across MS centers7,8.Acknowledgements
No acknowledgement found.References
1. Filippi M, Rocca M, Benedict R, et al., The contribution of MRI in assessing cognitive impairment in multiple sclerosis. Neurology 2010; 75:2121–2128.
2. Sormani MP, Bonzano L, Roccatagliata L, Mancardi GL, Uccelli A, Bruzzi P, Surrogate endpoints for EDSS worsening in multiple sclerosis. A meta-analytic approach, Neurology. 2010 Jul 27; 75(4):302-9.
3. Calabrese M, Rocca MA, Atzori M, Mattisi I, Favaretto A, Perini P, Gallo P, Filippi M., A 3-year magnetic resonance imaging study of cortical lesions in relapse-onset multiple sclerosis, Ann Neurol. 2010 mar; 67(3):376-83.
4. Daniel M. Harrison, Snehashis Roy, Jiwon Oh, et al., Association of Cortical Lesion Burden on 7-T Magnetic Resonance Imaging with Cognition and Disability in Multiple Sclerosis, JAMA Neurol. 2015;72(9):1004-1012.
5. Scott Nielsen, Revere P. Kinkel, Nancy Madigan, Emanuele Tinelli, Thomas Benner and Caterina Mainero, Contribution of cortical lesion subtypes at 7T MRI to physical and cognitive performance in MS, Neurology. 2013 Aug 13; 81(7): 641–649.
6. Moraal B., et al., Improved Detection of Active Multiple Sclerosis Lesions: 3D Subtraction Imaging 1. Radiology. 2010 April;255(1):154-63.
7. Fartaria, M. J., et al., Longitudinal automated detection of white-matter and cortical lesions in relapsing-remitting multiple sclerosis. ISMRM 2016.
8. Fartaria, M. J., et al., Longitudinal segmentation of Early-stage Multiple Sclerosis Lesions in Magnetic Resonance Images. OHBM 2016.
Figures