4060
Graph theoretical measures predict volumetric changes in multiple sclerosis1UCL Institute of Neurology, Queen Square MS Centre, University College London, London, United Kingdom, 2Translational Imaging Group, Centre for Medical Image Computing, Department of Medical Physics and Biomedical Engineering, University College London, London, United Kingdom, 3UCL GOS Institute of Child Health, University College London, London, United Kingdom, 4Department of Brain and Behavioural Sciences, University of Pavia, Pavia, Italy, 5Brain MRI 3T Mondino Research Center, C. Mondino National Neurological Institute, Pavia, Italy
Synopsis
Numerous studies demonstrated structural network changes in patients with multiple sclerosis (MS). However, the predictive nature of the graph-derived metrics is not yet examined. In this longitudinal study, we constructed baseline diffusion-based structural networks and we used multiple linear regression analysis to assess the ability of the network measures to predict follow-up increased lesion load and brain atrophy in MS (n=49). Our results suggest that edge density, global and local efficiency can predict follow-up brain atrophy after adjusting for the nuisance variables, signifying that network analysis can provide new insights into disease trajectories and offer potential biomarkers for MS progression.
Purpose
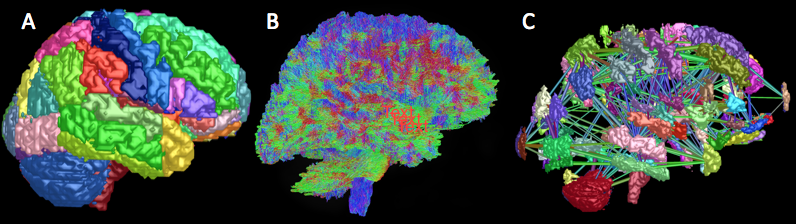
In recent years, it has been suggested that the brain can be modelled as a complex network and that connection disruption may be responsible for irreversible disability in neurodegenerative conditions. These include multiple sclerosis (MS), where disability is not strongly associated with measures obtained with conventional imaging techniques1. Recent advances in diffusion MRI and tractography methods enable us to non-invasively examine microstructural changes in the white matter (WM) and reconstruct the human brain network (figure 1). Even though several studies have showed structural network changes in patients with MS2, the ability of graph-derived metrics to predict brain damage either visible (i.e. lesion load) or at the microscopic level ultimately causing brain atrophy, has not yet been examined. The aim of our study was to investigate the relationship between baseline network measures (NM) including edge density (ED), global efficiency (GE) and local efficiency (LE) with follow-up lesion load (LL) and follow-up volumes of WM, cortical grey matter (CGM) and deep grey matter (DGM) in the whole MS group and disease subtypes (relapsing-remitting (RRMS), primary progressive (PPMS) and secondary progressive (SPMS)).Methods
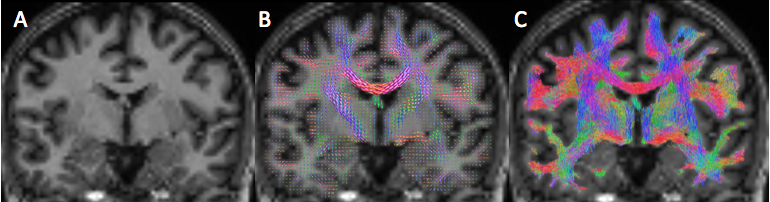
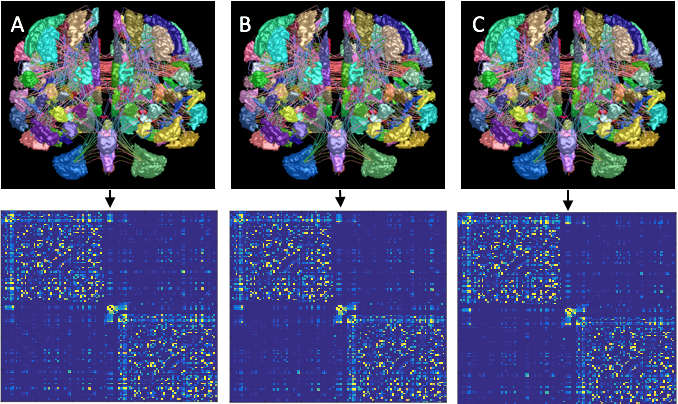
Patients: 20 RRMS (6M, mean age 42.95±11.94 years), 11 PPMS (6M, mean age 49.45±10.79 years) and 18 SPMS (7M, mean age 53.33±6.34 years), were scanned at 2 time points, approximately two years apart (1.84±0.55 years). Image acquisition: Images were acquired using a Philips Achieva 3T MR scanner (Philips Healthcare, Best, Netherlands) with a 32-channel head coil. Diffusion-weighted images (DWIs) were acquired using a cardiac-gated spin-echo (SE) sequence with echo planar imaging (EPI) readout: TR/TE=24000/68msec, resolution=2x2x2mm3, 61 b=1200s/mm2 and 7 b=0 volumes. T1-weighted images were acquired using a 3D (3DT1) fast field echo (FFE) sequence (TR/TE=6.9/3.1msec, resolution=1x1x1mm3, inversion pulse TI=824msec). DWI prepossessing: DWI were corrected for eddy current distortions and motion using FSL3 and susceptibility distortions using BrainSuite4. 3DT1 preprocessing: 3DT1 were lesion filled5 and registered to the DWI space using BrainSuite4. Brain tissue was segmented and parcellated using the Geodesic Information Flows (GIF) framework6. Tractography: Voxel-wise fiber orientation distribution functions (fODF) were estimated using constrained spherical deconvolution (CSD)7 and for each subject, 107 streamlines were generated using the “dynamic” seeding mechanism8. The probabilistic 2nd-order Integration over Fibre Orientation Distributions (iFOD2) algorithm with the Anatomically Constrained Tractography (ACT) framework was performed9 (figure 2). Spherical-deconvolution informed filtering of tractograms (SIFT2) was then applied to the tractogram to reweigh the contribution of the generated streamlines to the appropriate edges8. Connectome generation: Streamlines were assigned to nodes within a 2mm radius of each streamline endpoint10. One structural connectome was constructed per subject (figure 3). NM were derived using TractoR11. Statistical analysis: Multiple linear regressions assessed the ability of baseline NM (independent variable, in turn) to predict brain follow-up volumes, i.e. WM, CGM, DGM volumes and LL (dependent variable, in turn) adjusting for the baseline value of the follow-up volume being predicted. Age, gender, baseline LL and disease duration were also entered as confounders.Results
Whole MS group: At baseline, lower ED (p=0.032), GE(p=0.003) and LE (p=0.023) were associated with lower follow-up DGM volume.
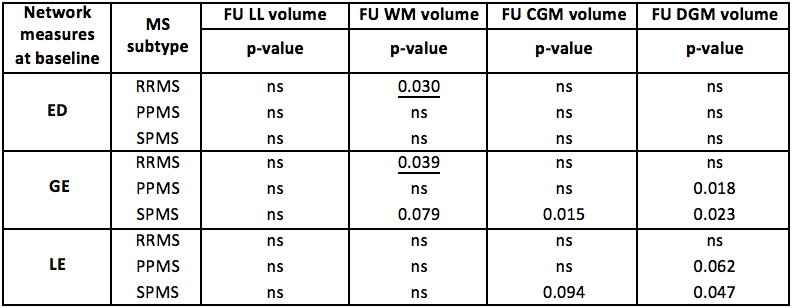
MS subtypes: We report the following results obtained when studying the predictive nature of NM in MS subtypes (table1):
In RRMS: Higher ED (p=0.030) and GE (p=0.039) at baseline predict smaller follow-up WM volume.
In PPMS: Lower baseline GE (p=0.019) and LE (p=0.061) predict smaller follow-up DGM volume.
In SPMS: Lower baseline GE (p=0.079) predicts smaller follow-up WM volume. Similarly, lower GE (p=0.015) and LE (p=0.094) at baseline are associated with lower follow-up CGM volume. Finally, lower GE (p=0.023) and LE (p=0.047) at baseline predict lower follow-up DGM volume.
Discussion
The results in this study demonstrate that baseline NM can predict later brain atrophy but not lesion load increase after adjusting for appropriate metrics. Additionally, NM can predict less brain volume loss in RRMS in which inflammation prevails, whereas in PPMS and SPMS, conditions with more neurodegenerative substrate, NM predict greater brain atrophy. ED relates to connectivity of the network whereas GE and LE are mainly associated with long-range and short-range connections respectively. The fact that these NM can predict brain damage, independently of lesion load, suggests that NM are sensitive to capture a pathological process other than the inflammatory cascade, potentially impaired structural connections, that anticipates the manifestation of brain atrophy. The behaviour of NM indicates that the predicting value is subtype-dependent implying that different underlying mechanisms may drive MS subtypes.Conclusion
The results presented in this study suggest that network analysis can provide potential biomarkers for disease progression. Further work is now warranted to determine their clinical relevance.Acknowledgements
The UK MS Society and the UCL-UCLH Biomedical Research Centre for ongoing support. Wolfson Experimental Neurology Centre Studentship Scheme.References
1. Stam CJ. Modern network science of neurological disorders. Nat Rev Neurosci. 2014;15(10):683-95.
2. Shu N, Liu Y, Li K, Duan Y, Wang J, Yu C, et al. Diffusion tensor tractography reveals disrupted topological efficiency in white matter structural networks in multiple sclerosis. Cereb Cortex. 2011;21(11):2565-77.
3. Andersson JL, Sotiropoulos SN. An integrated approach to correction for off-resonance effects and subject movement in diffusion MR imaging. Neuroimage. 2016;125:1063-78.
4. Bhushan C, Haldar JP, Joshi AA, Leahy RM. Correcting Susceptibility-Induced Distortion in Diffusion-Weighted MRI using Constrained Nonrigid Registration. Signal Inf Process Assoc Annu Summit Conf APSIPA Asia Pac. 2012;2012.
5. Prados F, Cardoso MJ, Kanber B, Ciccarelli O, Kapoor R, Gandini Wheeler-Kingshott CA, et al. A multi-time-point modality-agnostic patch-based method for lesion filling in multiple sclerosis. Neuroimage. 2016;139:376-84.
6. Cardoso MJ, Modat M, Wolz R, Melbourne A, Cash D, Rueckert D, et al. Geodesic Information Flows: Spatially-Variant Graphs and Their Application to Segmentation and Fusion. IEEE Trans Med Imaging. 2015;34(9):1976-88.
7. Tournier JD, Calamante F, Connelly A. Robust determination of the fibre orientation distribution in diffusion MRI: non-negativity constrained super-resolved spherical deconvolution. Neuroimage. 2007;35(4):1459-72.
8. Smith RE, Tournier JD, Calamante F, Connelly A. SIFT2: Enabling dense quantitative assessment of brain white matter connectivity using streamlines tractography. Neuroimage. 2015;119:338-51.
9. Smith RE, Tournier JD, Calamante F, Connelly A. Anatomically-constrained tractography: improved diffusion MRI streamlines tractography through effective use of anatomical information. Neuroimage. 2012;62(3):1924-38.
10. Smith RE, Tournier JD, Calamante F, Connelly A. The effects of SIFT on the reproducibility and biological accuracy of the structural connectome. Neuroimage. 2015;104:253-65.
11. Clayden J, Maniega SM, Stokey AJ, D.M. K, Bastin ME, Clark CA. TractoR: Magnetic Resonance Imaging and Tractography with R. JSS. 2011.
Figures