4059
Toward a standardized quantitative imaging protocol for multiple sclerosis: a multisite study of magnetization transfer and quantitative T1 imaging techniques1Advanced Imaging Research Center, Oregon Health & Science University, Portland, OR, United States, 2Brigham & Women's Hospital, Harvard Medical School, 3Johns Hopkins, 4Yale, 5Siemens Medical Solutions, Portland, OR, 6University of California San Francisco, 7National Institute of Neurological Disease and Stroke, National Institute of Health, 8University of Toronto, 9Siemens Healthcare, Baltimore, MD, 10University of Southern California, Keck School of Medicine, 11Oregon Health & Science University, Portland, OR, United States
Synopsis
The current lack of standardization in MRI protocols leads to increased variability, particularly in semi-quantitative techniques such as MTR, and makes comparisons between studies almost impossible. A single subject with clinically stable RRMS travelled to seven North American sites and underwent two distinct 3T MRI sessions following a standardized MTR and qT1 protocol at each site. Both MTR and qT1 mapping have been shown to have potential in elucidating tissue characteristics and underlying pathology. This work demonstrated that use of carefully standardized protocols produces consistent quantitative and semi-quantitative measurements across sites in MS brain tissue in-vivo.
Introduction
The North American Imaging in Multiple Sclerosis (NAIMS) Cooperative was formed with the goal of developing sensitive, reliable imaging-based surrogates for disease progression in MS. The results of these efforts will accelerate MS research by creating standardized quantitative imaging protocols, a centralized database, multiple analytic tools, and data sharing across NAIMS sites.Methods
A single subject with clinically stable RRMS traveled to seven North American sites and underwent two distinct 3T MRI sessions following a standardized protocol at each site. Informed consent was obtained at each imaging center. The variable flip angle (FA) method (FA 3°, 6°, 10°, 20°) was employed to create whole-brain quantitative T1 (qT1) maps. Magnetization transfer images were acquired with two saturation pulse offset frequencies (4kHz, 100kHz) at 8 mT amplitude, sufficient for magnetization transfer ratio (MTR) calculation. Tissue and lesion segmentation was achieved using LesionTOADS software.1,2 Lesion masks were manually edited as necessary.Results
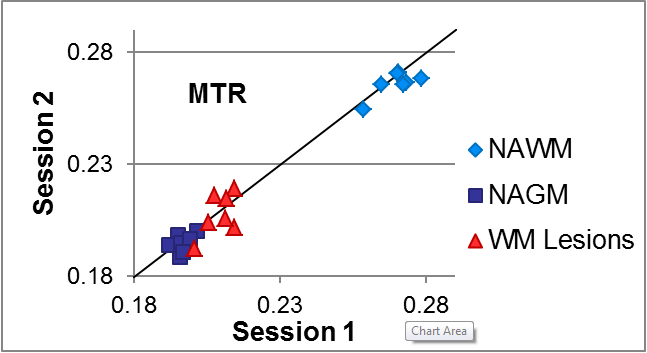
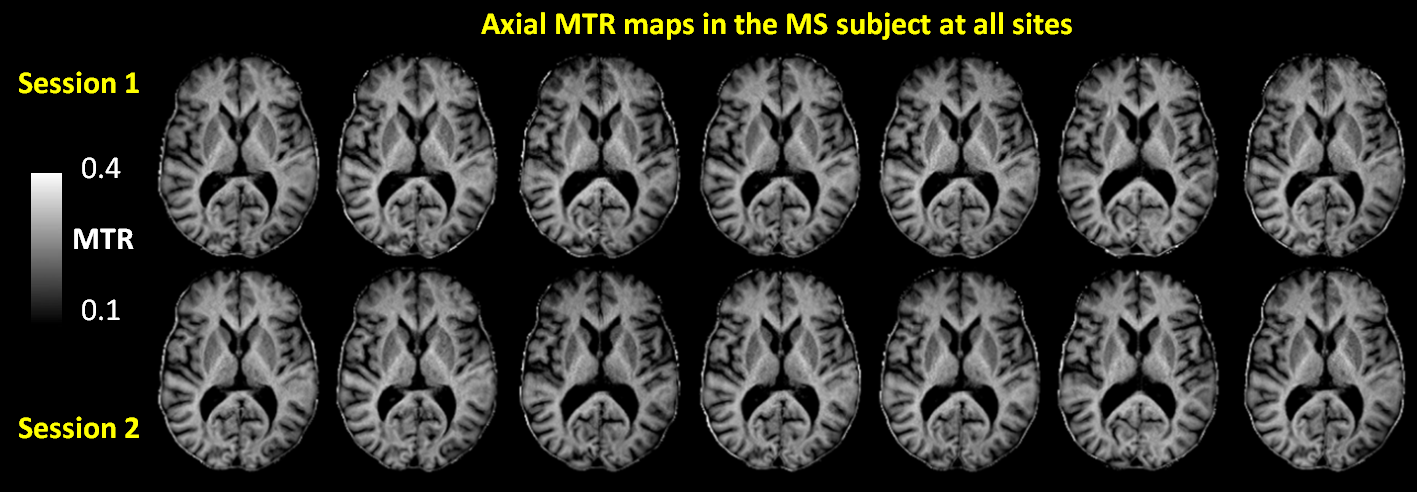
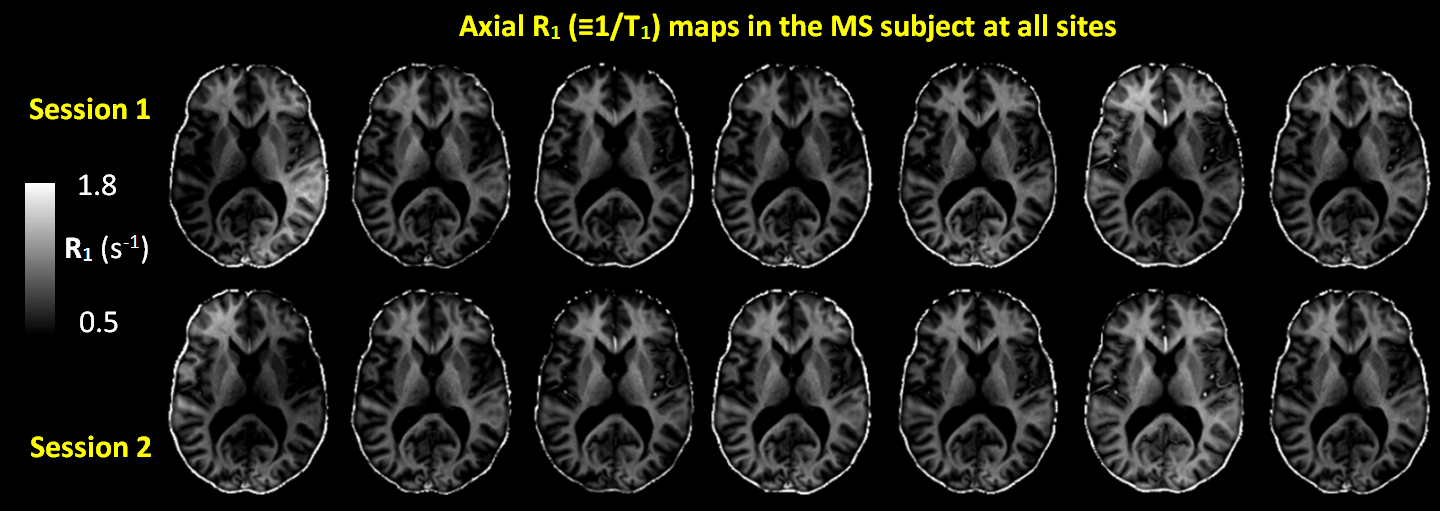
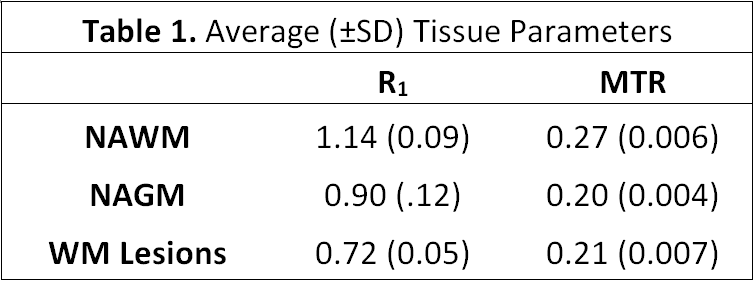
Imaging sessions were successfully completed at all sites between October 2015 and February 2016. Mean (±standard deviation) white matter, cortical grey matter, and lesion MTR and R1 (≡1/T1) values for all imaging sessions are shown in Table 1. Mean intra-session MTR variance was 0.0001 across all sites and demonstrated good correlation as illustrated in Figure 1. MTR maps were of similar quality (characterized by signal-to-noise ratio, homogeneity) across all sites and are shown in Figure 2. Despite applying corrections, B1 inhomogeneity contributed to substantial inconsistencies in qT1 maps (Figure 3), particularly in the most superior and inferior regions of the brain where radio frequency coil performance is variable and sensitive to subject placement within the instrument.Discussion
Both MTR and qT1 mapping have been shown to have potential in elucidating tissue characteristics and underlying pathology.3-6 MTR is effectively a self-bias-correcting technique and demonstrated greater reproducibility across sites than did qT1 mapping. The current lack of standardization in MRI protocols leads to increased variability, particularly in semi-quantitative techniques such as MTR, and makes comparisons between studies almost impossible. This work demonstrated that use of carefully standardized protocols produces consistent quantitative and semi-quantitative measurements across sites in MS brain tissue in-vivo. Future work will combine the qT1 and MTR maps for quantitative calculations of macromolecular fraction.Acknowledgements
Funding provided by Race to Erase MS.
This work has been submitted on behalf of the NAIMS Consortium
References
1. Shiee, N. et al. A topology-preserving approach to the segmentation of brain images with multiple sclerosis lesions. Neuroimage 2010;49(2):1524–1535 .
2. Shiee, N. et al. Revisiting brain atrophy and its relationship to disability in multiple sclerosis. PLoS One 2012;7(5):e37049
3. Mottershead, J. P. et al. High field MRI correlates of myelin content and axonal density in multiple sclerosis: A post-mortem study of the spinal cord. J. Neurol. 250, 1293–1301 (2003).
4. Bonnier, G. et al. Multicontrast MRI Quantification of Focal Inflammation and Degeneration in Multiple Sclerosis. Biomed Res. Int. 2015, 569123 (2015).
5. Al-Radaideh, A. et al. Histogram analysis of quantitative T1 and MT maps from ultrahigh field MRI in clinically isolated syndrome and relapsing-remitting multiple sclerosis. NMR Biomed. 28, 1374–1382 (2015).
6. Tagge, I. et al. Spatio-Temporal Patterns of Demyelination and Remyelination in the Cuprizone Mouse Model. PLoS One 11, e0152480 (2016).
Figures