4058
Longitudinal Changes in Magnetic Resonance Spectroscopy Over 96 Weeks in Relapsing MS Treated with Ocrelizumab versus Interferon Beta-1a1Neurology, University of British Columbia, Vancouver, BC, Canada, 2Radiology, University of British Columbia, Vancouver, BC, Canada, 3Statistics, University of British Columbia, Vancouver, BC, Canada, 4Genetech, Roche Pharmaceuticals, South San Francisco, CA, United States
Synopsis
Single voxel magnetic resonance spectroscopy (MRS) was performed in thirty-seven relapsing multiple sclerosis (MS) patients, who were enrolled in a phase III clinical trial of ocrelizumab versus interferon beta-1a, at baseline, 24, 48, and 96 weeks follow-up. 24 healthy controls were also scanned. MRS demonstrated a significant interaction between visit and treatment group in the NAA/tCr ratio. The change in absolute metabolite concentrations over 96 weeks revealed that this interaction was primarily driven by increased NAA and reduced inflammation in the ocrelizumab group, while the interferon beta-1a group exhibited a smaller increase in NAA and ongoing inflammation.
Purpose
To investigate magnetic resonance spectroscopy (MRS) biomarker changes over 2 years in a phase III clinical trial of ocrelizumab (OCR) and interferon beta-1a (IFNb) in patients diagnosed with relapsing multiple sclerosis (MS).Background
MS disease pathogenesis involves widespread tissue damage beyond focal lesions, affecting both the normal appearing white matter (NAWM) and normal appearing grey matter1. MRS offers many biomarkers of brain metabolite status, including N-acetyl-aspartate (NAA, primary role: neuron-oligodendrocyte coupling2), total creatine (tCr, energy storage), total choline (tCho, membrane synthesis), myo-inositol (mI, glial marker), glutamate (Glu, neurotransmitter), and glutamine (Gln, glutamate uptake). The goal of this study was to determine how these biomarkers of brain health are differentially affected in relapsing MS patients treated with OCR versus IFNb.Methods
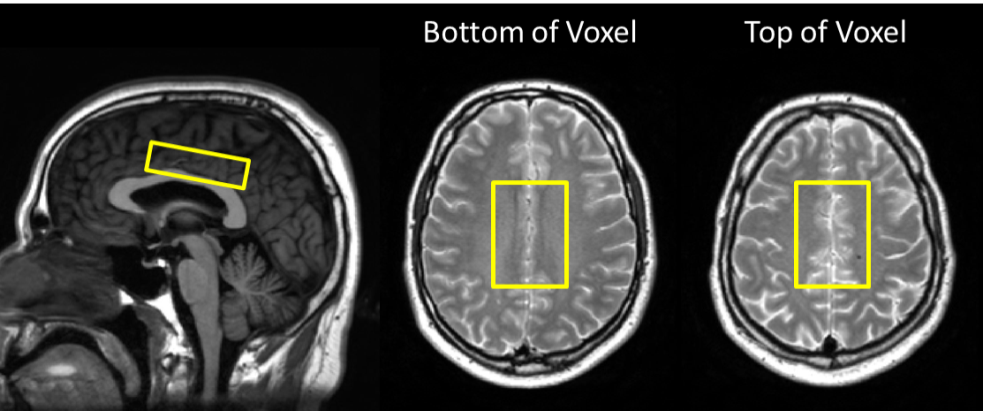
40 relapsing MS subjects participating in a phase III clinical trial of OCR versus IFNb (OPERA) were scanned at 24, 48, and 96 weeks follow-up, including 26 scanned at baseline. 24 matched healthy controls were scanned at baseline, weeks 48 and 96. MR spectra were measured from a 6.5x4.5x1.8cm3 primarily NAWM voxel (figure 1) with PRESS (TE/TR = 36/4000ms; 56 water-suppressed & 8 non-water-suppressed acquisitions) on a 3T Philips Achieva system (Best, The Netherlands) with an 8 channel phased array coil. Second-order shimming and excitation water suppression were employed. Spectra were fit with LCModel3 version 6.3. Concentrations were calculated relative to water and corrected for compartmentation and relaxation. Individual fits were rejected if the absolute value of the error estimate was above 30% of the median concentration across all spectra4. Metabolite levels were fit to a mixed effects model repeated measures analysis that can handle missing data to examine differences between treatment arms. Differences between groups in the percent change over 96 weeks were tested with an ANOVA with the Tukey method controlling for multiple comparisons. Raw uncorrected p values are reported.Results
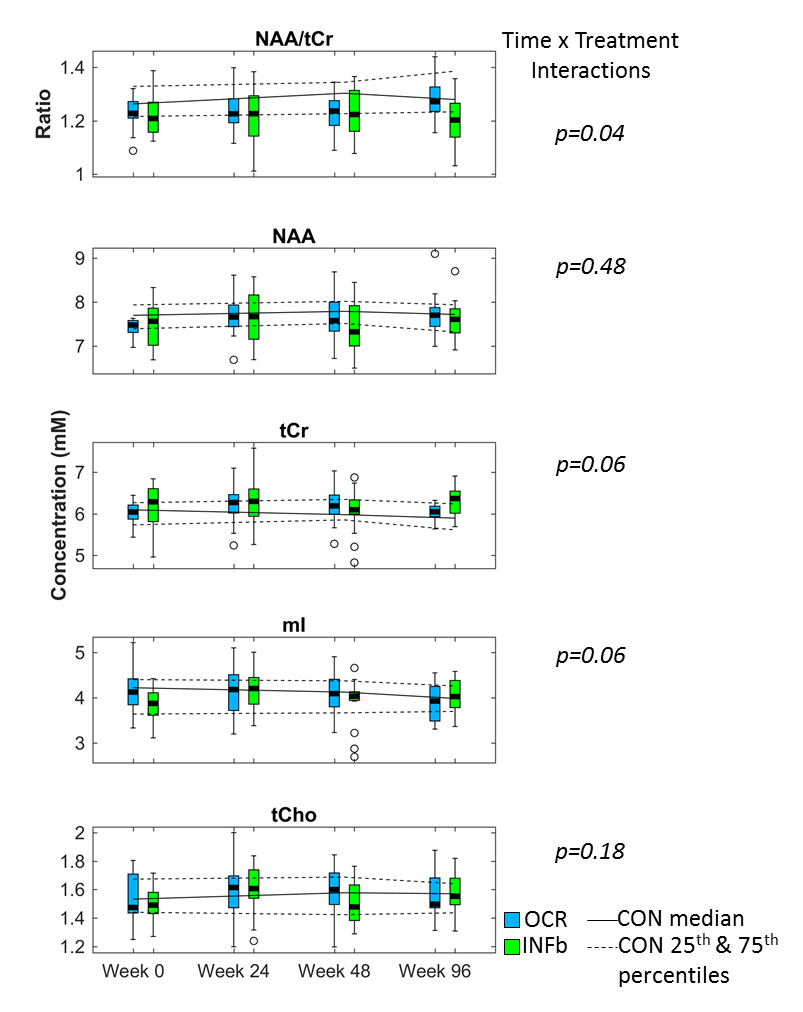
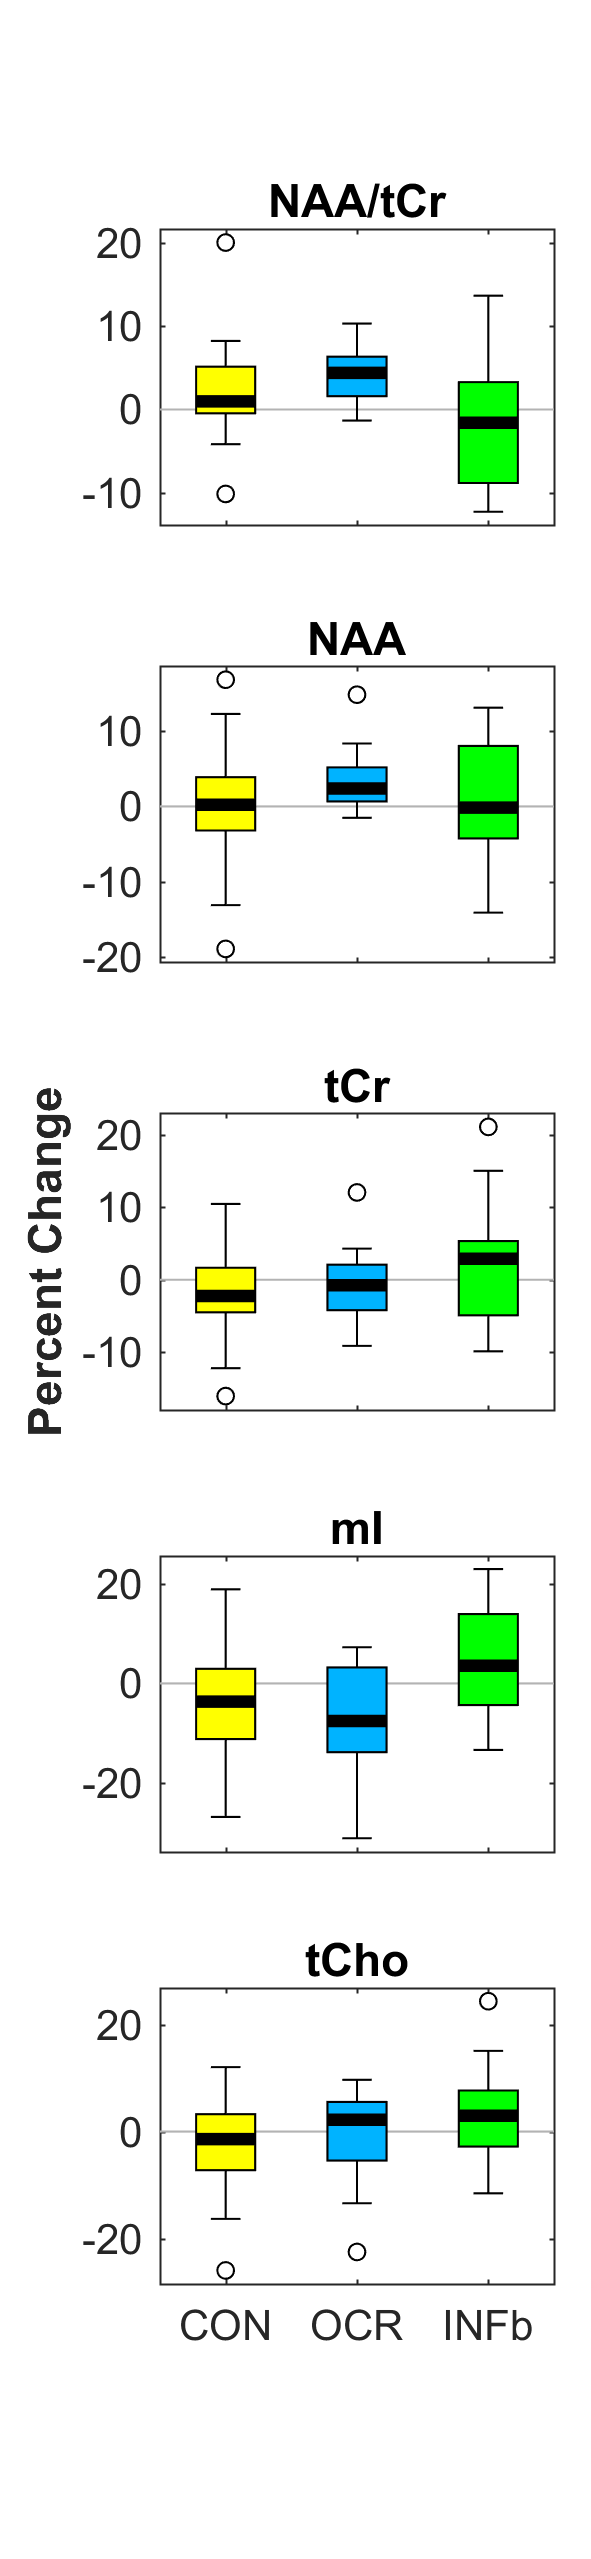
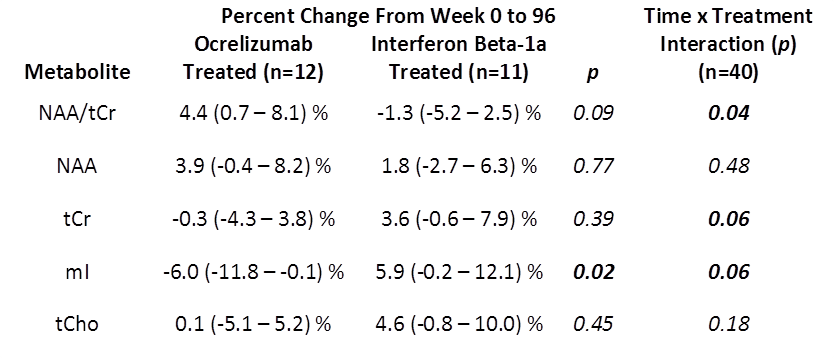
This study obtained high signal to noise (median 47; range 33 – 58) and low linewidth (5.9; 4.0 – 8.8 Hz) spectra. Each metabolite listed above was reliably fit, except Gln which was reliably fit in 105/205 spectra. Time × treatment interactions were observed for NAA/tCr (p=0.04), and the absolute concentrations of tCr and mI (both p=0.06), but not for NAA (p=0.48), see figure 2. On average over 96 weeks, the NAA/tCr ratio was more likely to increase for OCR treated subjects (mean +4.4% (95% confidence interval 0.7 – 8.1)) than for those treated with IFNb (-1.3% ( -5.2 – 2.5)), see figures 3 and 4. However, NAA alone tended towards an increase in both treatment arms, whereas tCr was more likely to decline in the OCR group than in the IFNb group, as is evident from the lower p value for the percent change in figure 4. Similarly, mI was significantly more likely to be decreased in the OCR group than in the IFNb group (p=0.02), and the OCR group’s decline is also significantly below zero. The percent change over 96 weeks was less likely to reach significance since not all subjects completed both scans. Other metabolites did not exhibit different trends between treatment arms.Discussion
The increase in NAA/tCr ratio in OCR over 96 weeks could be interpreted as protection and/or ongoing repair of axons or myelin. Analysis of NAA and tCr separately reveal that the time × treatment interaction was primarily driven by changes in tCr. For the IFNb group, the stronger trends towards increases in tCr, tCho, and mI, as compared to the change in NAA, suggest that this cohort may be experiencing ongoing diffuse inflammation and microglial activation5. Conversely, the stronger trend towards an increase in NAA, with stable tCr and tCho, and significant decline in mI in the OCR group suggest that there may be improved neuron-myelin coupling2,5 and a reduction in inflammation in this cohort. Rising NAA in the NAWM of treated MS patients has been observed previously. However, the stable tCr and tCho, and declining mI in the OCR group is a new finding, not previously observed in other cohorts that had been treated with INFb and glatiramer acetate5-8.Conclusions
In this study tCr demonstrated a much stronger time × treatment interaction than NAA, which would be masked if only the ratio of NAA/tCr was reported. The stable tCr and declining mI in the OCR treated group, combined with a stronger trend to rising NAA than in the IFNb treated group, suggests that OCR may better reduce inflammation and create a supportive environment for repair of myelin and axons. These results from a small cohort motivate further application of MRS in clinical trials of MS.Acknowledgements
We gratefully acknowledge support from The University of British Columbia (UBC) MRI Research Centre, patients with MS and volunteers. This study was funded by F. Hoffmann-La Roche Ltd and was supported in part by a postdoctoral fellowship from the MS Society of Canada.References
1. Wegner C. Recent insights into the pathology of multiple sclerosis and neuromyelitis optica. Clin Neurol Neurosur 2013;115s:s38-s41.
2. Nordengen K, Heuser C, Rinholm JE, et al. Localisation of N-acetylaspartate in oligodendrocytes/myelin. Brain Struct Funct 2015;2(220):899-917.
3. Provencher S. Estimation of metabolite concentrations from localized in vivo proton NMR spectra. Magn Reson Med 1993;30(6):672-679.
4. Kreis R. The trouble with quality filtering based on relative Cramér-Rao lower bounds. Magn Reson Med 2016;75(1):15-18
5. Kirov I, Tal A, Babb JS, et al. Serial proton MR spectroscopy of gray and white matter in relapsing-remitting MS. Neurology 2013;80(1):39-46
6. Arnold DL, Narayanan S, Antel S. Neuroprotection with glatiramer acetate: evidence from the PreCISe trial. J Neurol 2013;260:1901–1906.
7. Khan O, Shen Y, Caon C, et al. Axonal metabolic recovery and potential neuroprotective effect of glatiramer acetate in relapsing-remitting multiple sclerosis. Mult Scler 2005;11:646–651.
8. Narayanan S, De Stefano N, Francis GS, et al. Axonal metabolic recovery in multiple sclerosis patients treated with interferon beta-1b. J Neurol 2001;248:979–986.
Figures