4056
A preliminary study: the Values of Quantitative Susceptibility Mapping (QSM) in CIS and MS in Children1Imaging Center, Beijing Children's Hospita, Capital Medical University, Beijing, People's Republic of China, 2MR Research China, GE Healthcare, 3Neurology Department, Beijing Children's Hospita, Capital Medical University, Beijing, People's Republic of China
Synopsis
Quantitative Susceptibility Mapping (QSM) has been well used in evaluating the iron quantity changes in adult patients with multiple sclerosis (MS). However, it has not been tested in pediatric MS patients. In the present study, QSM was applied to assess difference of iron quantity in clinically isolated syndrome (CIS) and MS in children. It is shown that QSM provides a superior sensitivity method in the detection iron of changes of MS-related tissue in children, which suggests that QSM may serve as a potential sensitive biomarker in pediatric MS.
Introduction
Multiple sclerosis (MS) is an inflammatory disease of the central nervous system that has accumulated iron in deep grey matter (DGM) nuclei and in white matter (WM) lesions1,2. Quantitative susceptibility mapping (QSM) is a non-invasive and in vivo technique to detect bulk magnetic susceptibility distribution of tissue3,4. It has been successfully used to predict the age and clinical severity of MS in adults3-6. However, both the characteristic imaging appearance and the diagnose criterion of pediatric patients with MS are so different from the adults7. Whether QSM can be conducted to detect MS in children is still need to be investigated. The purpose of this study is trying to figure out whether QSM can offer helpful information to the detection and diagnosis of MS lesions of pediatric patients.Methods
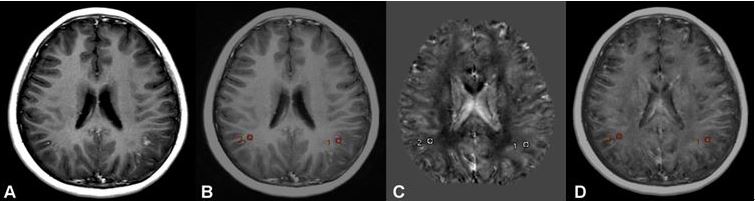
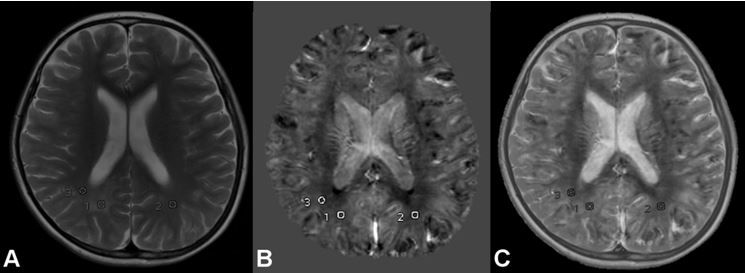
This study was approved by the ethics committee of Beijing Children’s Hospital. Seven patients (aging from 8 to 13 years, with mean age 10.5 years; male 3, female 4) were included in this study. Three of them were diagnosed as CIS and the rest of them were relapsing-remitting MS. MR images were scanned on a 3.0 T GE Discovery MR750 scanner. For each patient, high resolution T2-wighted images, post-contrast T1-weighted images and 3D multi-echo gradient echo images were scanned. Hyper intensity on T2-weighted images was used to define MS lesions and newly enhanced lesion regions in post-contrast T1-weighted image were defined as acute lesions. Susceptibility maps were reconstructed from the 3D multi echo gradient-echo images. White matter lesions and the normal-appearing white matter surrounding the lesions (peri-lesion regions) were selected as regions of interest (ROI). For comparison, the NAWM on contralateral mirror site of the lesions with the same shape and size were also labeled. Mean susceptibility values of all ROI were extracted and then a series of paired t-test were conducted to examine the differences between MS lesions, peri-lesion regions and normal control regions. In addition, susceptibility values of acute and longstanding lesions were compared to see whether there are differences of QSM between those regions.Results
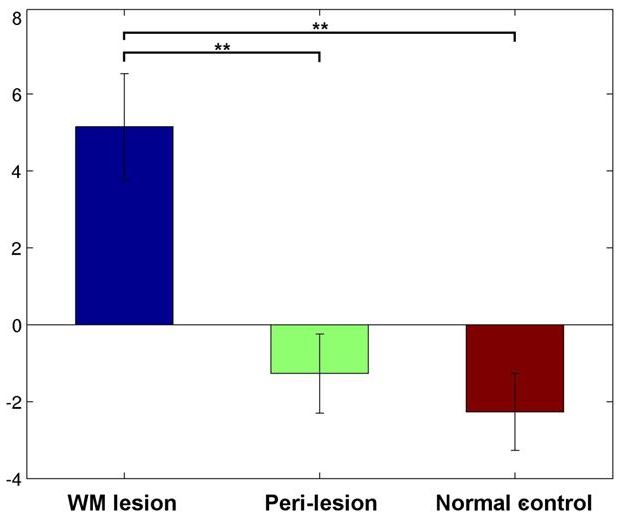
In sum, there were 30 lesions out of 7 (CIS and MS) patients were labeled. Five of them were contrast enhanced acute lesions (a representative can see Fig.1) and the rest were non-enhanced lesions (a representative can see Fig.2). The susceptibility values relative to cerebrospinal fluid were 5.15±1.38 ppb for WM lesions, -1.27±1.03 ppb for peri-lesion white matter regions and -2.27±1.00 ppb for normal control regions (see Fig. 3). It is shown that significant statistical differences existed between WM lesions and both peri-lesion regions and normal control regions. Although peri-lesion regions have relative increased mean susceptibility value compared to normal control regions, there was no statistical difference between them. In addition, the susceptibility values of non-enhanced MS lesions were higher than enhanced lesions, but no statistical difference between them (p = 0.058).Discussion and conclusion
In the present study, significant differences of susceptibility were found between MS lesions and control regions (both of peri-lesion and normal control regions). This is similar to the results of adult patients4,6. Although without significant statistical difference, there is a trend that non-enhanced lesions have increased QSM value than the enhanced acute WM lesions. This phenomenon may be related to activated demyelination with the infiltration of macrophages contain myelin fragments with low iron content8,9. The non-enhanced lesions which have been suggested related to contain iron-rich microglia with relative high QSM value8,9. In sum, QSM may serve as a potential sensitive marker of MS evaluation in children, although more investigation needs to be done considering the limited amount of subject in this study.Acknowledgements
No acknowledgement found.References
1. Hametner S, Wimmer I, Haider L, et al. Iron and neurodegeneration in the multiple sclerosis brain. Ann Neurol. 2013;74,848–861.
2. Mehta V, Pei W, Yang G, et al. Iron is a sensitive biomarker for inflammation in multiple sclerosis lesions. PLoS ONE. 2013;8:1–10.
3.Liu C, Wei H, Gong NJ, et al. Quantitative Susceptibility Mapping: Contrast Mechanisms and Clinical Applications. Tomography. 2015;1(1):3-17.
4.Stüber C, Pitt D, Wang Y.Iron in Multiple Sclerosis and Its Noninvasive Imaging with Quantitative Susceptibility Mapping.Int J Mol Sci. 2016;17(1):1-22.
5.Liu T,Khalil M,Enzinger C,et al.Quantitative susceptibility mapping in multiple sclerosis. Radiology. 2013; 267 (2):551-559.
6.Zhang Y, Gauthier SA, Gupta A, et al. Longitudinal change in magnetic susceptibility of new enhanced multiple sclerosis (MS) lesions measured on serial quantitative susceptibility mapping (QSM).J Magn Reson Imaging. 2016;44(2):426-432.
7.Polman CH, Reingold SC, Banwell B, et al. Diagnostic criteria for multiple sclerosis: 2010 revisions to the McDonald criteria. Ann Neurol. 2011;69(2):292-302.
8. Boven LA, Van Meurs M, Van Zwam M, et al. Myelin-laden macrophages are anti-inflammatory, consistent with foam cells in multiple sclerosis. Brain. 2006;129(Pt 2):517-526.
9.Wisnieff C, Ramanan S, Olesik J, et al. Quantitative susceptibility mapping (QSM) of white matter multiple sclerosis lesions: Interpreting positive susceptibility and the presence of iron. Magn Reson Med. 2015;74(2):564-570.
Figures