4053
A longitudinal study of the effect of Multiple Sclerosis on surrounding white matter using z-spectrum imaging at 7T1Physics and Astronomy, Sir Peter Mansfield Imaging Centre, University of Nottingham, Nottingham, United Kingdom, 2Neurology, Queen’s Medical Centre, University of Nottingham, Nottingham, United Kingdom
Synopsis
MS lesions are known to evolve in time, many showing signs of remyelination. To investigate this, we considered the changes in the regions around existing lesions of varying ages, to test the hypothesis that there is ongoing tissue damage in the regions around white matter lesions in MS. We found that the quantitative MT measured at 7T values in the region surrounding MS lesions decreased over the period of a longitudinal 6 month study. No systematic trend was found for the lesion core. This supports the hypothesis that an MS lesion causes ongoing damage in the region surrounding the lesion.
Introduction
MS lesions are known to evolve in time, many showing signs of remyelination. However it has been suggested that ongoing tissue damage in the regions around lesions may be partly responsible for the changes seen in normal appearing white matter in Multiple Sclerosis (MS)1. To investigate this we have performed a longitudinal study, repeatedly scanning patients for 6 months, assessing Magnetization transfer and Nuclear Overhauser Effect (NOE at -3.5 ppm) signal obtained from quantitative analysis of z-spectrum, as markers of myelination change or other tissue damage. We considered the changes in the regions around existing lesions of varying ages, to test the hypothesis that there is ongoing tissue damage in the regions around white matter lesions in MS.Methods
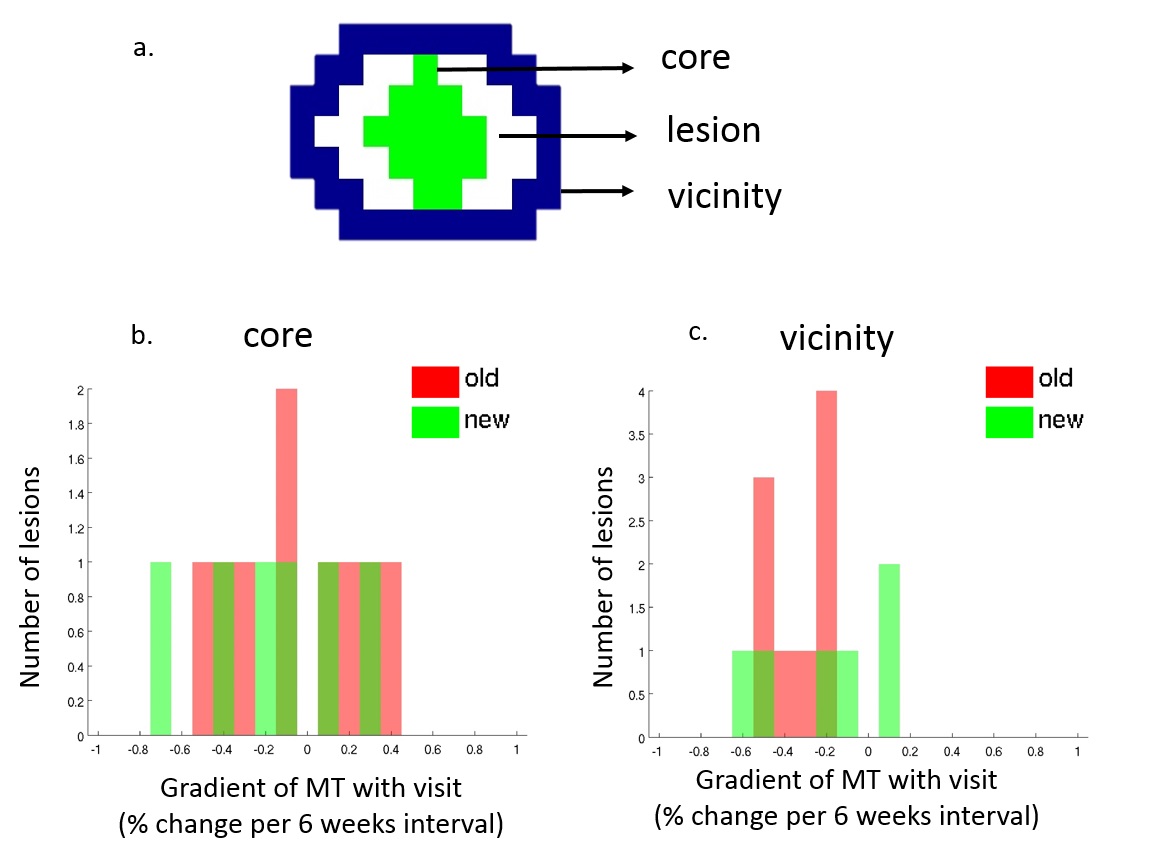
Acquisition: With ethics approval, 4 patients with chronic Multiple Sclerosis were scanned using a 7T Philips Achieva system with a 32 channel receiver coil. Each patient had previously had a clinical 3T scan within 18 months and was scanned 6 times at 7T with 6 weeks between scans (30 weeks total). z-spectra were acquired using an MT-TFE sequence2 (saturation train: 20 gaussian-windowed sinc pulses, BW=200Hz, 17 saturation frequency from -5kHz to 5kHz, 2 B1rms values of 0.38μT and 0.75μT; acquisition: TE/TR/FA = 2.7ms/5.8ms/8°, FOV = 192x192x60 mm3, 1.5mm isotropic image resolution, low-high k-space acquisition and a SENSE factor (RL) of 2. B0 and B1 maps for correcting the z-spectra, a Phase Sensitive Inversion Recovery (PSIR) sequence to provide a pseudo T1 map, and a T2* map and high resolution FLAIR to delineate lesions were also acquired. For each visit, B0 corrected z-spectra were fitted pixel-wise for the amplitude of 3 pools (MT, NOE and APT) relative to water, calculating the sum of squares difference between the measured spectra and the database of simulated spectra based on the Bloch-McConnell equations3 and using B1 and T1 maps to correct B1 and T1 effect on the spectra. Processing: For each subject, datasets were co-registered via FSL4 onto the PSIR of the first visit, and lesion masks drawn by an experience neurologist on the FLAIR images. The lesion masks were eroded and dilated to produce ROIs corresponding to the lesion core and the lesion vicinity. Lesions apparent at the first 7T visit were classified as either being old (visible on a 3T scan 18 months previously) or new (not visible on a 3T scan 3 months previously). Variations in the MT and NOE pool sizes over the 6 visits were estimated for the lesion core and vicinity masks.Results
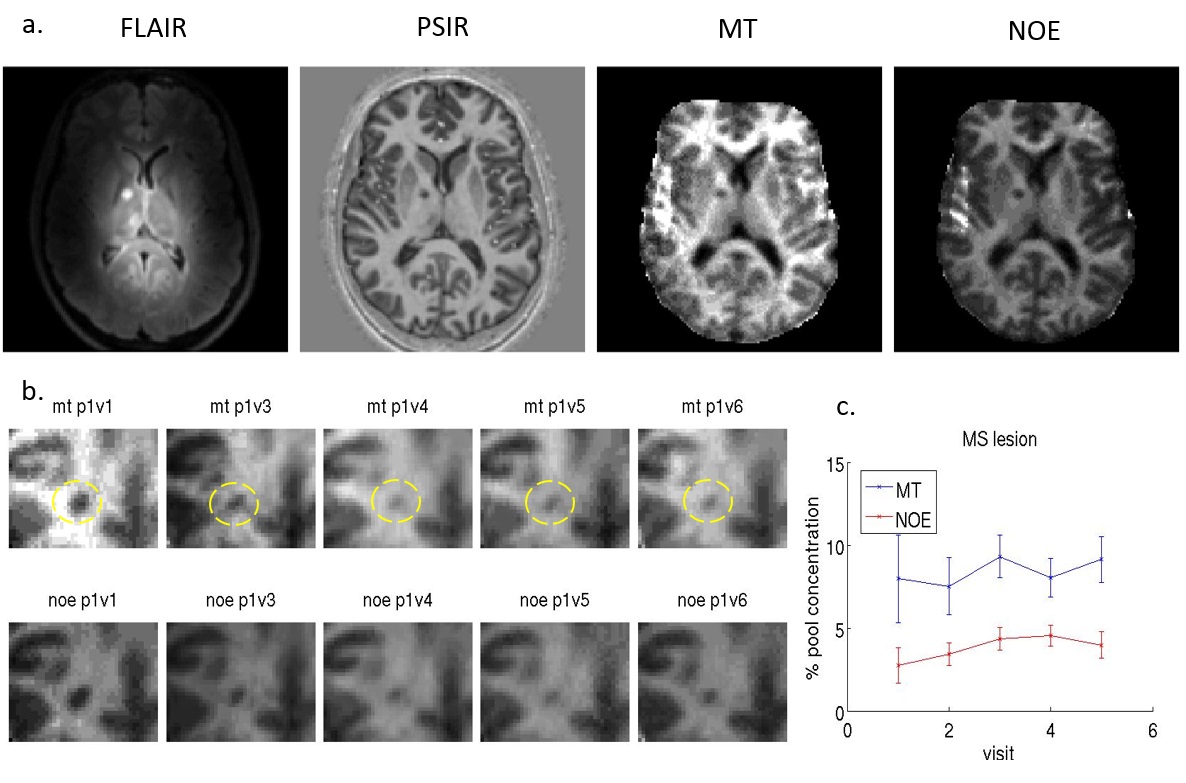
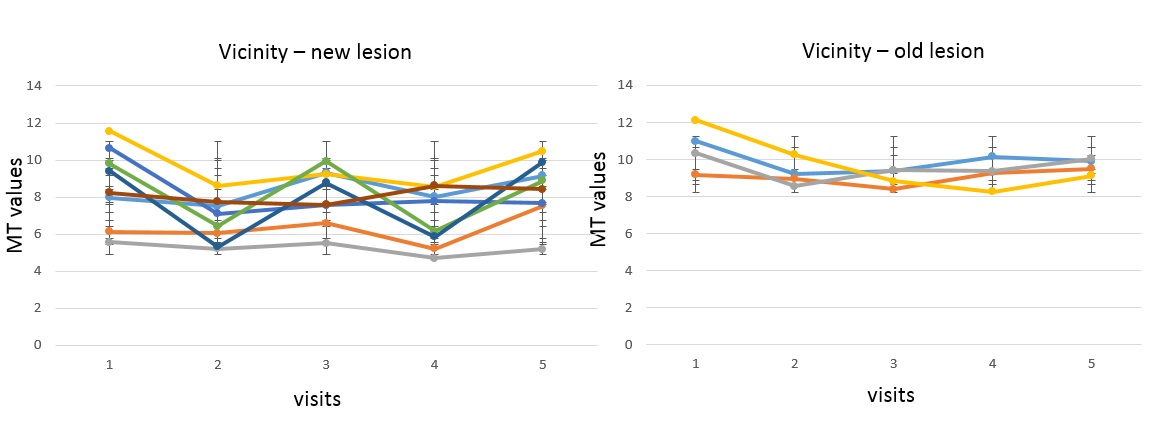
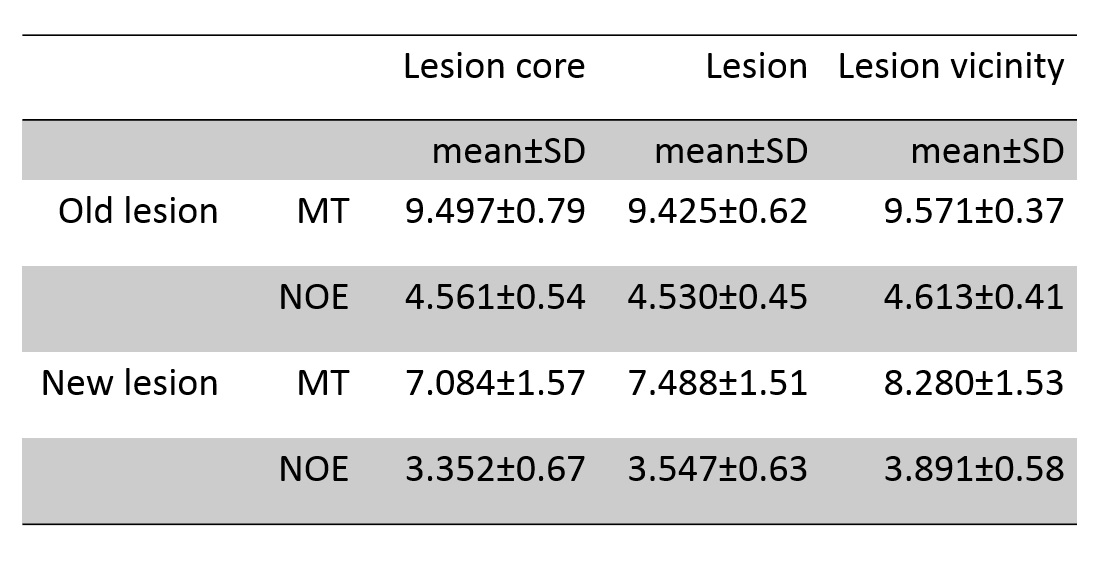
Figure 1 a shows example images at visit 1 and Figure 1b shows the variation in MT and NOE maps between visits. Figure 1c plots the variation in MT and NOE between visits, averaged across the original lesion mask. Similar plots were created for vicinity and core lesions masks, and the gradient of each with visit number was calculated. Figure 2 show the distributions of these gradients for the core and vicinity ROIs and the old and new lesions separately for MT. It can be seen that the gradients in the cores of the lesions vary but the gradients in the vicinity regions are always negative (Figure 3). There was no systematic trend in the gradients of the NOE signals. Figure 4 shows the average of MT and NOE between old and new lesion across three regionsDiscussion
We found that the quantitative MT measured at 7T values in the region surrounding MS lesions decreased over the period of a longitudinal 6 month study. No systematic trend was found for the lesion core. This supports the hypothesis that an MS lesion causes ongoing damage in the region surrounding the lesion. This analysis was made possible by the use of careful quantitative measures that allowed longitudinal changes to be assessed with high sensitivity. It is interesting to note that the changes were only detected in MT and not NOE, suggesting some uncoupling of these measures, but this may also be due to reduced sensitivity to NOE in this experiment. Future work will investigate any correlation between these changes and other measures such as iron rings around the lesions, or changes in the core of the lesion.Conclusion
MS lesions cause detectable ongoing demyelination in the immediately surrounding white matter for years after initial formation.Acknowledgements
No acknowledgement found.References
1. Chen, J.T. et al. Magnetization transfer ratio evolution with demyelination and remyelination in multiple sclerosis lesions. Annals of Neurology, 2008; 63(2):254–262.
2. Mougin et al. High-resolution imaging of magnetization transfer and nuclear Overhauser effect in the human visual cortex at 7 T. NMR Biomed, 2013, 26(11):1508-1517
3. Geades et al. Quantitative Z-spectrum Analysis of the Healthy Human Brain at 7T. Magn Reson Med. 2016, Early View
4. M. Jenkinson, C.F. Beckmann, T.E. Behrens, M.W. Woolrich, S.M. Smith. FSL. NeuroImage, 2012; 62:782-90
Figures