4052
Longitudinal assessment of cervical cord atrophy across MS clinical phenotypes: a multicenter studyPaola Valsasina1, Maria Assunta Rocca1, Mohammad Ahmad Abdullah Ali Aboulwafa1, Paolo Preziosa1, Frederik Barkhof2, Hugo Vrenken2, Claudio Gobbi3, Chiara Zecca3, Alex Rovira4, Xavier Montalban5, Hugh Kearney6, Olga Ciccarelli6, Lucy Matthews7, Jacqueline Palace7, Antonio Gallo8, Alvino Bisecco8, Achim Gass9, Philipp Eisele9, Carsten Lukas10, Barbara Bellenberg10, Giancarlo Comi11, and Massimo Filippi1
1Neuroimaging Research Unit, San Raffaele Scientific Institute, Vita-Salute San Raffaele University, Milan, Italy, 2MS Centre Amsterdam, VU Medical Centre, Amsterdam, Netherlands, 3Department of Neurology, Neurocenter of Southern Switzerland, Lugano, Switzerland, 4Department of Radiology, Hospital Universitari Vall d'Hebron, Barcelona, Spain, 5Department of Neurology, Hospital Universitari Vall d'Hebron, Barcelona, Spain, 6Queen Square MS Centre, UCL Institute of Neurology, London, United Kingdom, 7Nuffield Department of Clinical Neurosciences, University of Oxford, Oxford, United Kingdom, 8MRI Center "SUN-FISM", Second University of Naples, Naples, Italy, 9Universitaetsmedizin Mannheim, University of Heidelberg, Mannheim, Germany, 10St Josef Hospital, Ruhr University Bochum, Bochum, Germany, 11Department of Neurology, San Raffaele Scientific Institute, Vita-Salute San Raffaele University, Milan, Italy
Synopsis
Aims of this large, multicenter study were to characterize baseline cervical cord atrophy in patients with multiple sclerosis (MS) compared with healthy controls, and to evaluate the modification of cervical cord cross-sectional area (CSA) over one-year of follow-up in such patients. Results indicated that baseline cord atrophy was present in MS patients vs controls, with a differential effect across phenotypes and a greater severity of atrophy in the progressive forms of the disease. Significant CSA decrease over time was found in relapsing remitting, primary progressive MS and in clinically worsened patients.
Purpose
The spinal cord is an eloquent site of the central nervous system that is frequently involved in multiple sclerosis (MS). Atrophy of the spinal cord (especially in the cervical segment) is a well-known feature of MS, which is more severe and correlates with disability in the progressive forms of the disease [1]. The relative small size of the spinal cord makes an adequate quantification of cord area a demanding task, especially in a longitudinal, multicenter context. Previous multicenter studies showed global atrophy of the cervical cord of MS patients, with a differential involvement across disease clinical phenotypes [2]. Large, multicenter studies assessing cord atrophy over time are still scanty. One preliminary study assessed the upper portion of the cervical cord over two years of follow-up, and found the highest rate of atrophy in progressive MS patients and in patients with disability progression [3]. Aim of this study was to track the longitudinal evolution of cervical cord atrophy in MS patients with the main disease clinical phenotypes and its clinical relevance, by analyzing a large, multicentre dataset acquired at 9 European sites.Methods
Baseline 3D T1-weighted cervical cord scans were acquired from 167 healthy controls (HC) and 421 MS patients (36 clinically isolated syndromes [CIS], 202 relapsing-remitting MS [RRMS], 96 secondary progressive MS [SPMS], 45 benign MS [BMS] and 42 primary progressive MS [PPMS]). Follow-up scans were obtained from 157 subjects (49 HC and 108 MS patients, median follow-up duration=1.1 years, range=0.5-2.1 years). Based on Expanded Disability Status Scale (EDSS) score [4] modifications at follow-up, MS patients were classified as clinically stable or worsened. Whole-cervical cord cross-sectional area (CSA) was assessed using an active surface method [5]. Baseline CSA and its longitudinal changes were compared between HC and MS patients, clinically worsened and stable patients, and among disease clinical phenotypes using ANOVA models (adjusted for age, sex and site) and paired t tests.Results
Eight HC and 16 MS patients were excluded from the analysis because of inadequate cord images (mainly related to movement artefacts or positioning problems). In all remaining study subjects, the AS method produced reliable estimates of cervical cord outlines, also when T1 hypointense lesions were present (Figure 1). Baseline CSA was lower in MS patients vs HC (p<0.001), PPMS vs HC and CIS (p<0.001), RRMS vs CIS (p=0.001), and SPMS vs BMS (p<0.001) and RRMS (p<0.001) (Figure 2). Longitudinal cord CSA change was +0.01% in HC (p=0.9) and -1.1% in MS (p=0.001), with a significant time x group interaction (p=0.04). When clinical phenotypes were analyzed separately, significant cord tissue loss was found in RRMS and PPMS only (Figure 3). Clinically worsened MS patients developed significantly higher cord atrophy than clinically stable MS (Figure 3).Conclusions
The application of the AS method in a multicenter context allowed a reliable measurement of whole cervical cord atrophy at high field, both cross-sectionally and longitudinally. As previously demonstrated in a single center study [6], the AS provided very consistent values of cord CSA in HC over time, thus ensuring reliability of cord measurements. In line with previous investigations [7], AS cord outlines were not influenced by the presence of T1 hypointense lesions. The baseline results confirm that cervical cord atrophy contributes to a better characterization of the clinical heterogeneity of MS. While CIS patients showed a trend towards an increased of cord CSA, possibly related to inflammation or edema-related cord expansion [8], cord tissue loss was significant in RRMS, and more severe in progressive than in relapsing MS phenotypes [2]. The longitudinal analysis showed a significant decrease over time of cord CSA in RRMS and PPMS patients, as well as in patients with disability progression. This is in line with previous studies [4, 6] and confirms the clinical relevance of cord atrophy and its ability to explain clinical worsening.Acknowledgements
Mohammad Aboul-Wafa has been supported by the ECTRIMS-MAGNIMS Fellowship in Magnetic Resonance Imaging.References
[1] Gass A., et al. Lancet Neurol 2015; 14: 443-454. [2] Rocca MA, et al. Neurology 2011; 76: 2096-2102. [3] Lukas C., et al. J Neurol Neurosurg Psychiatry 2015; 86: 410-418. [4] Kurtzke J.F. Neurology 1983; 33:1444-52. [5] Horsfield M.A., et al. Neuroimage 2010; 50: 446-455. [6] Valsasina P., et al. J Neurol 2015; 262: 1622-1628. [7] Yiannakas M., et al. Neuroimage Clin 2015; 10: 71-77. [8] Klein J., et al., Amer J Neuroradiol 2011; 32: 1138-1142.Figures
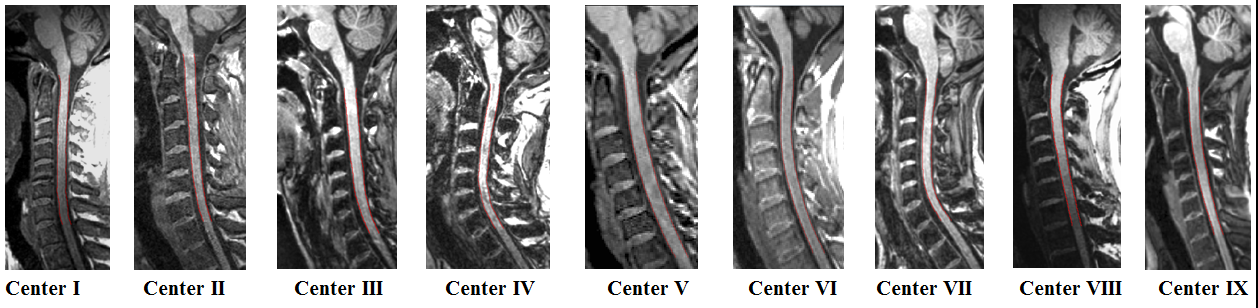
Illustrative examples of cord contours outlined using the active surface
method on cervical cord 3D T1-weighted scan at each study site.
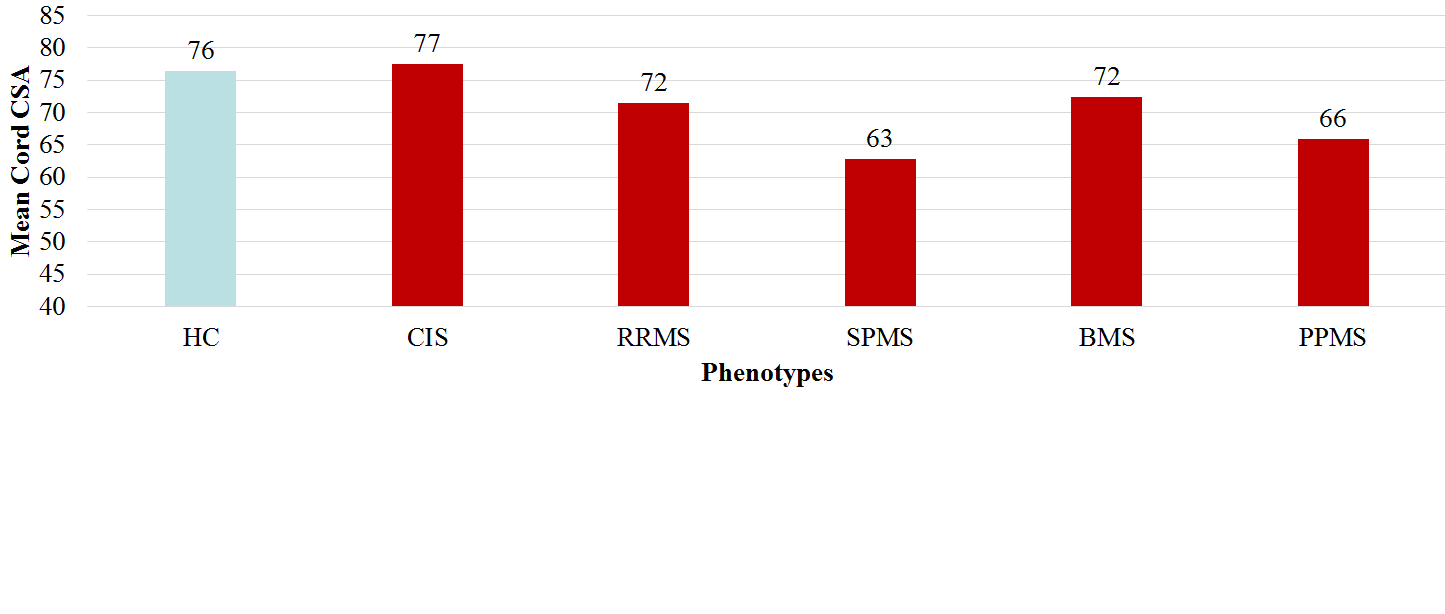
Comparison of baseline cord cross-sectional area (CSA) among healthy
controls (HC) and MS disease phenotypes. CIS=clinically isolated syndromes;
RRMS=relapsing remitting MS; SPMS=secondary progressive MS; BMS=benign MS;
PPMS=primary progressive MS.
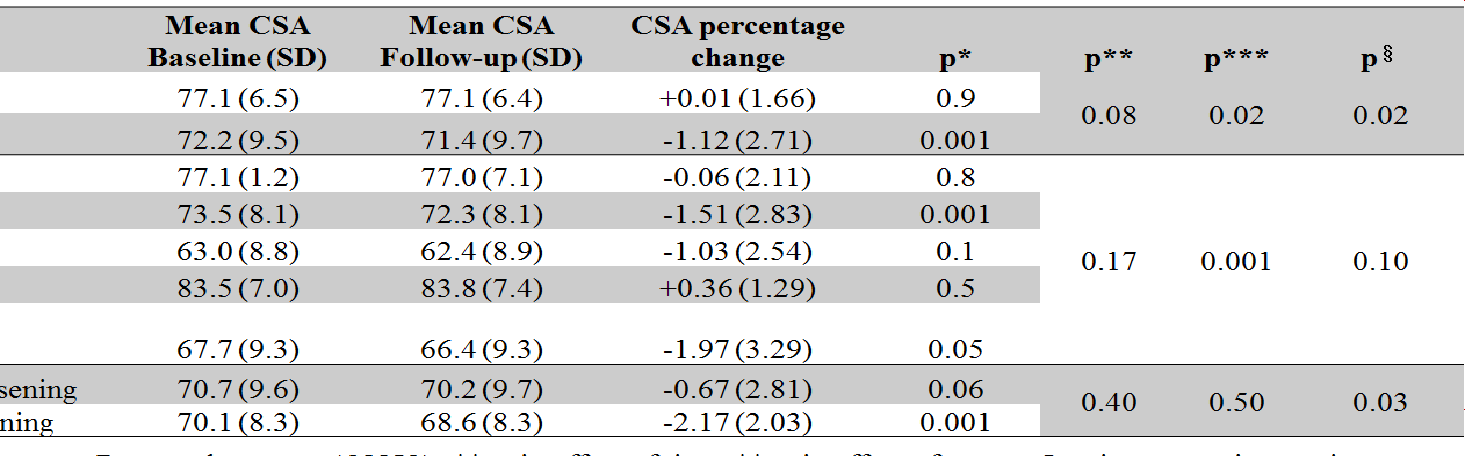
Results of the longitudinal analysis of cord cross-sectional area (CSA) in
healthy controls (HC) and MS patients. CIS=clinically isolated syndromes;
RRMS=relapsing remitting MS; SPMS=secondary progressive MS; BMS=benign MS;
PPMS=primary progressive MS.