4050
Myelin-Related MRI Metrics Demonstrate Longitudinal Differences for Relapsing MS Patients Treated with Ocrelizumab or Inteferon Beta-1a Over 96 Weeks1Neurology, University of British Columbia, Vancouver, BC, Canada, 2Radiology, University of British Columbia, Vancouver, BC, Canada, 3Biomedical Engineering, University of British Columbia, Vancouver, BC, Canada, 4Pediatrics, University of British Columbia, Vancouver, BC, Canada, 5Statistics, University of British Columbia, Vancouver, BC, Canada, 6Genentech, South San Francisco, CA, United States
Synopsis
Conventional MRI scans cannot evaluate disease-related changes in normal-appearing white matter, and have limited sensitivity for detecting changes in chronic lesions. In this work, we employed 2 quantitative MRI measures related to myelin content, myelin water fraction and magnetization transfer ratio, to evaluate the effects a potential novel therapy for multiple sclerosis (ocrelizumab) compared to a commonly-used therapy (interferon beta-1a). Over 2 years, these myelin-related measurements increased or remained stable in all regions for patients taking ocrelizumab, while they decreased for interferon beta-1a. These results support the use of quantitative MRI measures for more efficient, biologically specific clinical trial outcomes.
Introduction
MRI is routinely used to assess treatment effects in multiple sclerosis (MS) on the prevention of the development of new lesions. However, conventional scans cannot evaluate disease-related changes in normal-appearing white matter (NAWM), and have limited sensitivity for detecting changes in chronic lesions. Advanced MRI may improve sensitivity for clinical trials so that treatment effects are detected more reliably with fewer patients, and improve specificity, such that mechanisms of action can be identified and results can be more accurately interpreted. In this substudy we employed 2 quantitative MRI measures related to myelin content to evaluate the effects of ocrelizumab (OCR), a potential novel therapy for MS, compared to a commonly used therapy (interferon beta-1a (IFNb-1a)). The first MRI measure was the myelin water fraction (fM) as estimated using mcDESPOT1, a multi-component relaxometry technique that predominantly isolates signal from water trapped between myelin bilayers. The second was the magnetization transfer ratio (MTR), which is sensitive to the interaction between macromolecules (including those found in myelin) and bulk water2. We hypothesized that fM and MTR measurements in NAWM and chronic lesions would aid in detecting treatment effects associated with OCR and INFb-1a.Methods
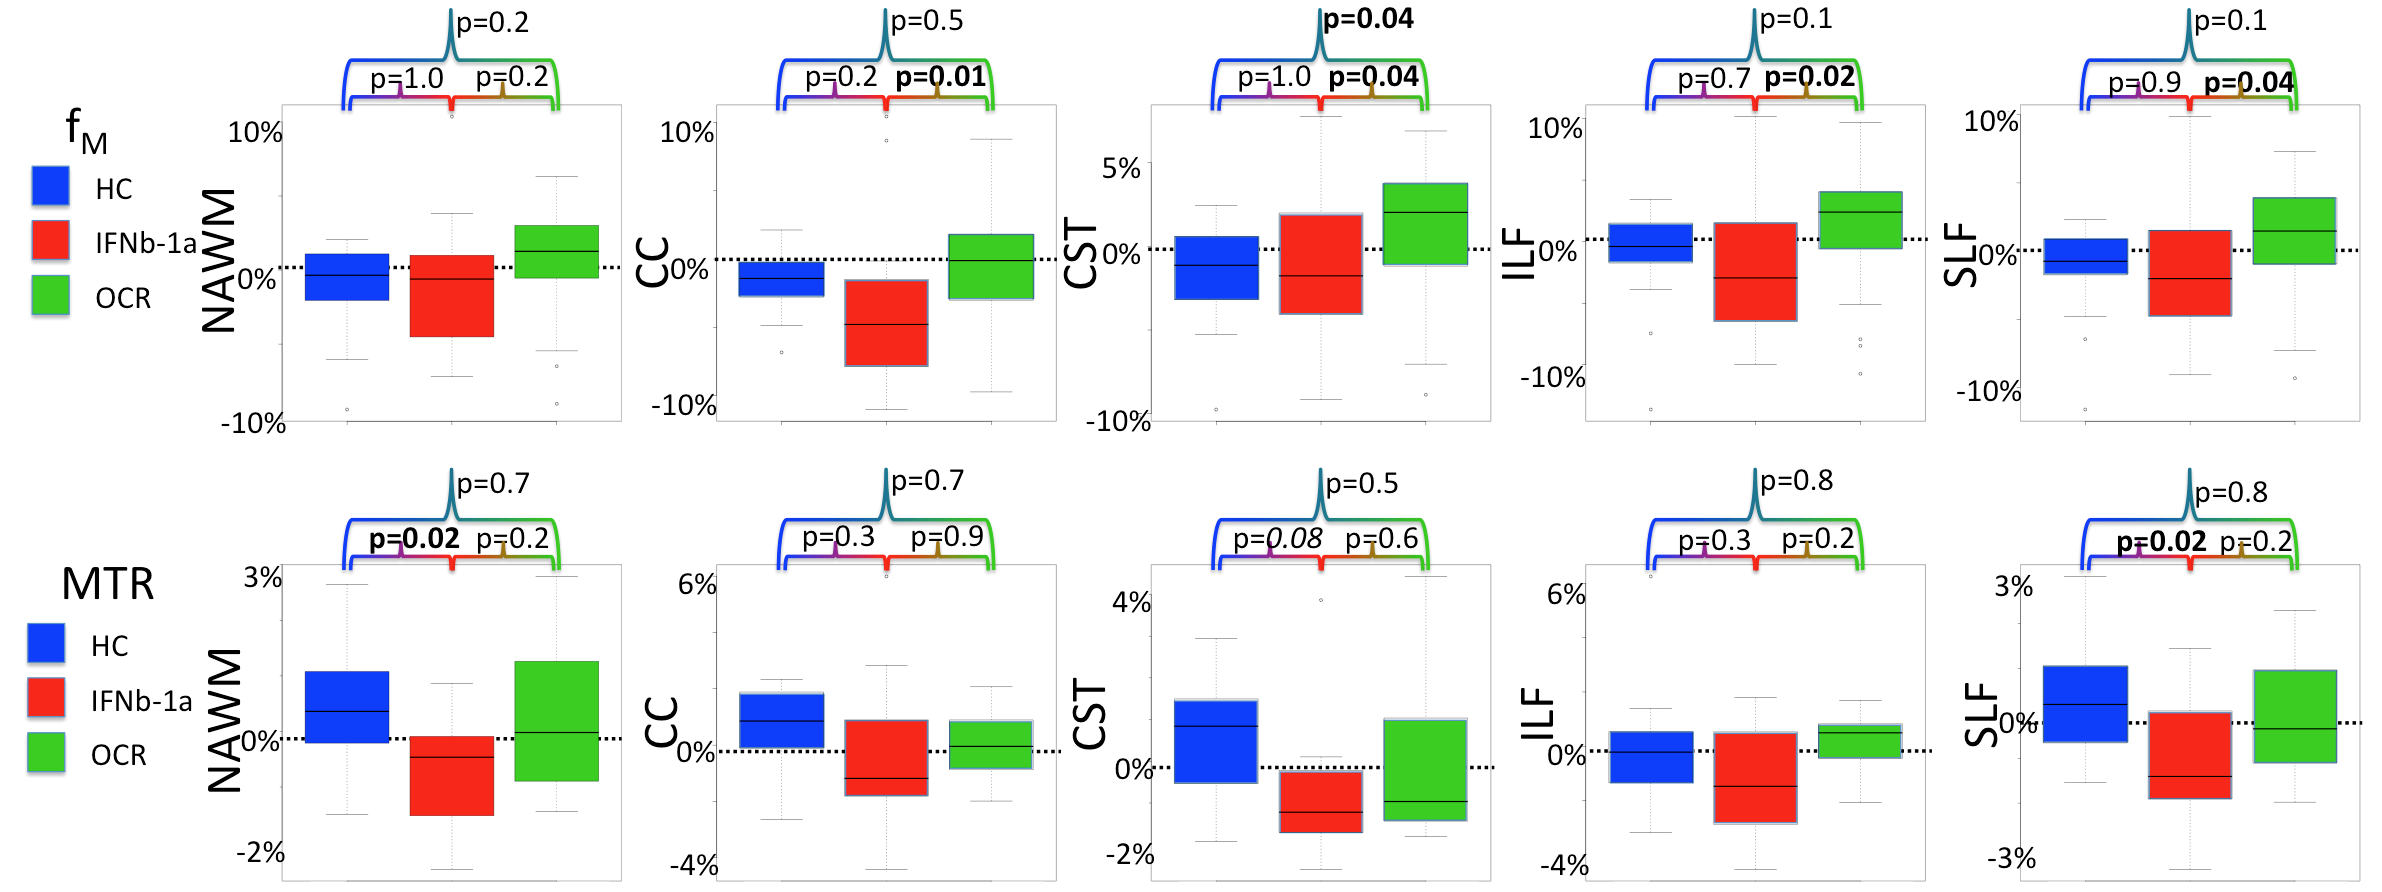
56 relapsing MS patients from a single centre participating in a multi-centre phase III randomized clinical trial of OCR versus IFNb-1a (OPERA II; NCT01412333) were scanned on a Philips 3T Achieva at weeks 0, 24, 48 and 96. 24 age- and sex-matched healthy controls (HC) were also scanned at weeks 0, 48 and 96. Scanning sequences included mcDESPOT imaging (53 RMS patients and 24 HC, 1.7x1.7x1.7mm, whole brain)3 and an MT sequence (37 RMS patients and 24 HC, TE/TR=3.7/85ms, 1x1x5mm, 20 slices, flip angle 18o). Average fM and MTR values were calculated voxelwise across the whole cerebrum for all NAWM, as well as for 4 white matter tracts (excluding lesions): the corpus callosum (CC), cortical spinal tract (CST), inferior longitudinal fasciculus (ILF), and superior longitudinal fasciculus (SLF). Lesions were detected using a semi-automated approach based on T2- and proton density-weighted images; chronic lesion regions of interest consisted of voxels identified as lesion across all time points, excluding lesions that were enhancing at any time point. A mixed-effect model was used to assess all data collected over time on each participant; the fixed effects were treatment group, visit and treatment-by-visit interaction. In addition, a one-way ANOVA was used to assess the effect of treatment group on the percent change from baseline to week 96.Results
NAWM: From the mixed-effect model, all regions showed similar trends in treatment-by-visit interaction for fM (CC p=0.04, CST p=0.02, ILF p=0.01, SLF p=0.02, all NAWM p=0.04). Percentage changes from week 0 to 96 are illustrated with p-values from the one-way ANOVA in figure 1; fM for patients taking OCR increased or remained stable in all regions, while it decreased for INFb-1a. MTR results demonstrated a similar pattern across all regions (figure 1).
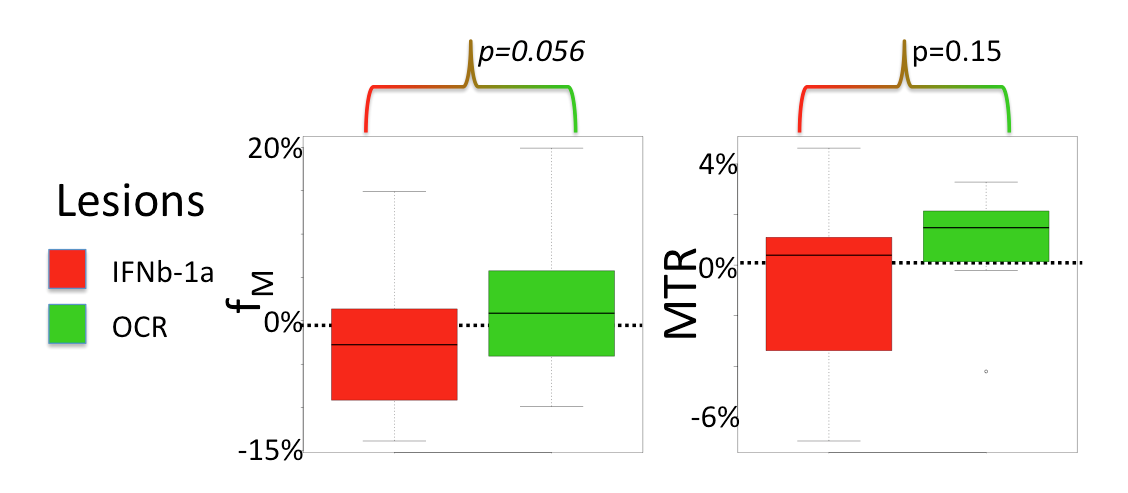
Lesions: From the mixed-effect model, the treatment-by-visit interaction was significant for MTR (p=0.01) and there was a trend for fM (p=0.06). The percentage changes from baseline to week 96 are illustrated with p-values from the one-way ANOVA in figure 2.
Discussion
Consistent patterns of results from the independently acquired but related measures of myelin integrity - fM and MTR - provide support for the hypothesis that OCR prevents diffuse myelin loss in NAWM over 2 years. This may relate to its prevention of new lesion development and subsequent Wallerian degeneration and/or suppression of diffuse inflammation and microglial activation that may contribute to progression in MS. Lesions also demonstrated potential treatment effects, suggesting that fM and MTR may be increasing over time in existing lesions with OCR treatment. Further evidence of repair may be gained by our continued monitoring of these patients for a further period of at least 2 years in an open label extension of the clinical trial.Conclusion
Use of quantitative measures related to myelin demonstrated consistent trends between groups treated with either OCR or INFb-1a across several regions in NAWM and lesions. Detection of this effect with such a small cohort (less than 5% of the population of the entire clinical trial) provides support for the use of advanced MRI measures for more efficient, biologically specific outcome measures in clinical trial of MS.Acknowledgements
This study was sponsored by Genentech, Inc. We are grateful for support from the Milan & Maureen Ilich Foundation.
References
1Deoni MRM 2008;60:1372.
2Wolff MRM 1989;10:135.
3Deoni MRM 2013;70:147.
Figures