4046
Longitudinal Study of MS lesions using Multi-contrast Ultra-high Field (7Tesla) MRI1Radiology, UNIVERSITY OF PENNSYLVANIA, Philadelphia, PA, United States, 2Neurology, Multiple Sclerosis Care Center, NYU School of Medicine, New York, NY, United States, 3Neurology, Universitätsspital, Basel, Switzerland, 4Medical Image Analysis Center, Basel, Switzerland, 5NeuroCure Clinical Research Center, Charité-Universitätsmedizin, Berlin, Germany, 6Radiology, NYU School of Medicine, New York, NY, United States
Synopsis
To track evolution of multiple sclerosis (MS) lesions, 9 patients underwent gradient-echo-T2* and quantitative susceptibility mapping on 7T MR system at baseline and at follow-up period (mean duration=2.4years). Majority of lesions were non-iron laden at baseline and most of them remained unchanged in size, morphology and susceptibility patterns. Some of these lesions accumulated iron deposition on follow-up. A minority of iron-laden lesions underwent redistribution of iron content. Small increase in lesion count was observed at follow-up. Interestingly, majority of these lesions were iron-enriched. This study may provide insights into pathophysiological features of MS lesions during the course of disease evolution.
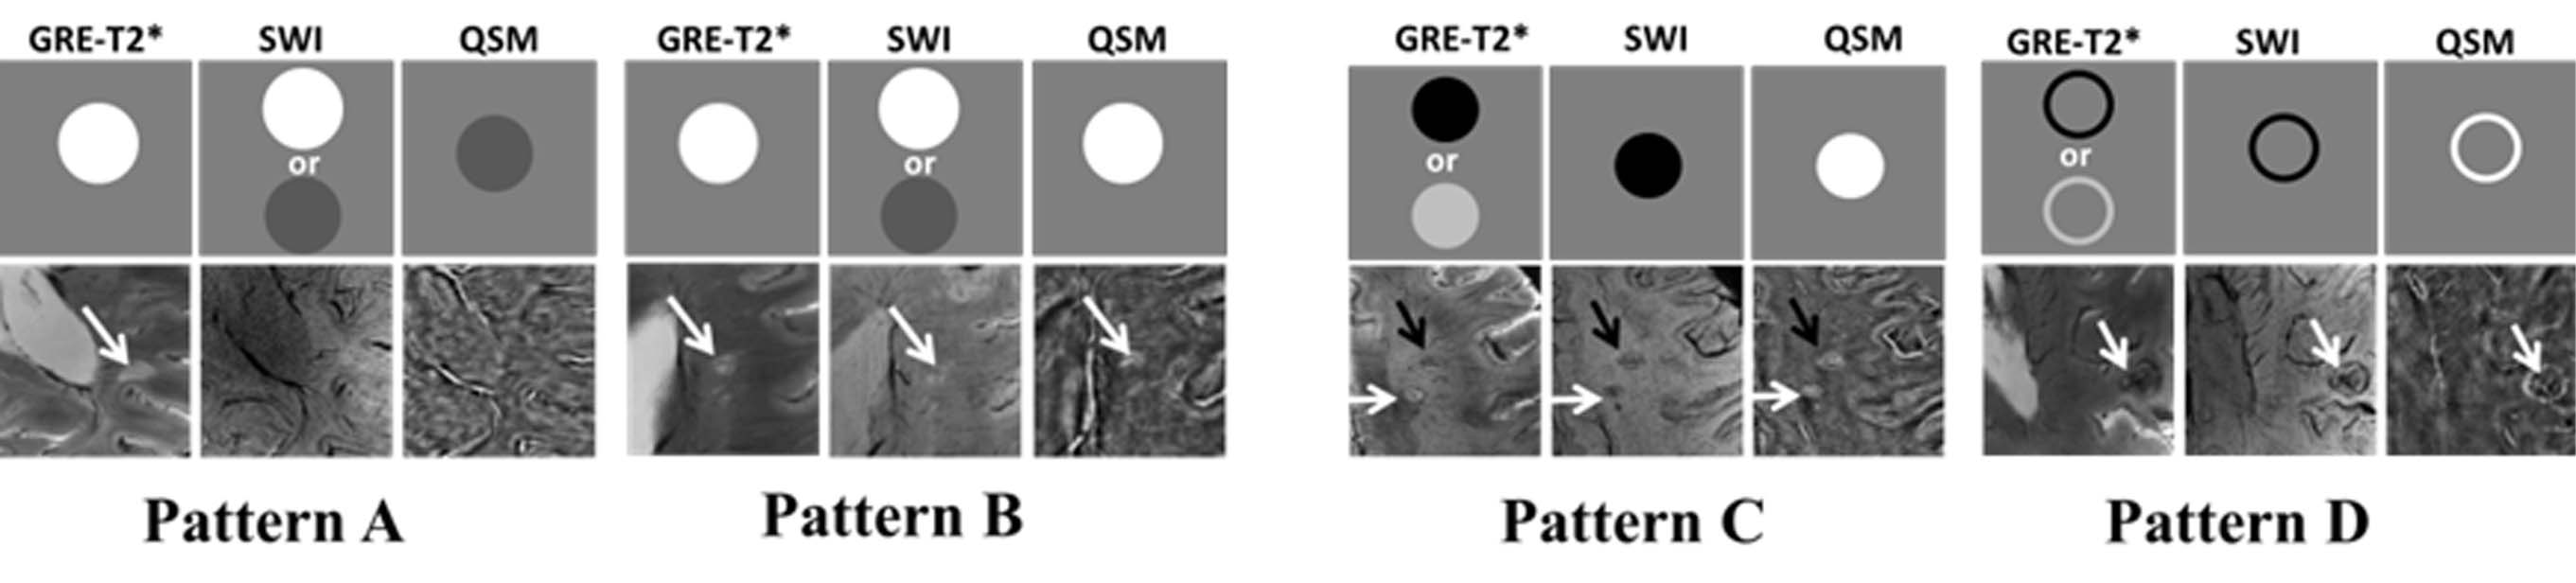
Purpose: In a previous cross-sectional study,1 we described four morphologically distinct patterns of multiple sclerosis (MS) lesions using multi-contrast MRI at 7T. Two patterns (A and B) were non-iron laden, and the other two (C and D) were iron-enriched as shown in Figure 1. However, underlying pathophysiology of these lesions is dynamic and it changes over time during the course of disease.2,3 Moreover, the presence and spatial distribution of iron in MS lesions is also expected to vary as lesions form and evolve. Therefore, in this study, we will provide the longitudinal follow-up data involving patients with MS and the objective of the present study was to track the evolution of MS lesions over time on 7T MRI.
Methods: A cohort of nine patients with definite MS underwent flow compensated and high-resolution (in plane resolution: 210x210μm2) 3D-susceptibility weighted imaging (SWI) and axial 2D-gradient-echo (GRE)-T2*-weighted imaging on 7T MRI at baseline and at follow-up period (mean duration: 2.40 ± 0.57 years, range: 2.01-3.83 years). SWI and the susceptibility mapping algorithm developed by Haacke et al.4,5 was used to reconstruct quantitative susceptibility mapping (QSM) from 3D-SWI data. All MS lesions were analyzed side by side on axial GRE-T2*, 3D-SWI, and QSM images. The following morphologic imaging characteristics were recorded : 1) location; 2) size; 3) total count; 4) lesion-vessel relationship; 5) differential signal intensity within the lesions; and 6) presence of a peripheral rim. Lesions were classified as "iron-laden" if they demonstrated hypointensity on T2*-weighted images and/or SWI and hyperintensity on QSM. Lesions were considered "non-iron-laden" if they were hyperintense on T2* and isointense or hyperintense on QSM.
Results: We report a comparison of salient features of MS lesions at baseline and at follow-up.
Lesion Characterization at Baseline
Lesion Count: A total of 191 lesions were observed at baseline. Lesion-vessel relationship: Central-vein was identified in 139 (73%) lesions. Percentage of lesions with a venule was similar for the different pattern (70% pattern A and 69% of pattern C). However, percentage of lesions with a venule differed by location: highest in periventricular lesions (85%), followed by subcortical (70%), corpus callosum (67%) and lowest in juxtocortical (46%) lesions. Lesion Pattern: Majority of lesions 157/191 (82%) were non-iron laden.
Lesion Characterization at Follow-up
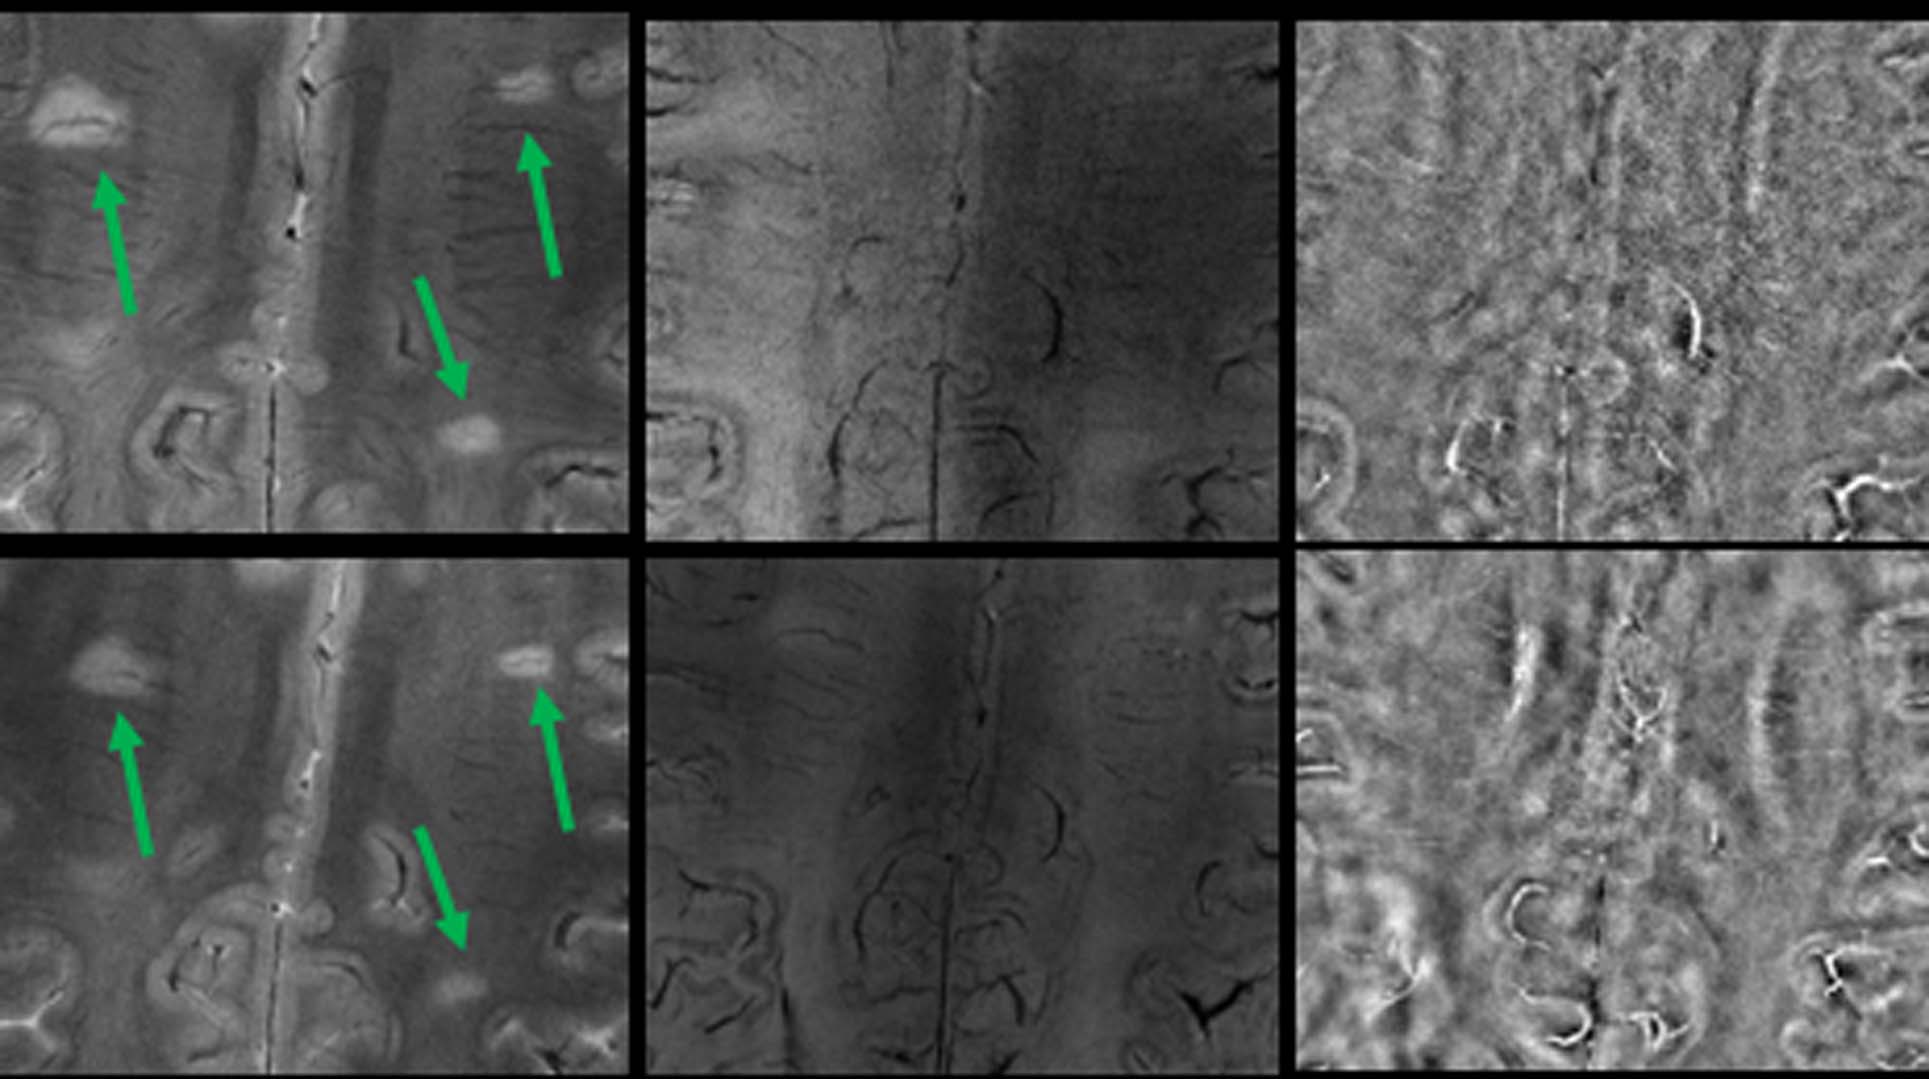
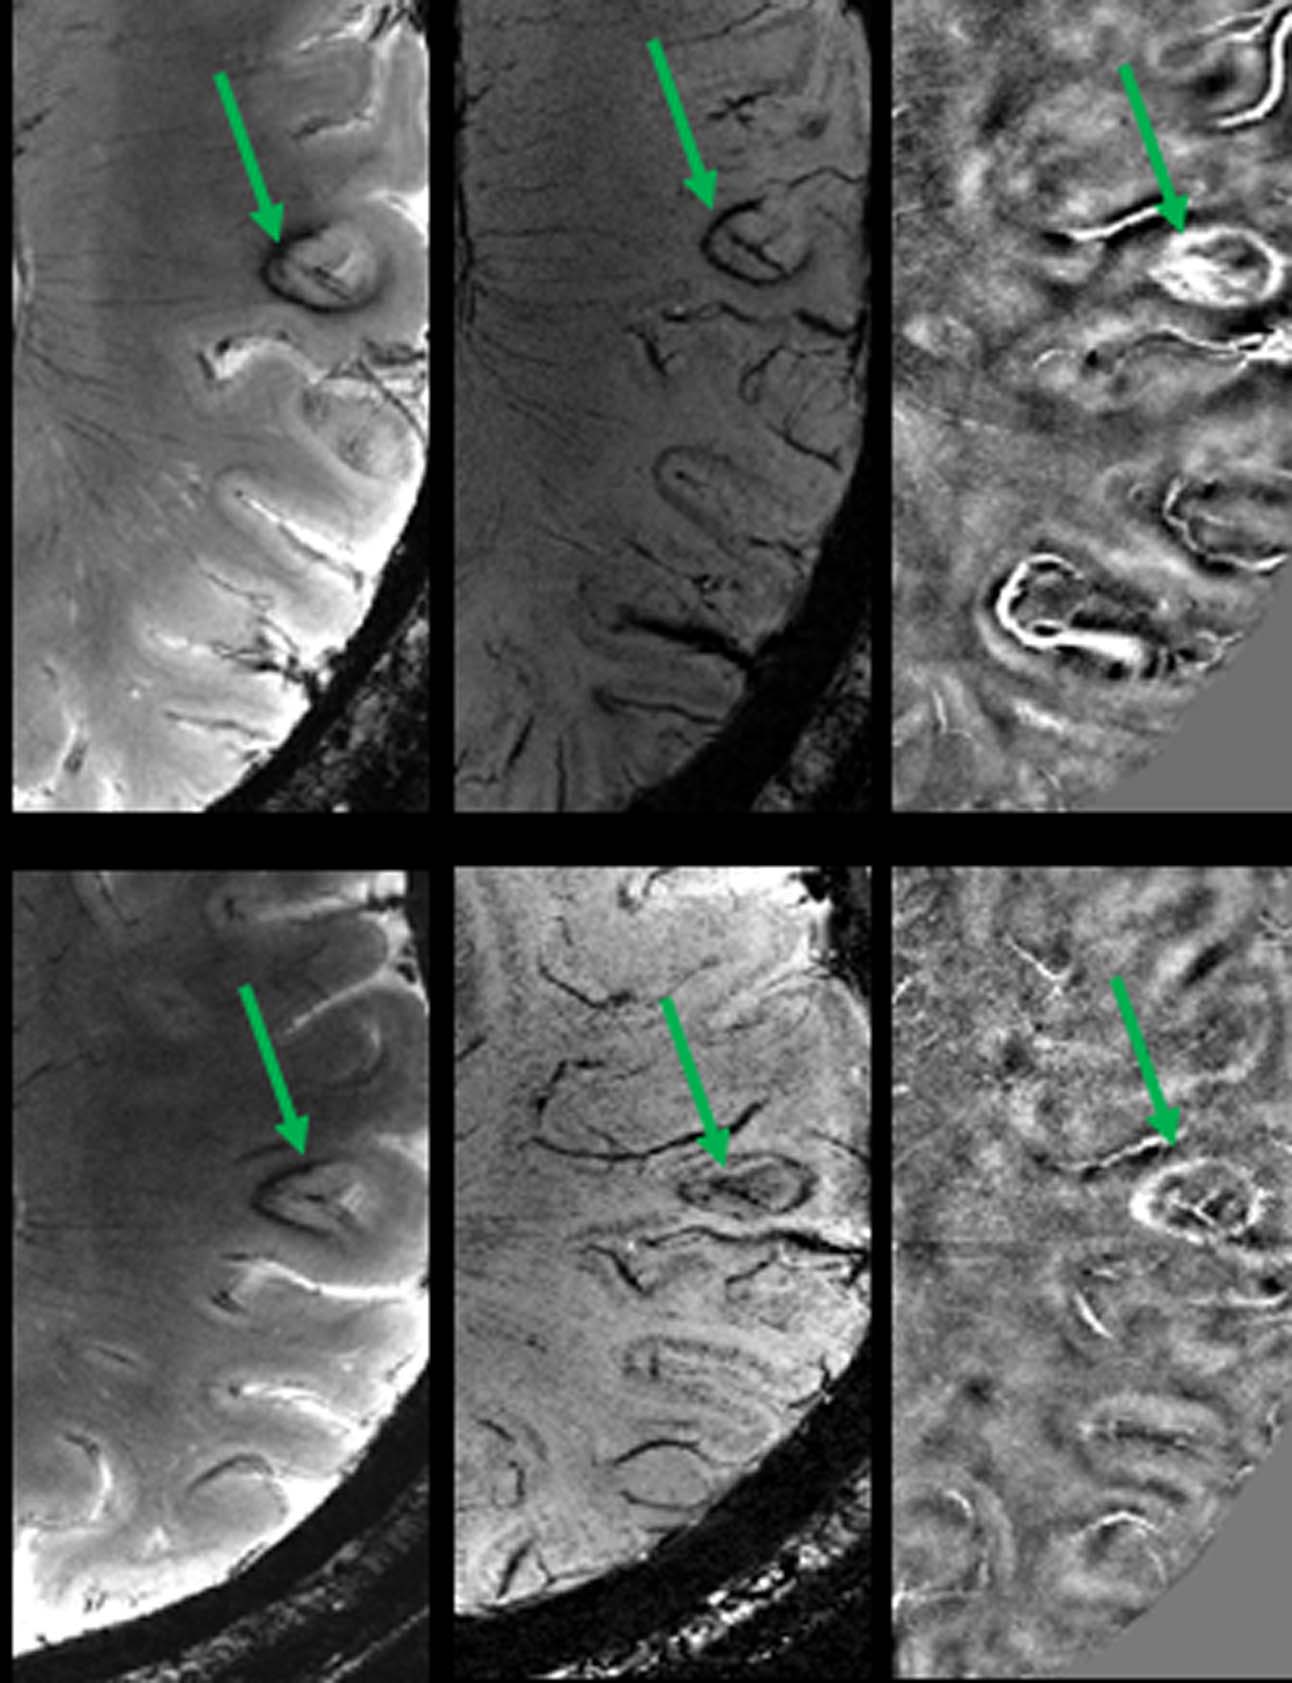
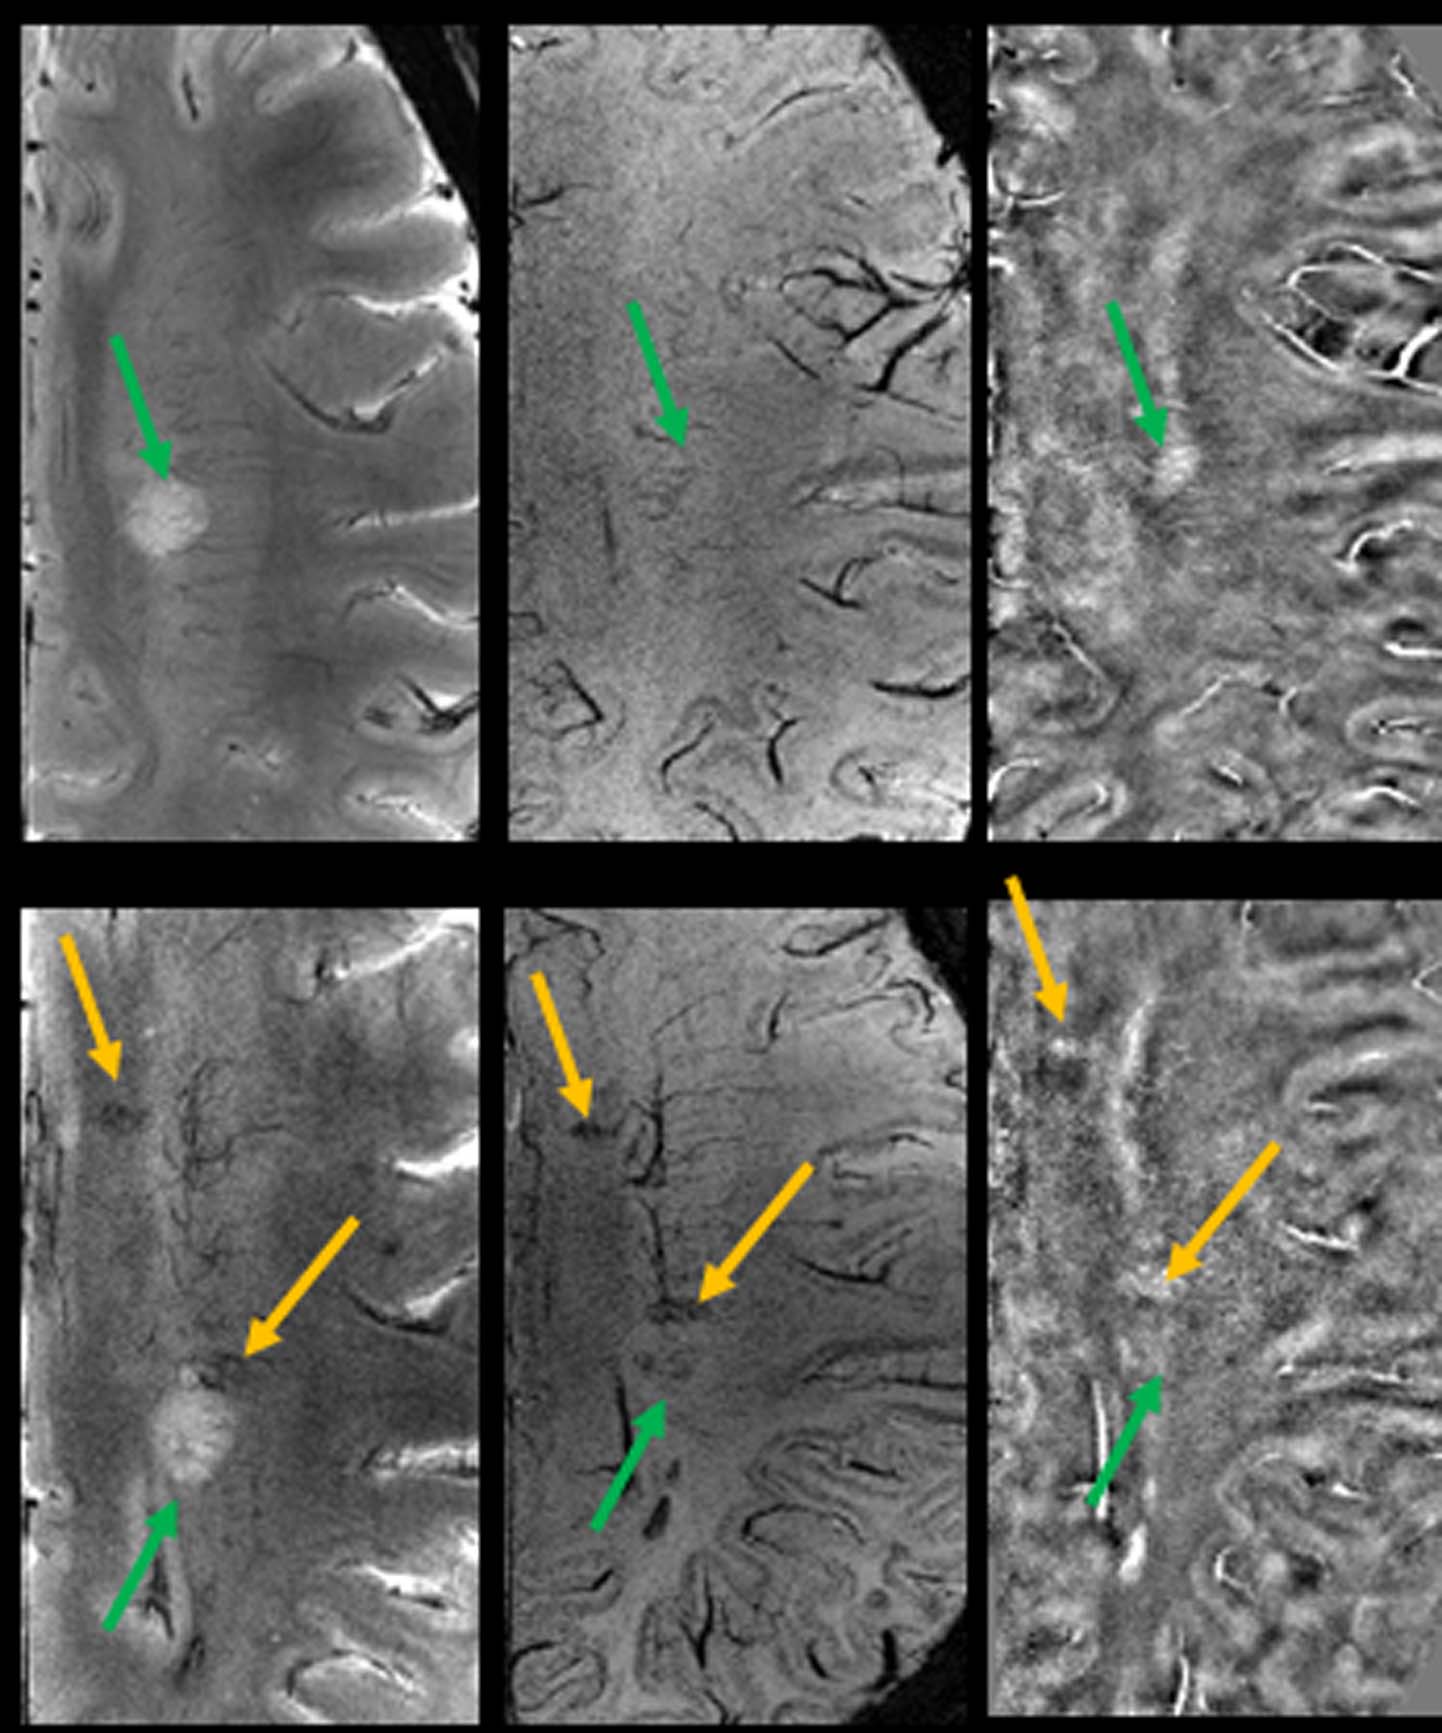
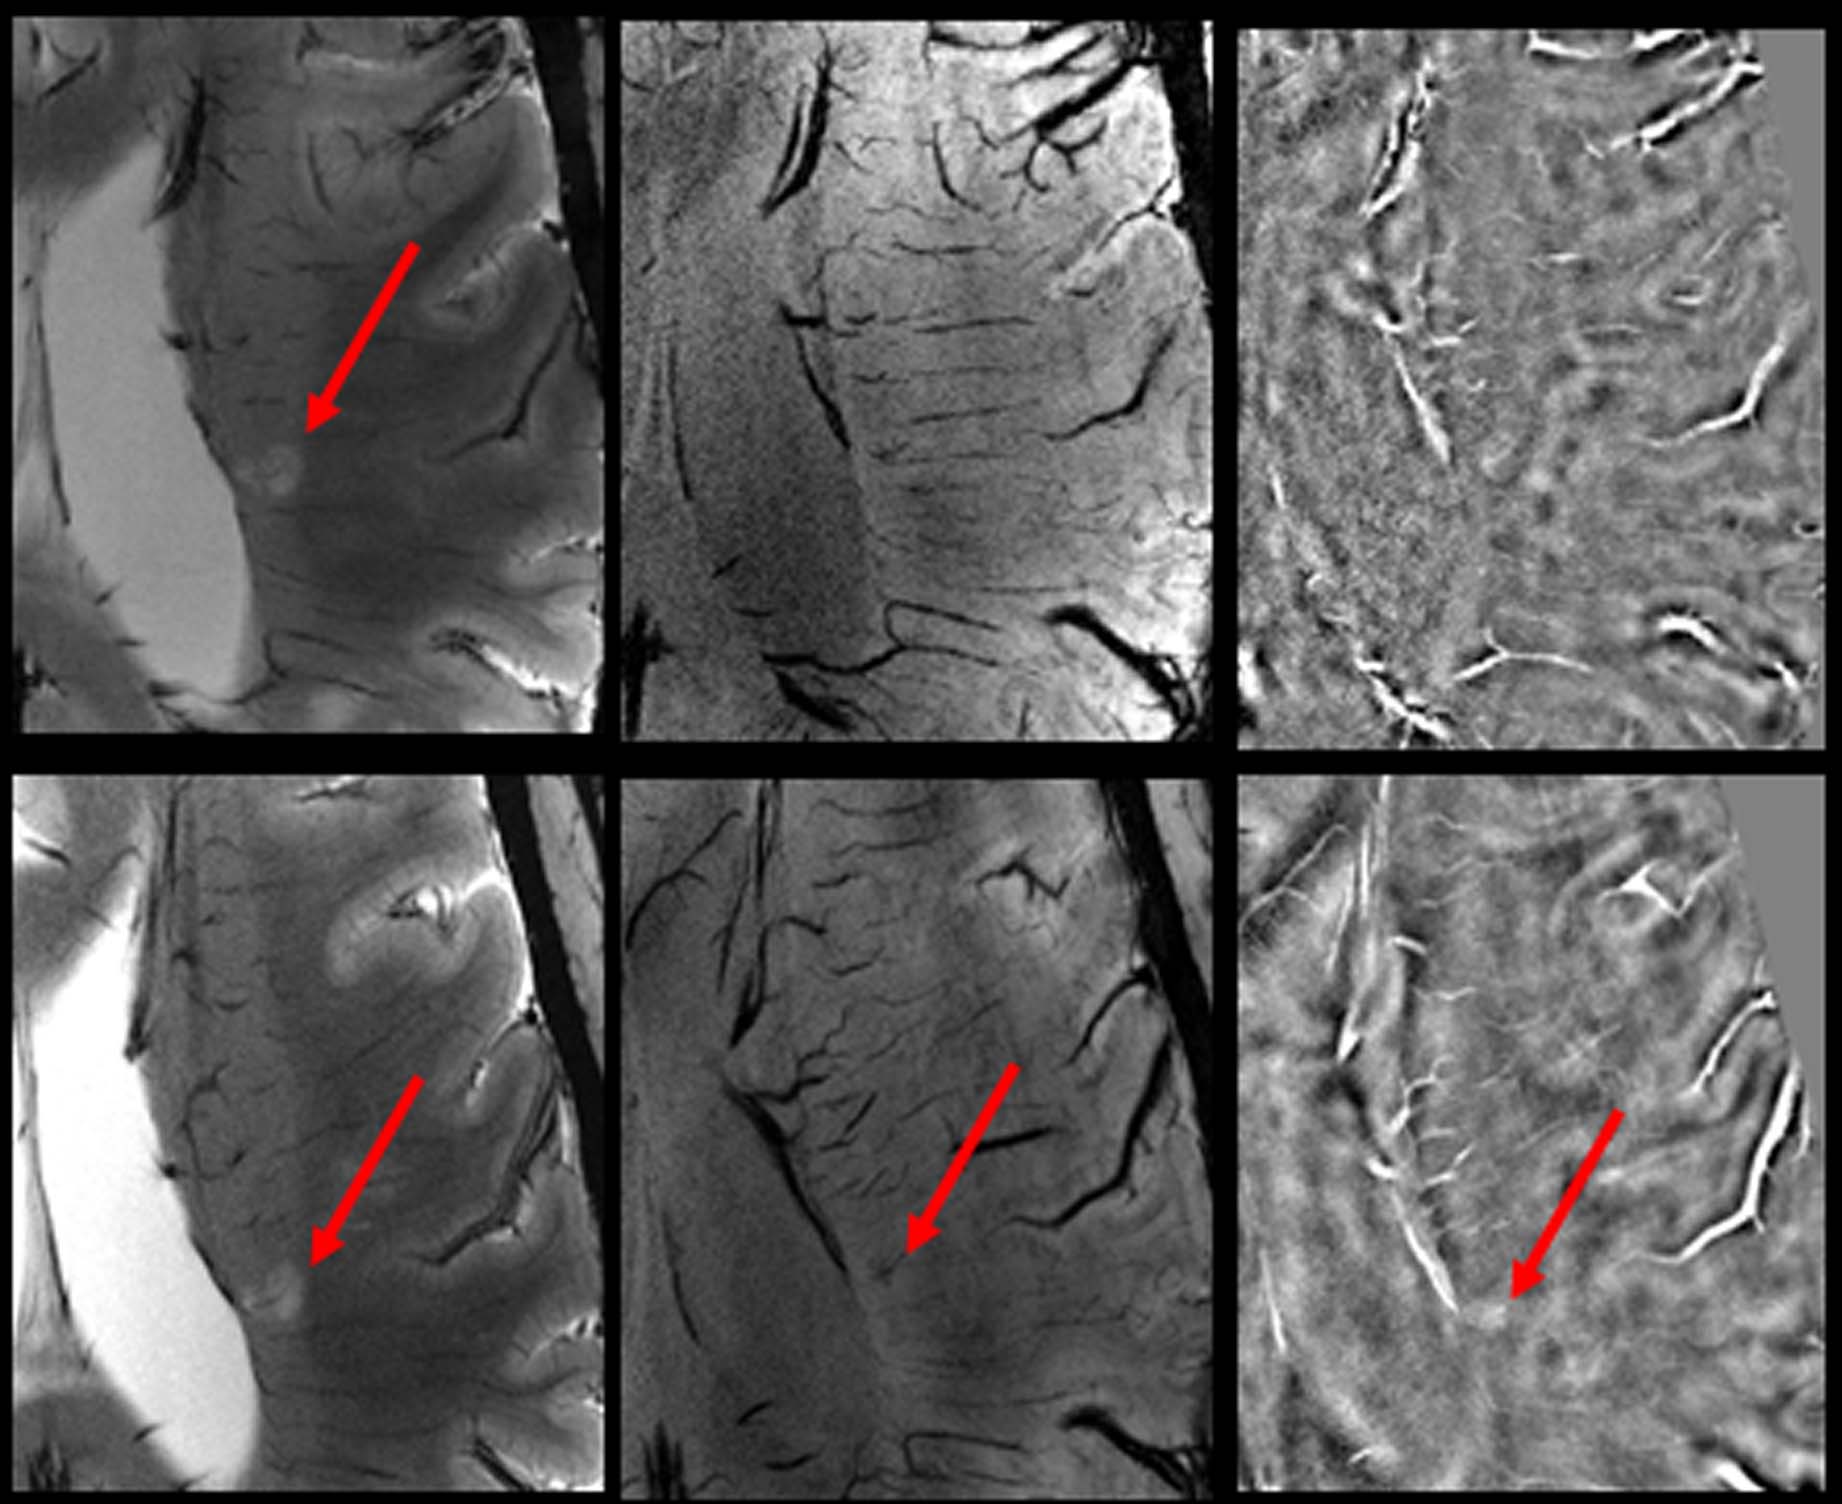
Lesion Count: A total of 204 lesions were observed at follow-up period, a miniscule (7%) increase of lesion number from baseline. Lesion-vessel relationship: Central venule within a lesion was observed in 129/139 (91%) lesions, which contained a venule at baseline (Fig. 2). Lesion Pattern: Of the 34 lesions that were iron-laden at baseline, all but one remained iron-laden at follow-up (Fig. 3). Pattern switch was observed in only 6 lesions (3%) from 3 patients. Of these 6 lesions, there was an apparent increase in iron content [pattern A (non-iron laden) to pattern C (iron laden)] in 3 lesions (Fig. 4). In one lesion, there was loss of iron content (pattern C to pattern A) and in other 2 lesions, there was redistribution of iron content from nodular to ring-like appearance (pattern C to pattern D). Interestingly, although only 33% of all follow-up lesions were iron-laden, 11/13 (85%) of new lesions, which were not seen at baseline, were of iron-laden (Fig. 5).
Discussion: A vast majority of lesions that were non-iron laden at baseline remained non-iron enriched on a follow-up period of ~2.4 years. Most of these lesions showed no obvious changes in radiological features such as intensity, size, and morphology through the course of the follow-up. We believe that these lesions were in chronic inactive stage of their evolution characterized by varying degrees of demyelination, edema, micronecrosis, and gliosis.6 It has been reported that not all MS lesions have iron deposition7 and not all macrophages or microglia contain iron,8 which indicates that iron deposition may vary among individual lesions based on their age and inflammatory status. Previous correlative MRI and histochemical studies8,9 have shown that iron deposits were present in a subset of chronic, demyelinating active MS lesions. In consistent with prior reports10 with shorter follow-up, most of iron leaden lesions at baseline exhibited iron content on follow-up in our study. Interestingly, most of new lesions were iron enriched. Rapid iron accumulation seems to be a hallmark of the MS lesion formation, which is different than the slow change of iron after lesion formation.11 A very recent study12 also demonstrated that MS lesions with iron rim grow very slowly.
Conclusion: Our longitudinal study provides insights into the morphological and iron related pathophysiological features of MS lesions during the course of disease evolution.
Acknowledgements
No acknowledgement found.References
1. Chawla S, Kister I, Wuerfel J, et al. Iron and non-iron-related characteristics of multiple sclerosis and neuromyelitis optica lesions at 7 T MRI. Am J Neuroradiol. 2016;37(7):1223-1230.
2. Hogarth P. Neurodegeneration with brain iron accumulation :diagnosis and management. J Mov Disord 2015;8:1-13.
3. Williams R, Buchheit CL, Berman NE, et al. Pathogenic implications of iron accumulation in multiple sclerosis. J Neurochem 2012;120: 7-25.
4. Haacke EM, Tang J, Neelavalli J, et al. Susceptibility mapping as a means to visualize veins and quantify oxygen saturation. J Magn Reson Imaging 2010;32:663-676.
5. Liu S, Neelavalli J, Cheng YC, et al. Quantitative susceptibility mapping of small objects using volume constraints. Magn Reson Med 2013;69:716-723.
6. Li X, Harrison DM, Liu H, et al. Magnetic susceptibility contrast variations in multiple sclerosis lesions.J Magn Reson Imaging 2016; 43:463-473.
7. Yao B, Bagnato F, Matsuura E, et al. Chronic multiple sclerosis lesions: characterization with high-field-strength MR imaging. Radiology 2012;262(1):206-215.
8. Bagnato F, Hametner S, Yao B, et al. Tracking iron in multiple sclerosis:a combined imaging and histopathological study at 7Tesla. Brain 2011;134:3602-3615.
9. Mehta V, Pei W, Yang G, et al. Iron is a sensitive biomarker for inflammation in multiple sclerosis lesions.PLoS One 2013;8:e57573.
10. Bian W, Harter K, Hammond-Rosenbluth KE, et al. A serial in vivo 7T magnetic resonance phase imaging study of white matter lesions in multiple sclerosis. Mult Scler. 2013;19(1):69-75.
11. Chen W, Gauthier SA, Gupta A, et al. Quantitative susceptibility mapping of multiple sclerosis lesions at various ages. Radiology 2014;271:183-192.
12. Assunta DB, Günther G, Claudia K, et al. Slow expansion of multiple sclerosis iron rim lesions: pathology and 7 T magnetic resonance imaging. Acta Neuropathol. 2016 Oct 27.
Figures