4045
High Resolution Steady State Diffusion and Magnetization Transfer Imaging of the Spinal Cord1Radiology, Radiological Physics, University Hospital Basel, Basel, Switzerland, 2Dept. of Biomedical Engineering, University of Basel, Basel, Switzerland
Synopsis
The potential of high resolution steady state diffusion and magnetization transfer (MT) imaging approaches with short acquisition times of less than 2min were investigated for the depiction of the spinal cord. As a surprising result, diffusion weighted time-reversed fast imaging with steady state precession (PSIF) sequences are not able to generate notable diffusion based contrast in the spinal cord (identical diffusion quotient DQ = 1.96+-0.20). High resolution balanced steady state free precession (bSSFP) sequences, however, are able to depict MT induced signal saturation in spinal cord white matter (MT ratio = 0.30+-0.07).
Purpose
Noteworthy progress in spinal cord (SC) imaging methods has been made in recent years, addressing the typical SC imaging challenges such as motion and cerebrospinal fluid (CSF) pulsation 1-3. Nevertheless, the relatively faint T1 and T2 contrast between gray matter (GM) and white matter (WM) remains challenging 1-3. Although magnetization transfer and diffusion imaging has shown good prospects for the differentiation of GM and WM in the brain, especially SSFP-based diffusion and magnetization transfer (MT) techniques have been marginally explored for SC imaging 1-2. To this end, SSFP-based diffusion and MT imaging is explored as a possible GM and WM SC contrast originator, combining challenging acquisition times of less than 2min per slice with high resolution imaging.Methods
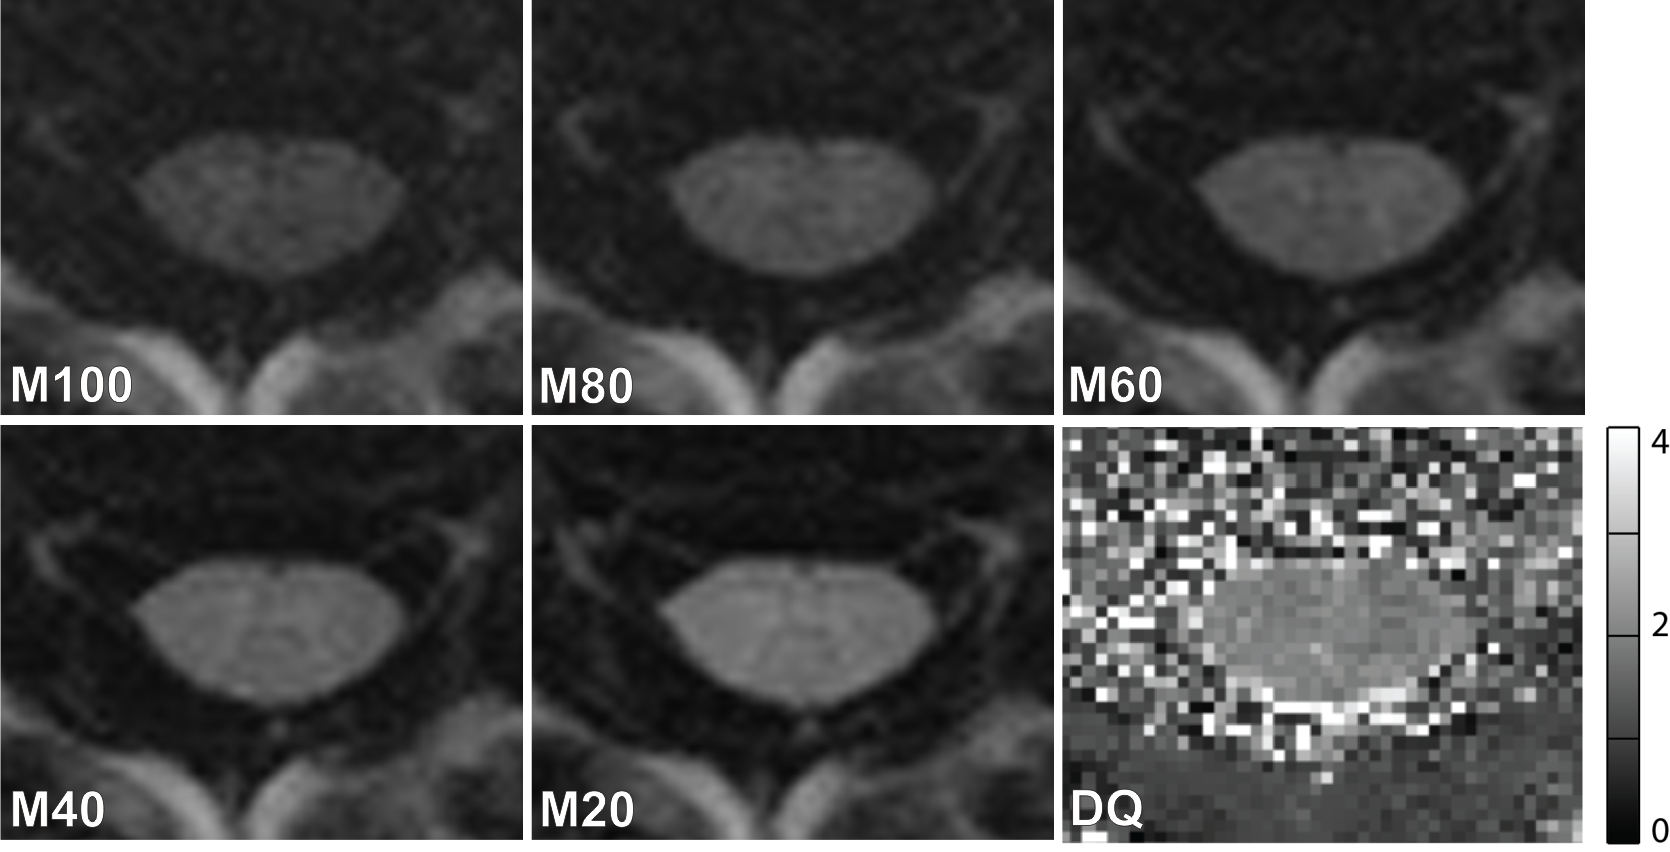
High resolution diffusion-sensitized imaging was based on a 2D time-reversed fast imaging with steady state precession (PSIF) sequence, using an additional monopolar diffusion encoding gradient in the slice direction, for which, due to the anisotropic structure of WM, the strongest effects of diffusion weighting (DW) are expected. Different diffusion gradient moments of MDW = [100, 80, 60, 40, 20] mT*ms/m were applied. The general PSIF parameters were: TR=9.82ms, TE=3.23ms, bandwidth=449Hz/px, flip angle=20deg, matrix=192x192, 20% phase oversampling, FOV=128x128mm2, in-plane resolution=0.67x0.67mm2, slice thickness=8mm, flow compensation in read direction, signal averages=32. The total acquisition time was TA=40s.
Finally, similar to Ref.4, a semi-quantitative diffusion quotient (DQ) map was defined as DQ := M20/M80. The SNR of M100 was a bit too low for doing this.
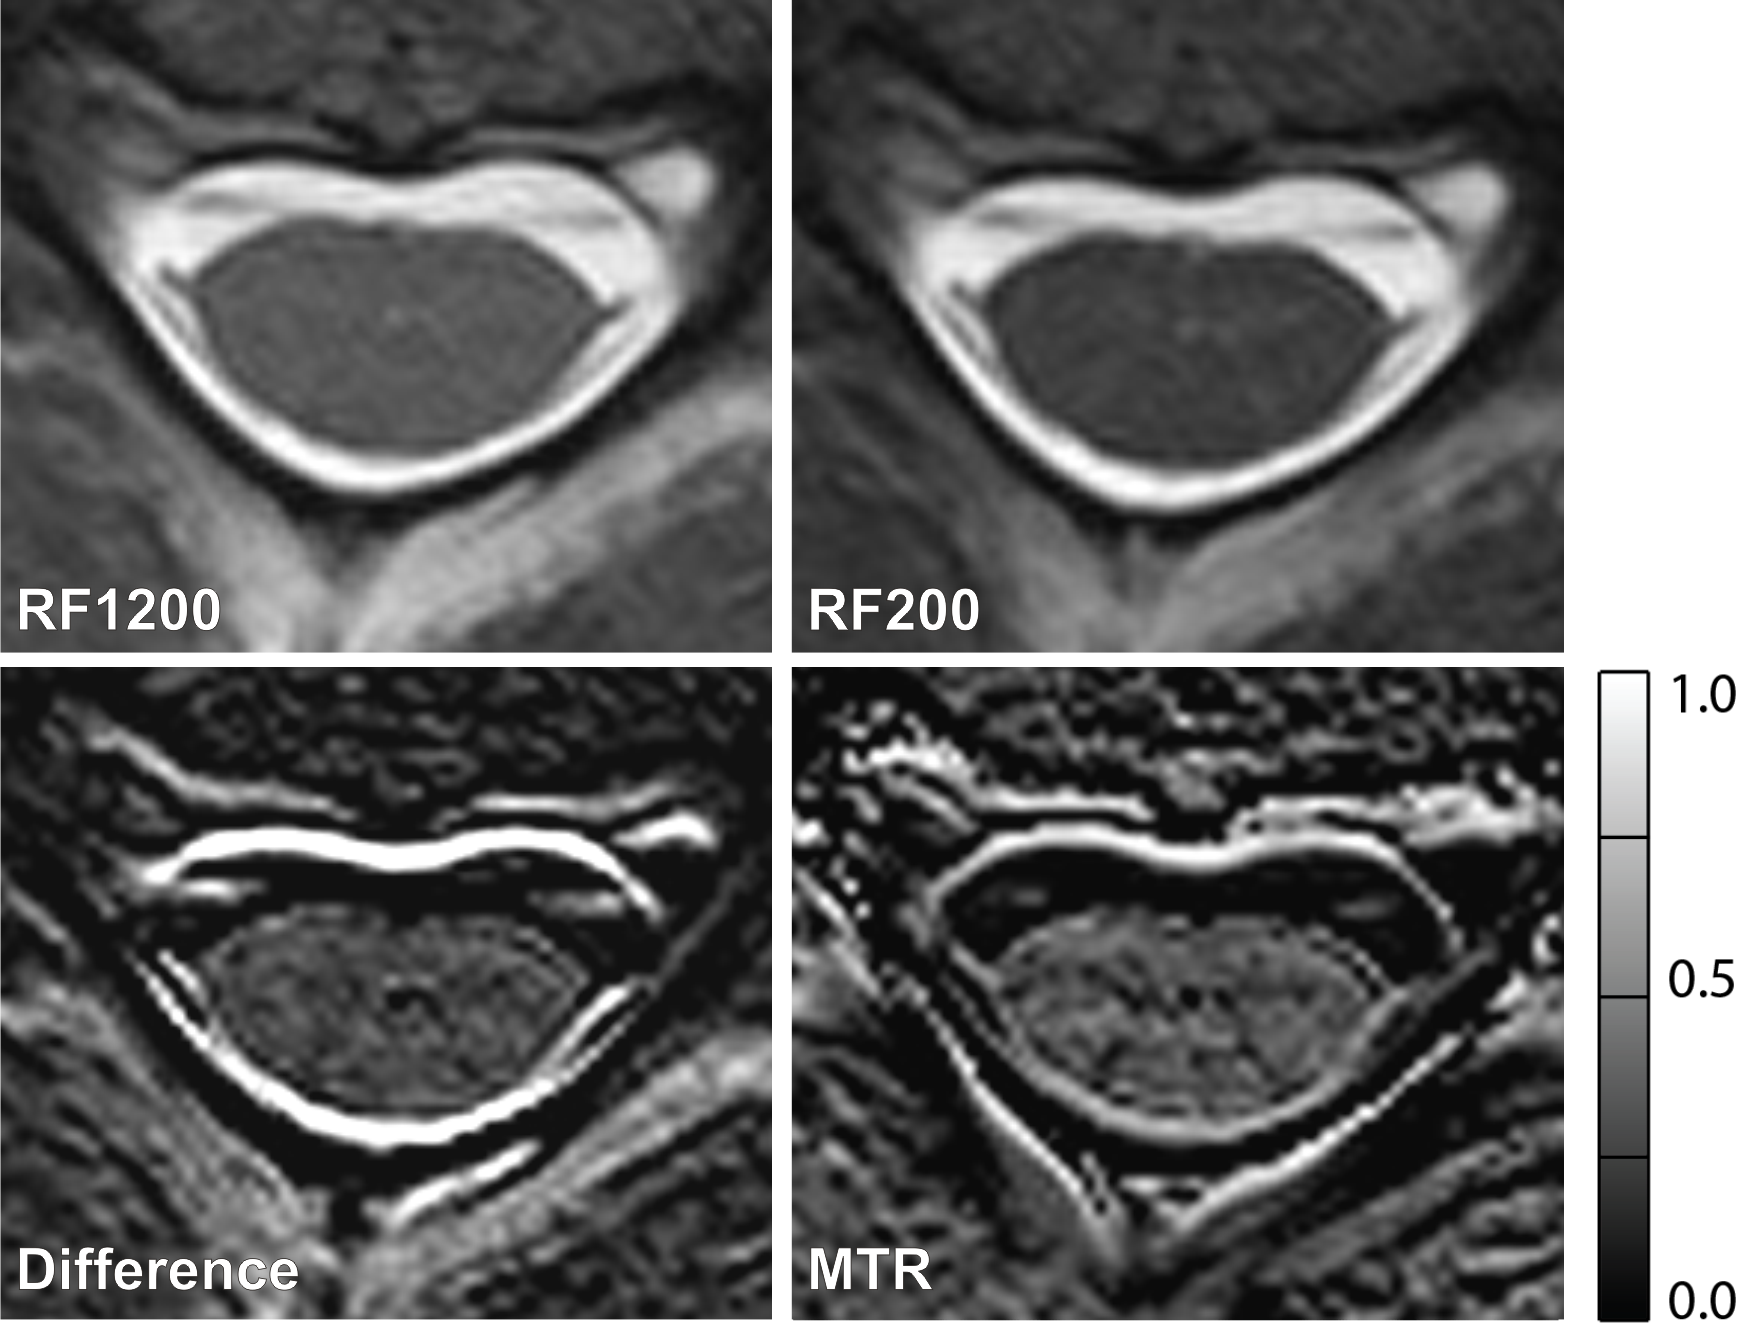
For high resolution MT imaging, a 3D balanced SSFP (3D-bSSFP) sequence was modified for optimized MT imaging of the SC. Similar to the 2D-bSFFP approach presented by Bieri and Scheffler 5, two comparative 3D-bSSFP measurements with a very short (τRF-MT=200μs) and a notably long RF excitation pulse (τRF-M0=1200μs) were performed (RF time-bandwidth-product=3.0). The former acquisition induces a strong MT weighting due to the significant RF power. Its minimal RF pulse duration τRF-MT was set by specific absorption rate (SAR) and transmitter B1+ amplitude restrictions. Since the longer RF pulse duration increases the bSSFP’s TR, which has a direct influence on the resulting off-resonance behavior, this effect was partially compensated by a longer bandwidthMT=531Hz/px for the MT weighted acquisition compared to a bandwidthM0=401Hz/px. This procedure resulted in the sequence timings of TRMT=4.75ms and TEMT=1.84ms as well as TRM0=5.38ms and TEM0=2.22ms. The other MR parameters were identical: flip angle=25deg, FOV=128x128mm2, matrix=304x304, 100% phase oversampling, in-plane resolution=0.42x0.42mm2, slice thickness=3mm, 8 slices in one slab, 100% slice oversampling, signal averages=3. The total acquisition times were TAMT=1:31min and TAM0=1:43min.
Similar to Ref.5 a MT ratio (MTR) map was defined as MTR := (SIM0-SIMT)/SIM0.
All diffusion and MT measurements were performed at the vertebrae C5, orientated orthogonal to the course of the spinal cord. A 3T whole-body MR system with a 64-channel phased array head and neck coil was used.
Results
Figure 1 illustrates the acquired series of DW-PSIF images. Only a combined mean DQGWM=1.96+-0.20 could be quantified.
Figure 2 depicts the investigation of MT effects. Based on the calculated MTR map, a MTRWM=0.30+-0.07 could be determined. MTRGM was close to 0.
Discussion and Conclusion
Steady state sequences allow fast and high-resolution MT and diffusion imaging and are also sensitive to the anisotropy in diffusion, as was successfully demonstrated in the brain and cartilage 4-6. Therefore, adapting such approaches to SC imaging seemed to be a good advice and investigating their performance almost compulsory. Thus, it comes of a surprise that the PSIF generated DW contrast between GM and WM is practically negligible (Fig.1). Yet indeed, the DW-PSIF is capable of introducing appreciable DW in the images, as is demonstrated by the notable CSF signal attenuation around the SC. Furthermore, decreasing signal intensities with increasing diffusion gradient moment are observed (Fig.1). The (it is to consider) semi-quantitative diffusion quotient DQ does not reveal any notable difference, hence, only a combined DQGWM=1.96+-0.20 can be given.
A more promising result is found for MT imaging (Fig.2). The MTR map does show a difference between GM and WM with MTRWM=0.30+-0.07 and MTRGM~0. The characteristic “butterfly” can be resolved in the MTR map, which is also due to the fact of the chosen high resolution MT approach (0.4mm x 0.4mm x 3mm).
To conclude, particularly the diffusion approach underlines the fact that, although the SC generally consists of GM and WM, their biophysical MR properties partially may considerably differ from the corresponding properties of human brain GM and WM. A similar finding of divergence has already been noted for T1 relaxation times by Weigel and Bieri last year 7.
Acknowledgements
This work was funded by the Swiss National Science Foundation (SNF), grant number 320030_156860.References
1. Wheeler-Kingshott CA, Stroman PW, Schwab JM et al. The current state-of-the-art of spinal cord imaging: Applications. Neuroimage 2014;84:1082-1093.
2. Stroman PW, Wheeler-Kingshott C, Bacon M et al. The current state-of-the-art of spinal cord imaging: Methods. Neuroimage 2014;84:1070-1081.
3. Papinutto N, Schlaeger R, Panara V et al. 2D phase-sensitive inversion recovery imaging to measure in vivo spinal cord gray and white matter areas in clinically feasible acquisition times. J Magn Reson Imaging 2015;42:698-708.
4. Mamisch TC, Menzel MI, Welsch GH et al. Steady-state diffusion imaging for MR in-vivo evaluation of reparative cartilage after matrix-associated autologous chondrocyte transplantation at 3 tesla -preliminary results. Eur J Radiol 2008;65:72-9.
5. Bieri O, Scheffler K. Optimized balanced steady-state free precession magnetization transfer imaging. Magn Reson Med 2007;58:511-8.
6. McNab JA, Miller KL. Sensitivity of diffusion weighted steady state free precession to anisotropic diffusion. Magn Reson Med 2008;60:405-13
7. Weigel M, Bieri O. Towards Tissue Characterization of the Spinal Cord: High-Resolution T1 Relaxometry with Precise B1+-Mapping of the Spinal Cord at 3T. In: Proceedings Annual Meeting ISMRM 2016, Singapore, p. 4411.
Figures