4043
Impact of Magnetic Susceptibility Anisotropy at 3 T and 7 T on T2*-based Myelin Water Fraction Imaging1McGill University, Montreal, QC, Canada, 2Research Institute, McGill University Health Centre, Montreal, QC, Canada, 3University of Calgary, Calgary, AB, Canada
Synopsis
In this
Purpose
Myelin Water Fraction (MWF) mapping based on multi-gradient recalled echo (MGRE) imaging 1-3 can be achieved though regularized non-negative least squares (rNNLS) fitting of a T2* distribution 3 or 3-component fitting 4, 5, where the 3 components are assumed to be: myelin water (MW), extra-cellular water (EW) and axon water (AW). Recent work has indicated that a 3-component model with additional free parameters, corresponding to frequency offsets ($$$\delta f$$$) for the water components, may lead to improved multicomponent fitting 6 and more stable MWF estimates 7. The $$$\delta f$$$’s appear to depend on both B0 and the orientation of white matter (WM) fiber bundles relative to B0 ($$$\theta$$$). In this work, we assessed the impact of orientation-dependent $$$\delta f$$$’s on the MWF derived from multicomponent analysis of simulated T2* data at 3T and 7T.Methods
Multicomponent T2* decay was simulated for WM at 3T and 7T. T2* components were generated for MW (12%), EW (38%), and AW (50%), with relaxation times at 3T equal
1. MCMT2*: rNNLS multi-component fitting of a T2* distribution to the signal magnitude, with a 25 ms cutoff time for MW.
2. 3CMT2*: 3-component T2* fitting to the signal magnitude:
$$ s=A_{MW}e^{-t(1/T^*_{2,MW})}+A_{EW}e^{-t(1/T^*_{2,EW})}+A_{AW}e^{-t(1/T^*_{2,AW})} $$
3. 3CCT2*: 3-component T2* fitting with $$$\delta f$$$ terms to the complex T2* signals:
$$ s=A_{MW}e^{-t(1/T^*_{2,MW}+i2\pi \delta f_{MW})}+A_{EW}e^{-t(1/T^*_{2,EW})}+A_{AW}e^{-t(1/T^*_{2,AW}+i2\pi\delta f_{AW})} $$
The HCFM model predicts $$$\delta f_{EW}$$$ = 0, therefore it was assumed to be zero. The MWF (defined as the ratio of MW to total water) and fit residuals obtained using the three different methods were compared and the stability of the fits with respect to SNR was evaluated.
Results
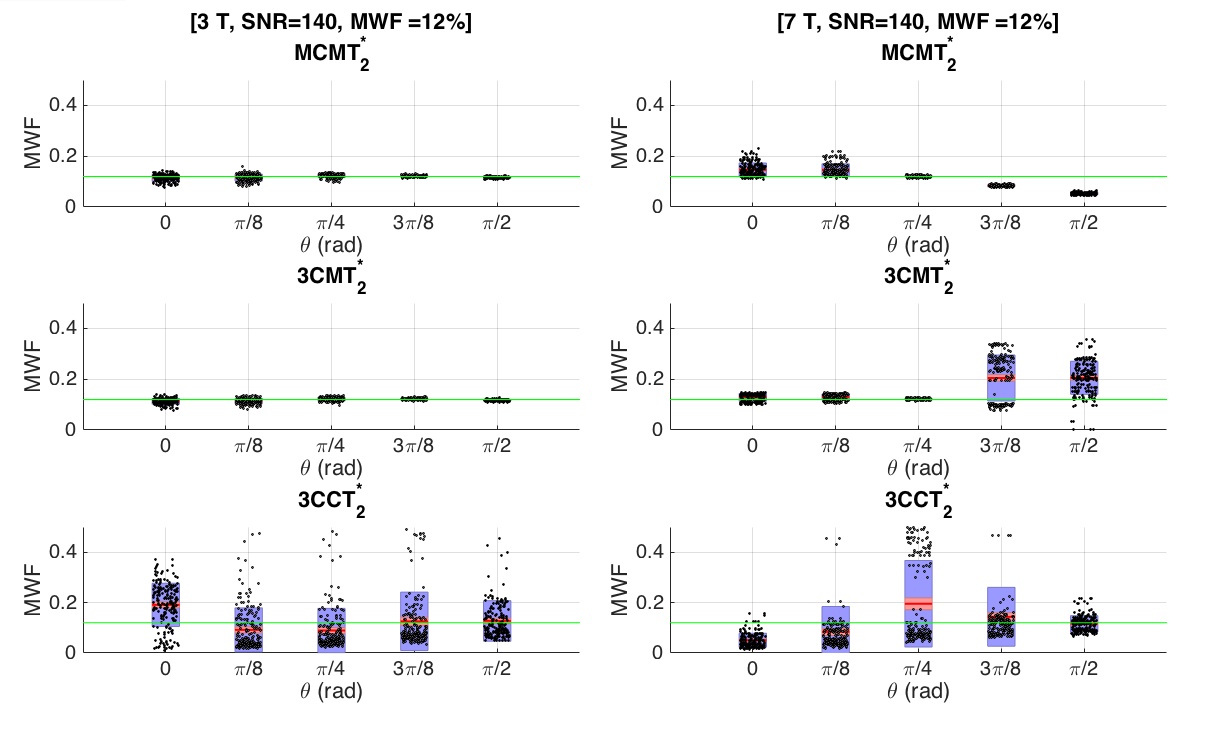
At 3T, both MCMT2* and 3CMT2* led to accurate MWF values, independent of $$$\theta$$$. When considering all simulations (200 repetitions x 5 angles = 1000 simulations) with SNR = 140 and true MWF = 12%, the mean MWF (± standard deviation (std)) was (11.8 ± 1.0)% and (11.7 ± 0.9)% for MCMT2* and 3CMT2*, respectively. 3CCT2* led to increased variability in the MWF ((12.5 ± 9.9)% across all 1000 simulations). At 7T, the accuracy of the MWF obtained from MCMT2* and 3CMT2* decreased for $$$\theta > \pi/4$$$: (14.7 ± 2.6)% for MCMT2* and (12.8 ± 1.5)% for 3CMT2* when $$$\theta = 0$$$, vs. (5.3 ± 0.5)% for MCMT2* and (20.5 ± 6.5)% for 3CMT2* when $$$\theta = \pi/2$$$. Although 3CCT2* increased the accuracy of the MWF when $$$\theta > \pi/4$$$: (11.6 ± 3.3)% (when $$$\theta = \pi/2$$$), this came at the expense of accuracy in the MWF when $$$\theta = 0$$$ (5.1 ± 2.7)% (Figure 1). These observations were consistent across the SNR rangeDiscussion and Conclusions
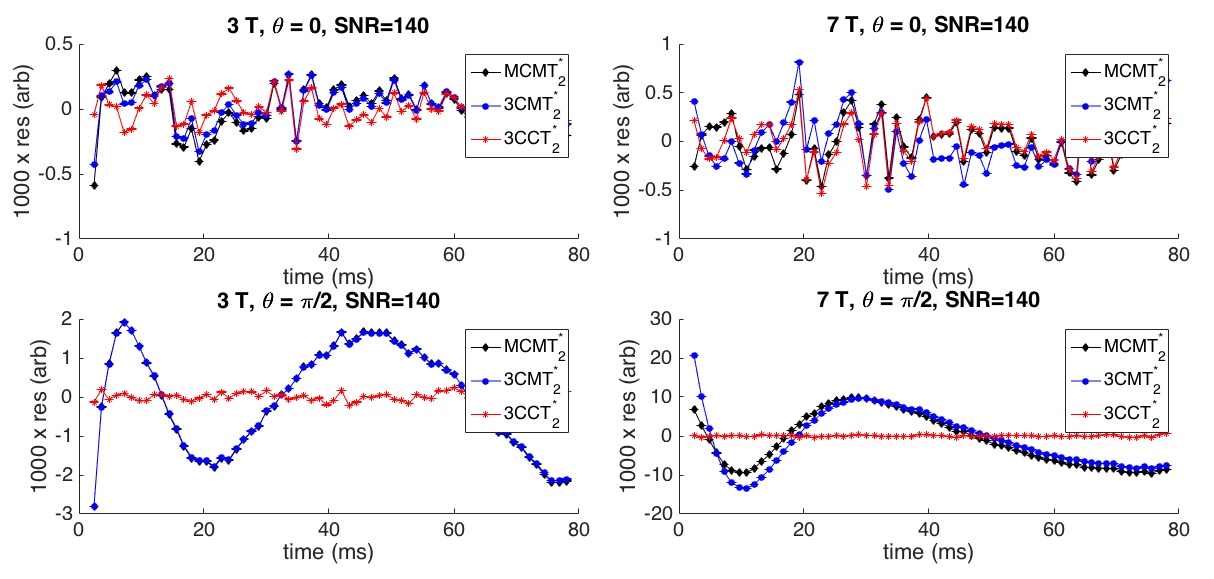
While the examination of fit residuals indicated that inclusion of $$$\delta f$$$ terms in the fittingAcknowledgements
This study was supported by the Fonds de recherche du Québec – Nature et technologies (FRQNT), Graduate Scholarship to Eva Alonso Ortiz, the CREATE Medical Physics Research Training Network grant of the Natural Sciences and Engineering Research Council (NSERC, Grant number 432290), the Canadian Institutes for Health Research (CIHR, Funding Reference Number 43871), and the Natural Sciences and Engineering Research Council (NSERC Discovery, Grant number 170426).References
1. Du, Y., et al., Fast multislice mapping of the myelin water fraction using multicompartment analysis of T2* decay at 3T: a preliminary postmortem study. Magnetic resonance in medicine, 2007. 58(5): p. 865-870.
2. Hwang, D., D.-H. Kim, and Y. Du, In
3. Lenz, C., M. Klarhöfer, and K. Scheffler, Feasibility of in vivo myelin water imaging using 3D multigradient-echo pulse sequences. Magnetic resonance in medicine, 2012. 68(2): p. 523-528.
4. Andrews, T., et al., Testing the three-pool white matter model adapted for use with T2 relaxometry. Magnetic resonance in medicine, 2005. 54(2): p. 449-454.
5. Lancaster, J., et al., Three-pool model of white matter. Journal of magnetic resonance imaging : JMRI, 2003. 17(1): p. 1-10.
6. van Gelderen, P., et al., Nonexponential T(2) decay in white matter. Magn Reson Med, 2012. 67(1): p. 110-7.
7. Nam, Y., et al., Improved estimation of myelin water fraction using
8. Sati, P., et al., Micro-compartment specific T2* relaxation in the brain. Neuroimage, 2013. 77: p. 268-78.
9. Wharton, S. and R. Bowtell, Fiber orientation-dependent white matter contrast in gradient echo MRI. Proc Natl Acad Sci U S A, 2012. 109(45): p. 18559-64.
Figures