4040
Tissue Relaxometry Defined (TRD) pseudo-CT imaging based on a single multi-gradient-echo MRI scan1Radiology, Washington University in St. Louis, St. Louis, MO, United States, 2Radiation Oncology, Washington University in St. Louis, St. Louis, MO, United States
Synopsis
Generating MRI-based pseudo-CT images, providing electron density information for dose calculation, is the first step towards MRI-based radiation therapy treatment planning. Existing methods either require prior knowledge of a CT-MR atlas or require acquisition of multiple scans. In this study, we demonstrated the feasibility of producing pseudo-CT images by using a single multi-gradient-echo sequence. This method takes advantage of tissue-specific relaxation properties of MRI signal to provided segmentation of bone, air and other anatomical structures. Since all images are generated from a single scan and are naturally co-registered, this method is fast and avoids registration errors.
Purpose
To develop a tissue-relaxometry-defined (TRD) method producing robust pseudo-CT images from a single multi-gradient-echo MRI sequence as a first step toward MRI-based radiation therapy treatment planning for brain cancer.Methods
This study was approved by local IRB and the subject provided informed consent. All MRI scans were collected using a 1.5T scanner (Ingenia, Philips Medical System) equipped with a 15-channel phased-array head coil. High resolution Gradient Echo Plural Contrast Imaging (GEPCI)1,2 datasets with a voxel size of $$$1\times1\times3mm^{3}$$$ were acquired using a 3D multi-gradient-echo sequence with a flip angle of $$$30^\circ$$$, $$$TR=50ms$$$ and total acquisition time of 7min. For each acquisition, 11 echoes were collected with $$$TE1=4ms$$$ and $$$\Delta TE=4ms$$$. Signals from different channels were combined for each voxel:
$$S(TE)=\frac{1}{M}\sum_{m=1}^M\lambda_{m}\overline{S}(TE_{1})S_{m}(TE_{n})$$
$$\lambda_{m}=\frac{1}{M}\sum_{l=1}^{M}\frac{\sigma_{l}^{2}}{\sigma_{m}^{2}}$$
where the sum is taken over all channels (m), $$$\overline S$$$ denotes complex conjugate of S, $$$\lambda_{m}$$$ are weighting parameters and $$$\sigma_{m}$$$ are noise amplitudes (r.m.s.). We omit index corresponding to voxel position for clarity. This algorithm allows for the optimal estimation of quantitative parameters, such as magnetic resonance signal magnitude, decay rate constant and frequency and also removes the initial phase incoherence between channels2. R2* constants were obtained by fitting the channel-combined data on a voxel-by-voxel basis:
$$S(TE)=S_{0}^{2}\cdot e^{-R_{2}^{*}\cdot (TE+TE_{1})}\cdot e^{i\cdot\omega\cdot(TE-TE_{1})}\cdot F(TE)$$
where $$$\omega$$$ is a local signal frequency and F(TE) is the F-function describing the influence of macroscopic magnetic field inhomogeneity effects on MRI signal. Herein, we use a voxel spread function algorithm3 for evaluation of F-function.
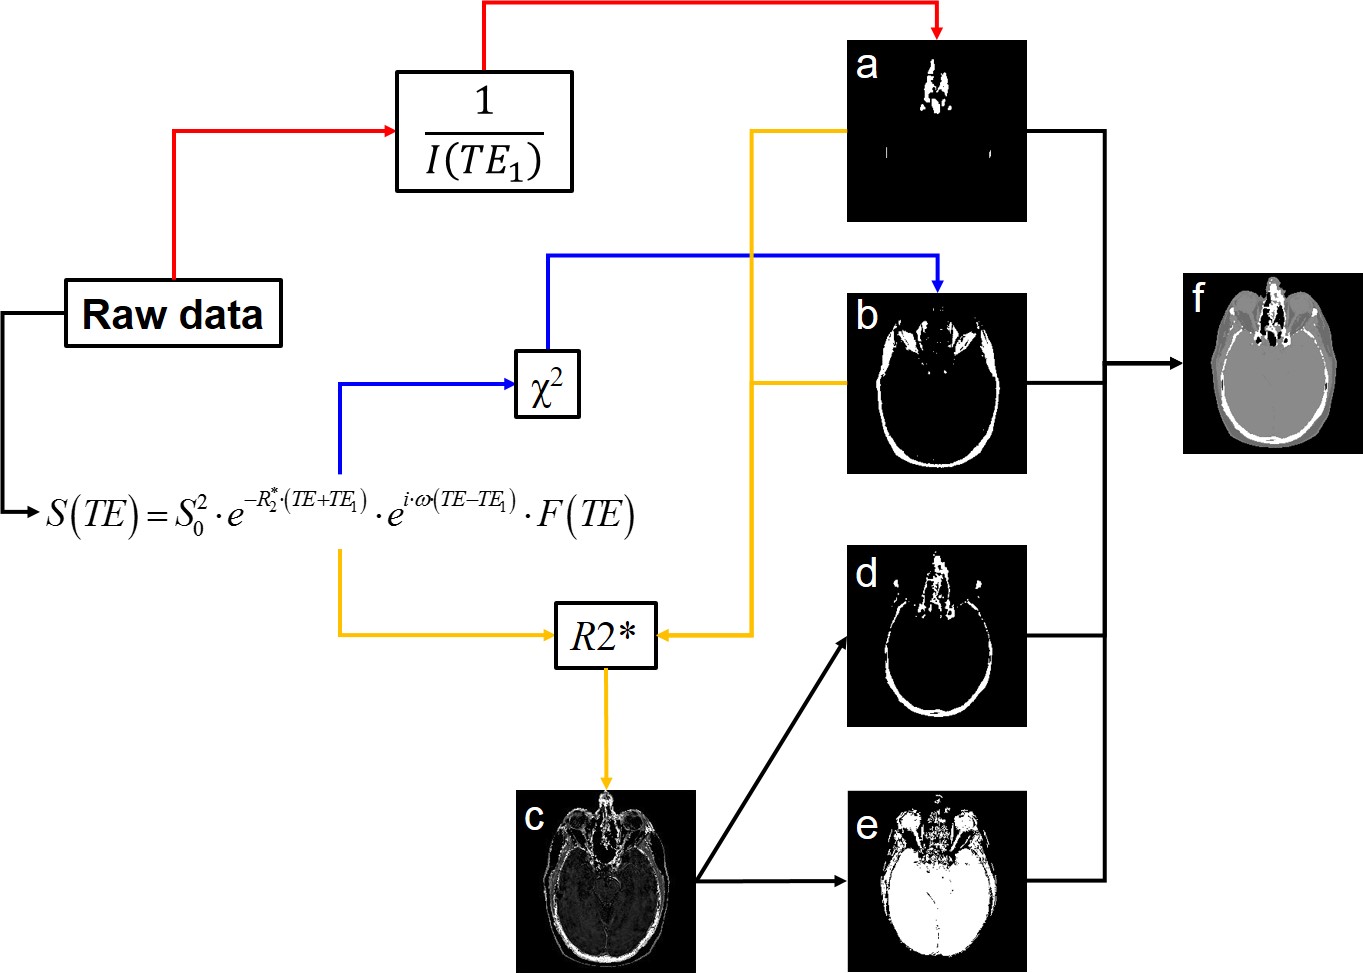
TRD-CT images were created as described in Fig.1. Magnitude images of the first echo ($$$I(TE_{1})$$$) were inverted ($$$1/I(TE_{1})$$$) to create positive enhanced contrasts of the “air” regions and to produce an “air” mask. Due to complex TE-dependent behavior of the MRI signal in fat-rich regions, the $$$\chi^{2}$$$ error of fitting the mono-exponential model to experimental data is much larger than in all other areas. The $$$\chi^{2}$$$ map was used to create a “fat” mask. R2* from the mono-exponential fitting using first 3 echoes was used to define “soft-tissue” as regions with low R2* values ($$$\leq50s^{-1}$$$). By applying air-, fat- and soft-tissue-mask to R2* map, the “bone” areas were highlighted and a “bone” mask was created. Different anatomical structures were assigned a single Hounsfield units value (-1000$$$\rightarrow$$$air, -75$$$\rightarrow$$$fat, 40$$$\rightarrow$$$soft tissue and 1000$$$\rightarrow$$$bone) to create a pseudo-CT.
Brain CT was acquired using a CT Simulator (Brilliance, Philips Medical System,) with 120kVp, 500mAs, $$$512\times 512$$$ in-plane dimensions, $$$0.88\times 0.88mm^{2}$$$ in-plane spatial resolution and 1.5mm slice thickness. The accuracy of bone segmentation from TRD-CT was determined by calculating the Sorensen-Dice coefficient:
$$C=\frac{2\cdot|TRD_{CT}\bigcap CT|}{|TRD_{CT}|+|CT|}$$
Voxels in CT that had numbers bigger than 500 HU were classified as bone areas. Voxels that had values smaller than -500 HU were classified as air.
Results
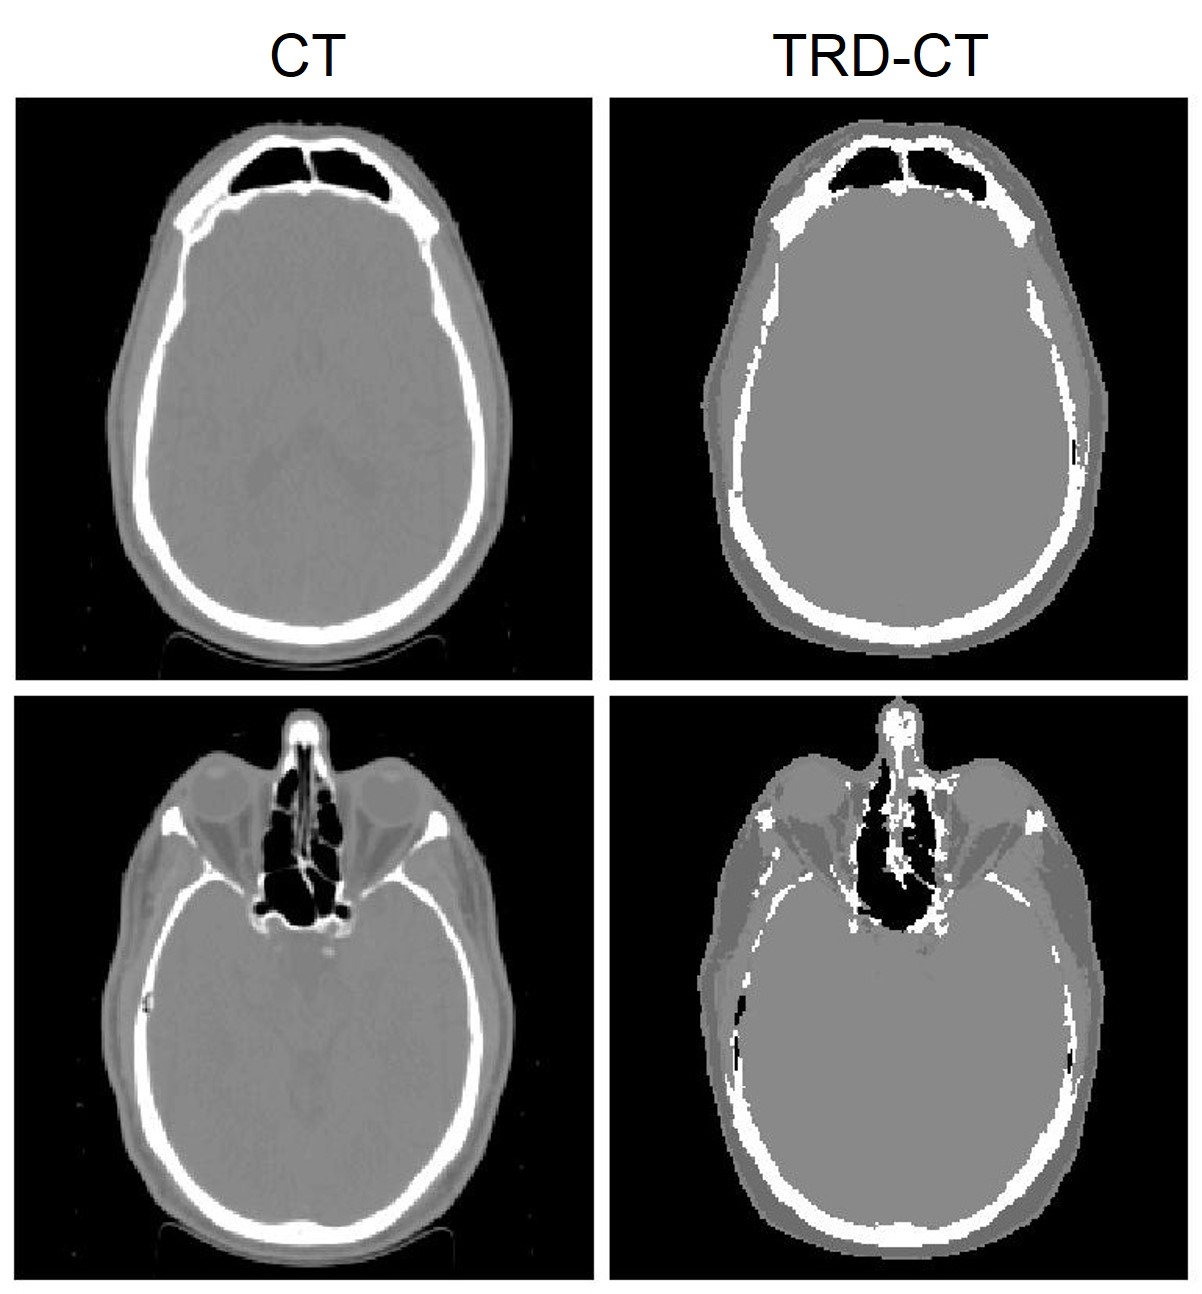
Two examples of CT and TRD-CT are shown in Fig.2. For this participant, the Sorensen-Dice coefficients of bone and air were 0.72 and 0.67, respectively.Discussion
Previously, atlas-based4-6 and segmentation-based7-9 methods have been used to create pseudo-CT with attenuation correction for PET/MRI and MRI-based radiotherapy treatment planning. Atlas-based methods can produce relatively accurate attenuation correction. However, these methods required prior knowledge of the CT-MR atlas and also increased uncertainty for patients with nonstandard internal geometry. Segmentation-based methods didn’t require prior CT-MR atlas, but the accuracy of these methods highly depend on the accuracy of bone/air segmentation. More recently, several studies7,10-12 employed Dixon fat-water imaging and ultrashort-echo-time (UTE) sequence to get better segmentation of anatomical structures. However, these methods required multiple scans, which is time consuming and prone to errors from registration between different images. Moreover, the limited availability of UTE on most MR scanners further limits the application of UTE-based pseudo-CT generation. In this study, we proposed a technique that takes advantage of tissue specific relaxation properties of MRI signal and provides efficient segmentation of bone, air and other anatomical structures. All images were from a single MRI scan which costs less time. This method also eliminated the registration errors compared to dual-scan approach mentioned above while maintaining the ability to obtain multi-contrasts for pseudo-CT generation. We tested the TRD-CT approach on a brain cancer patient and compared the results with CT. This method can provide similar accuracy compared with a recent study9 that incorporated Dixon fat-water imaging and UTE technique to generate pseudo-CT images.Conclusion
In this study, we demonstrated the feasibility of producing a tissue relaxation-based pseudo-CT approach using a single multi-gradient-echo sequence available from most manufacturers. More patients are recruited for this study and dosimetric comparisons based on this method will be included in the future work.Acknowledgements
No acknowledgement found.References
1. Yablonskiy DA. Gradient echo plural contrast imaging (GEPCI) - New fast magnetic resonance imaging technique for simultaneous acquisition of T2, T1 (or spin density) and T2*-weighted images. Radiology. Nov 2000;217:204-204.
2. Luo J, Jagadeesan BD, Cross AH, Yablonskiy DA. Gradient echo plural contrast imaging--signal model and derived contrasts: T2*, T1, phase, SWI, T1f, FST2*and T2*-SWI. NeuroImage. Apr 2 2012;60(2):1073-1082.
3. Yablonskiy DA, Sukstanskii AL, Luo J, Wang X. Voxel spread function method for correction of magnetic field inhomogeneity effects in quantitative gradient-echo-based MRI. Magnetic resonance in medicine : official journal of the Society of Magnetic Resonance in Medicine / Society of Magnetic Resonance in Medicine. Nov 2013;70(5):1283-1292.
4. Kops ER, Herzog H. Alternative methods for attenuation correction for PET images in MR-PET scanners. Paper presented at: 2007 IEEE Nuclear Science Symposium Conference Record; Oct. 26 2007-Nov. 3 2007, 2007.
5. Hofmann M, Steinke F, Scheel V, et al. MRI-Based Attenuation Correction for PET/MRI: A Novel Approach Combining Pattern Recognition and Atlas Registration. J Nucl Med. Nov 2008;49(11):1875-1883.
6. Chen YS, Juttukonda M, Su Y, et al. Probabilistic Air Segmentation and Sparse Regression Estimated Pseudo CT for PET/MR Attenuation Correction. Radiology. May 2015;275(2):562-569.
7. Martinez-Moller A, Souvatzoglou M, Delso G, et al. Tissue Classification as a Potential Approach for Attenuation Correction in Whole-Body PET/MRI: Evaluation with PET/CT Data. J Nucl Med. Apr 1 2009;50(4):520-526.
8. Berker Y, Franke J, Salomon A, et al. MRI-Based Attenuation Correction for Hybrid PET/MRI Systems: A 4-Class Tissue Segmentation Technique Using a Combined Ultrashort-Echo-Time/Dixon MRI Sequence. J Nucl Med. May 2012;53(5):796-804.
9. Juttukonda MR, Mersereau BG, Chen Y, et al. MR-based attenuation correction for PET/MRI neurological studies with continuous-valued attenuation coefficients for bone through a conversion from R2* to CT-Hounsfield units. NeuroImage. 2015;112:160-168.
10. Catana C, van der Kouwe A, Benner T, et al. Toward Implementing an MRI-Based PET Attenuation-Correction Method for Neurologic Studies on the MR-PET Brain Prototype. J Nucl Med. Sep 1 2010;51(9):1431-1438.
11. Keereman V, Fierens Y, Broux T, De Deene Y, Lonneux M, Vandenberghe S. MRI-Based Attenuation Correction for PET/MRI Using Ultrashort Echo Time Sequences. J Nucl Med. May 1 2010;51(5):812-818.
12. Zheng WL, Kim JP, Kadbi M, Movsas B, Chetty IJ, Glide-Hurst CK. Magnetic Resonance-Based Automatic Air Segmentation for Generation of Synthetic Computed Tomography Scans in the Head Region. Int J Radiat Oncol. Nov 1 2015;93(3):497-506.
Figures