4039
Human In-vivo MR Current Density Imaging (MRCDI) Based on Optimized Multi-echo Spin Echo (MESE)1Center for Magnetic Resonance, DTU Elektro, Technical University of Denmark, Kgs. Lyngby, Denmark, 2Danish Research Centre for Magnetic Resonance, Centre for Functional and Diagnostic Imaging and Research, Copenhagen University Hospital, Hvidovre, Denmark, 3High-Field Magnetic Resonance Center, Max-Planck-Institute for Biological Cybernetics, Tübingen, Germany, 4Department of Biomedical Magnetic Resonance, University of Tübingen, Tübingen, Germany
Synopsis
MRCDI aims at imaging an externally injected current flow in the human body, and might be useful for many biomedical applications. However, the method requires very sensitive measurement of the current-induced magnetic field component ∆Bz,c parallel to main field. We systematically optimized MESE to determine its most efficient parameters. In one of the first human in-vivo applications of MRCDI, the optimized sequence was successfully used to image the ∆Bz,c distribution in the brain caused by a two-electrode montage, as confirmed by finite-element calculations of ∆Bz,c. Further improvements will be performed to increase its robustness to field drifts.
Purpose
Imaging the current distribution injected by external electrodes in the human brain might be useful in many biomedical applications, and could, e.g. be used to reconstruct the ohmic tissue conductivities. However, in-vivo human brain MRCDI allows only for weak electrical current injection, i.e. 1-2 mA, which severely limits its sensitivity.1 We aimed for a systematic sensitivity analysis of MESE to determine the most efficient sequence parameters for human brain imaging, and for a systematic experimental validation in phantoms. Finally, we aimed at applying the optimized sequence for in-vivo MRCDI of the human brain.Theory and Methods
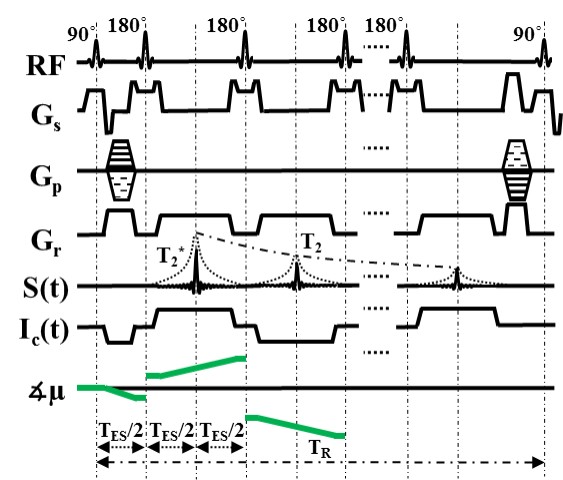
The injected current Ic creates a magnetic field ∆Bz,c inside brain, which is parallel to main MR field. This field causes small frequency shifts, and can be measured using MR phase images. Here, we employ MESE (Fig. 1) due to its high sensitivity, image quality, and robustness to field inhomogeneities and flow artifacts. The bipolar current is injected in synchrony with the sequence, and multiple echoes with linearly increasing current-induced phases (Fig. 2b) are acquired. ∆Bz,c images from each echo are calculated and optimally combined. The efficiency of MESE MRCDI ηMESE is given in Eq. 1,
$$$\large \bf \eta_{\normalsize MESE}=\frac{\mid \triangle B_{z,c}^{comb}\mid}{\sqrt{T_{tot}}}\sqrt{\sum_{n=1}^{N_{echo}}4 \gamma^{2}SNR_{n}^{2}\left[\left(T_{ES}-\tau_{\pi}\right)n-0.5\tau_{\pi/2} \right]^{2}}\tag{1}$$$
Necho, γ, SNRn, TES, τπ, τπ/2, and Ttot are the total number of echoes, gyromagnetic ratio, signal to noise ratio of nth echo, echo spacing, refocusing and excitation pulse-width, and the total measurement time, respectively. First, an experiment was performed in a saline-filled spherical phantom with relaxation parameters like brain tissue (T1 = 1 s, T2 = 100 ms) to determine optimized sequence parameters Necho and TES. Then, an in-vivo brain experiment was conducted with a 30-years old healthy male volunteer, as approved by the local ethical board. Two MRI compatible 5x7 cm2 rubber electrodes were placed on the head above the temporoparietal junctions of the brain. The current waveform was generated using an arbitrary waveform generator (33500B, KEYSIGHT Technologies, California, United States) and an MRI compatible transcranial current stimulator (DC-STIMULATOR PLUS, neuroConn GmbH, Germany). Two different MESE experiments with positive and negative bipolar currents were performed with field of view FOV = 256x256 mm2, image matrix = 128x128, voxel size of 2x2x3 mm3, Navg = 1x2 (for positive and negative current injection), TES = 60 ms, dead time TD = 1.5 s, and Ic = 1mA. In the first experiment, the number of spin echoes NSE = 4 and multiple gradient echoes NGE = 1 (the total number of echoes Necho = NSE×NGE; bandwidth BW = 20.2 Hz/pix) were selected. The long TES results in low-bandwidth data acquisition, causing artifacts. This can be prevented by multiple gradient echo acquisition within each TES with a very small loss of SNR. Therefore, the second experiment was repeated with NSE = 4 and NGE = 5 (BW = 115.2 Hz/pix). For comparison, a head model of the subject was created and the ∆Bz,c simulated by the finite-element method included in SIMNIBS 2 (conductivities: 0.126 S/m for white matter, 0.275 S/m for gray matter, 1.654 S/m for cerebrospinal fluid).
Results
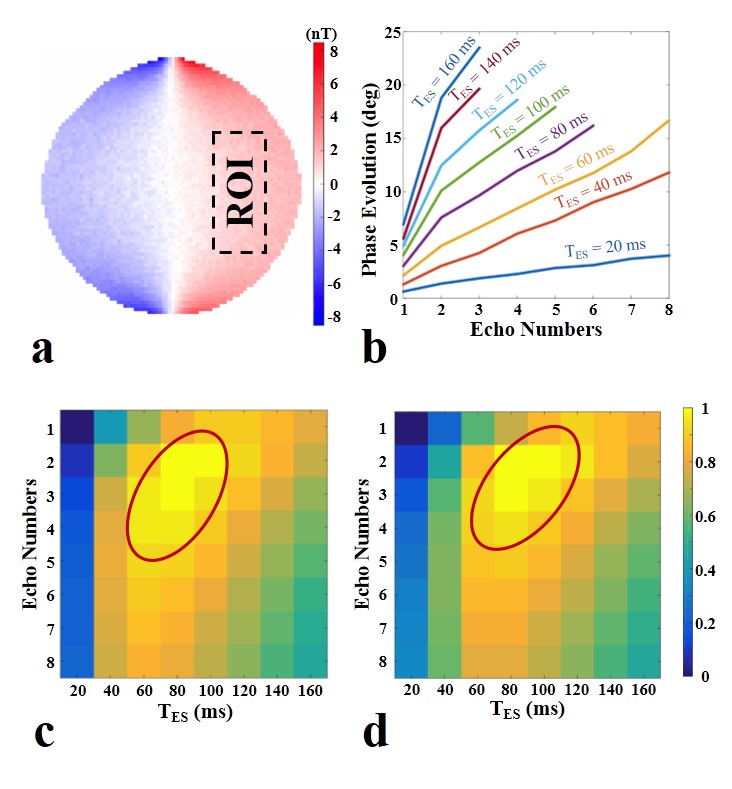
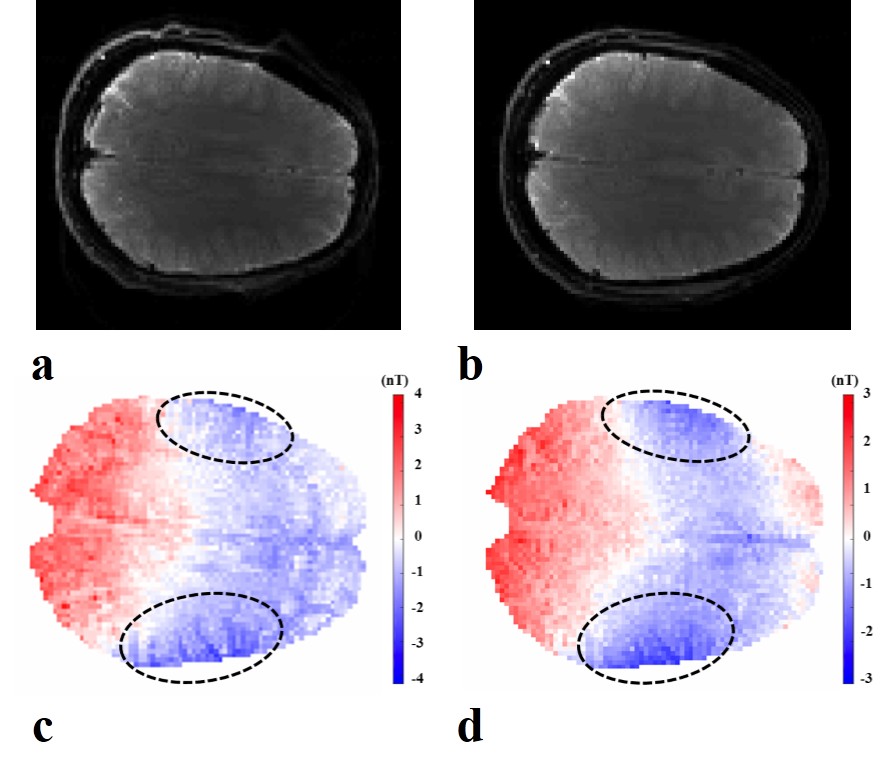
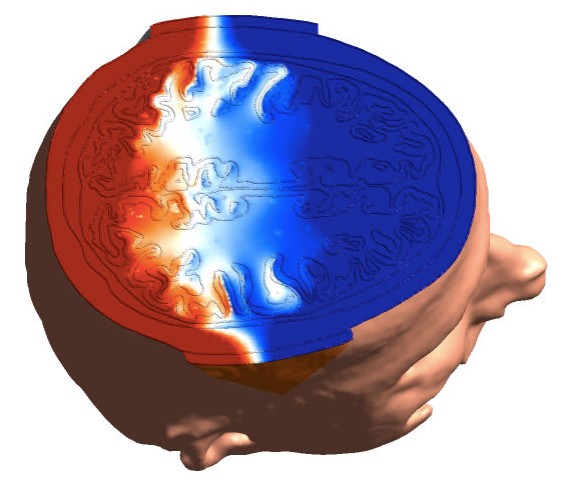
The reconstructed ∆Bz,c inside phantom (Fig. 2a) is as expected for a current flow from top to bottom. The linear increase in the current-induced phase is shown for different echo spacings (Fig. 2b). The most efficient sequence parameters (Fig. 2c,d) are TES = [60-100] ms, Necho = [2-4], TD = 1.5 ms. The MR magnitude images of the human brain are shown in Fig. 3a,b, and the reconstructed ∆Bz,c images are depicted in Fig. 3c,d (given the occurrence of a spurious ∆Bz,c offset, the mean-corrected image is shown for easier interpretation). Acquiring single echo with this long TES caused image distortions, which were avoided by multiple gradient echo acquisition. The measured and simulated ∆Bz,c images show the same general distribution (Fig. 4), with strong field changes close to the CSF-filled and well-conducting sulci underneath the electrodes.Discussion and Conclusion
By multi-gradient echo acquisition, the low-bandwidth artifacts are eliminated. The simulation result of the generated head model and the measurements look similar. Large magnetic field changes induced by high current density in sulcus regions are well observed near pads (Fig 3c,d). The differences between simulations and experiments may arise from rough estimation of the conductivities and anisotropy in the simulations, the spurious magnetic field induced by the current flow in the cables or electrodes, or scanner imperfections. The effect of flow, motion, and static field inhomogeneities should also be considered. Nevertheless, this study demonstrates a successful initial measurement of ∆Bz,c for in-vivo MRCDI.Acknowledgements
The project is supported by Lundbeck foundation with grant number R118-A11308.References
1. Utz KS, Dimova V, Oppenländer K, Kerkhoff G. Electrified minds: Transcranial direct current stimulation (tDCS) and Galvanic Vestibular Stimulation (GVS) as methods of non-invasive brain stimulation in neuropsychology-A review of current data and future implications. Neuropsychologia 2010;48(10):2789–2810. 2. Thielscher A, Antunes A, Saturnino GB. Field modeling for transcranial magnetic stimulation: A useful tool to understand the physiological effects of TMS?, 2015. Milan, Italy: Proc. Annu. Int. Conf. IEEE Eng. Med. Biol. Soc. EMBS; 2015.Figures