4034
Influence of k-space trajectory corrections on the proton density mapping precision with Ultrashort Echo Time Imaging.1Central European Institute of Technology, Masaryk University, Brno, Czech Republic, 2Institute of Scientific Instruments, Academy of Sciences of the Czech Republic, Brno, Czech Republic, 3Biological Resources Imaging Laboratory, Lowy Cancer Research Centre, Sydney, Australia, 4University of Alberta, Edmonton, Canada
Synopsis
The ultrashort echo time (UTE) sequence is capable to provide information about tissues with short T2. On the other hand, as with all non-Cartesian data sampling schemes in general, it is sensitive to mismatching in the acquisition trajectory. This can be a potential source of errors, especially when used for quantitative applications such as proton density (PD) mapping. This problem can be reduced by calibration and correction of the k-space acquisition trajectories. The presented experiments demonstrate the importance of sampling trajectory corrections for UTE imaging, especially when applied for quantitative measurements.
PURPOSE
The ultrashort
echo time (UTE) is often the method of choice for probing short-lived T2 signals
such as, from tendons, cartilage, cortical bones, meniscus and myelin, which are
usually invisible using the conventional Cartesian imaging techniques. UTE
sequences, as most non‑Cartesian acquisition schemes, are sensitive to small trajectory mismatch causing image distortions. This is even more
serious in quantitative MRI applications, where signal intensity errors result
in various discrepancies in tissue characterization. In this study we
demonstrate the impact of the acquisition trajectory errors on the proton
density (PD) measurement, comparing the signal intensities from identical short
T2 specimens positioned at different locations in the FOV. We
propose the calibration and correction of the UTE acquisition trajectories, minimizing
such errors.
METHODS
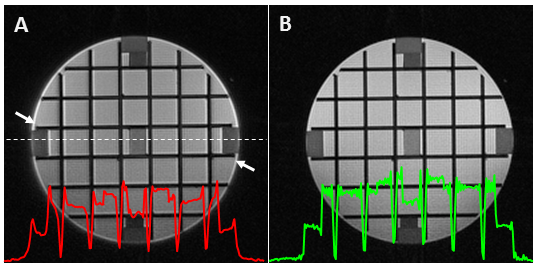
Imaging of a cylindrical water phantom was performed using a 2D UTE dual echo sequence implemented on a whole body 3T (Magnetom Prisma; Siemens) scanner. Water was doped with 25mg/L MnSO4 in order to achieve typical T1/T2 values found for brain tissues 1. As a source of short T2 signal, identical rubber erasers were placed in the center and on the perimeter of the phantom 2. Figure 1(A) shows UTE images of the phantom using the following parameters: TR=300ms, TE=100µs, Variable Rate Selective Excitation (VERSE) RF pulses of 480 µs length, 300 flip angle, 5mm slice thickness, FOV=230mm, readout gradient of 36.5 mT/m with 250µs ramp time. Acquisition of FID along 400 spoke orientations resulted in a 4 min total acquisition time. A whole body RF coil was used for transmitting and a 20‑channel head phased array probe for receiving. The actual course of the UTE acquisition trajectories were calibrated with a k-space mapping technique described in 3 and used to correct UTE image Fig.1(B). The double angle mapping of the B1 transmitting field and measurement of receive phase array coil profile were performed according 4,5. Finally, single shot inversion recovery TurboFlash measurements were performed to acquire T1 maps of the phantom. The B1, T1 and phased array coil sensitivity maps were used for correction of transmit and receive profiles 6.RESULTS and DISCUSSION
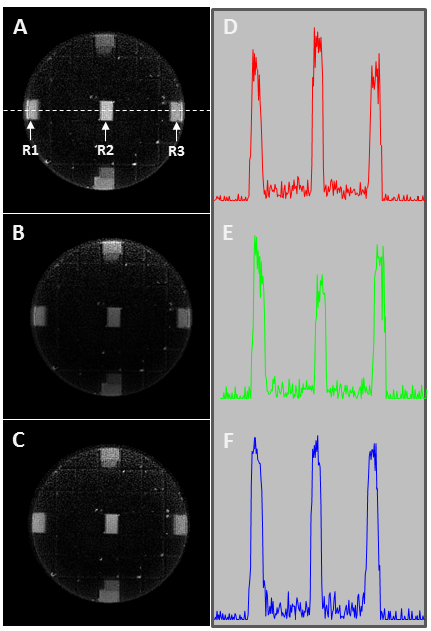
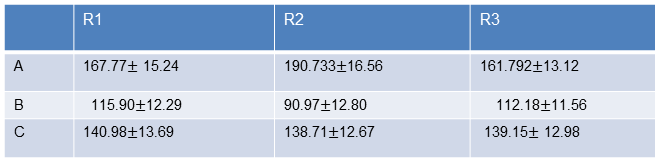
The k-space trajectory deviations affects the UTE image intensity variations which is well demonstrated by comparing 1D profiles of images before and after corrections as shown in the Fig.1. The UTE images from short T2 signals were obtained by subtracting a second echo image and are shown in Fig.2: (A) without any correction, (B) transmit/receive profile correction and (C) k-space trajectory and transmit/receive sensitivity corrections. The intensities of the signals measured from the same region of interest ROI (R1, R2 and R3) for all three cases are provided in Table 1 and revealed significant differences in signal intensities obtained with the different reconstruction scenarios. While the corrections for transmit/receive sensitivity profile is accepted as the standard procedure in PD mapping [4], the comparison of the central and peripheral ROI location reveals discrepancies in the signal intensities for such corrected UTE images (Fig.2 B). A further improvement can be achieved by the calibration and correction of the acquisition trajectory during the gridding procedure of the k‑space data. This improves the consistency of the signal intensities over the FOV (Fig.3 C).CONCLUSION
The experimental data showed that even a small data sampling mismatch, which does not produce obvious image degradation or artifacts, could lead to serious PD quantification discrepancies as is shown in Table 1. The presented experiments demonstrate the importance of sampling trajectory corrections for UTE imaging, especially when applied for quantitative measurements.Acknowledgements
This work was funded by Czech Science Foundation grant no. 599 GA15-12607S.References
1. Meyers, S. M., Kolind, S. H., Laule, C. & MacKay, A. L. Measuring water content using T2 relaxation at 3 T: Phantom validations and simulations. Magnetic Resonance Imaging 34, 246–251 (2016).
2. Du, J. et al. Ultrashort echo time (UTE) magnetic resonance imaging of the short T2 components in white matter of the brain using a clinical 3T scanner. NeuroImage 87, 32–41 (2014).
3. Latta,
P., Starcuk Jr., Z., Gruwel, M. L. H., Weber, M. H. & Tomanek, B. K-space
trajectory mapping and its application for Ultrashort Echo Time Imaging. Magnetic
Resonance Imaging doi:10.1016/j.mri.2016.10.012 (in press)
4. Volz, S., Nöth, U. & Deichmann, R. Correction of systematic errors in quantitative proton density mapping. Magn. Reson. Med. 68, 74–85 (2012).
5. Wang, J., Qiu, M. & Constable, R. T. In vivo method for correcting transmit/receive nonuniformities with phased array coils. Magn. Reson. Med. 53, 666–674 (2005).
6. Baudrexel,
S. et al. Quantitative T1 and proton density mapping with direct
calculation of radiofrequency coil transmit and receive profiles from two-point
variable flip angle data. NMR Biomed. 29, 349–360 (2016).
Figures