4033
MR-embedded respiratory motion tracking in ZTE lung imaging for PET-MRI1Imagerie par Résonance Magnétique Médicale et Multi-Modalités, IR4M, CNRS, Univ Paris-Sud, Université Paris-Saclay, Orsay, France, 2Applications & Workflow, GE Healthcare, Orsay, France, 3Imagerie Moléculaire in Vivo, IMIV, Inserm, CEA, CNRS, Univ Paris-Sud, Université Paris-Saclay, Orsay, France
Synopsis
This study aims at showing the feasibility of MR-embedded respiratory motion tracking in ZTE lung imaging. It was shown that the motion information in a moving phantom as well as in free-breathing human volunteers and patients could be extracted from the off-center k-space data sampled during a ZTE acquisition with a faithful accuracy and precision in time and in amplitude with respect to a respiratory belt measurement. This new intrinsic motion follow-up method could be useful for retrospective motion correction of simultaneously acquired PET/MR images.
Purpose
Additional measurement methods are often implemented in PET or MRI acquisitions for patients’ breathing follow-up to possibly cope with related motion artifacts. To circumvent the associated more complex patient setup or increased scan time1,2, motion information can alternatively and directly be processed out of the PET3 or MR4 raw signals. In MRI, the frequently-sampled DC signal at the center of a radially acquired k-space has been favored so far, especially in UTE pulse sequences, which enable high quality lung imaging5,6. Beyond UTE, ZTE pulse sequences could advantageously be used in combined PET-MRI not only for lung imaging7,8,9 but also for establishing tissue density and corresponding attenuation correction maps10. However, its particular k-space readout pattern (3D radial acquisition with low k and high k regions of k-space acquired during two different sub-sequences) hinders periodic sampling of the k-space center during the total duration of the acquisition11,12. Here, feasibility of MR-embedded motion tracking using k-space off-center data is demonstrated in ZTE lung imaging.Material and methods
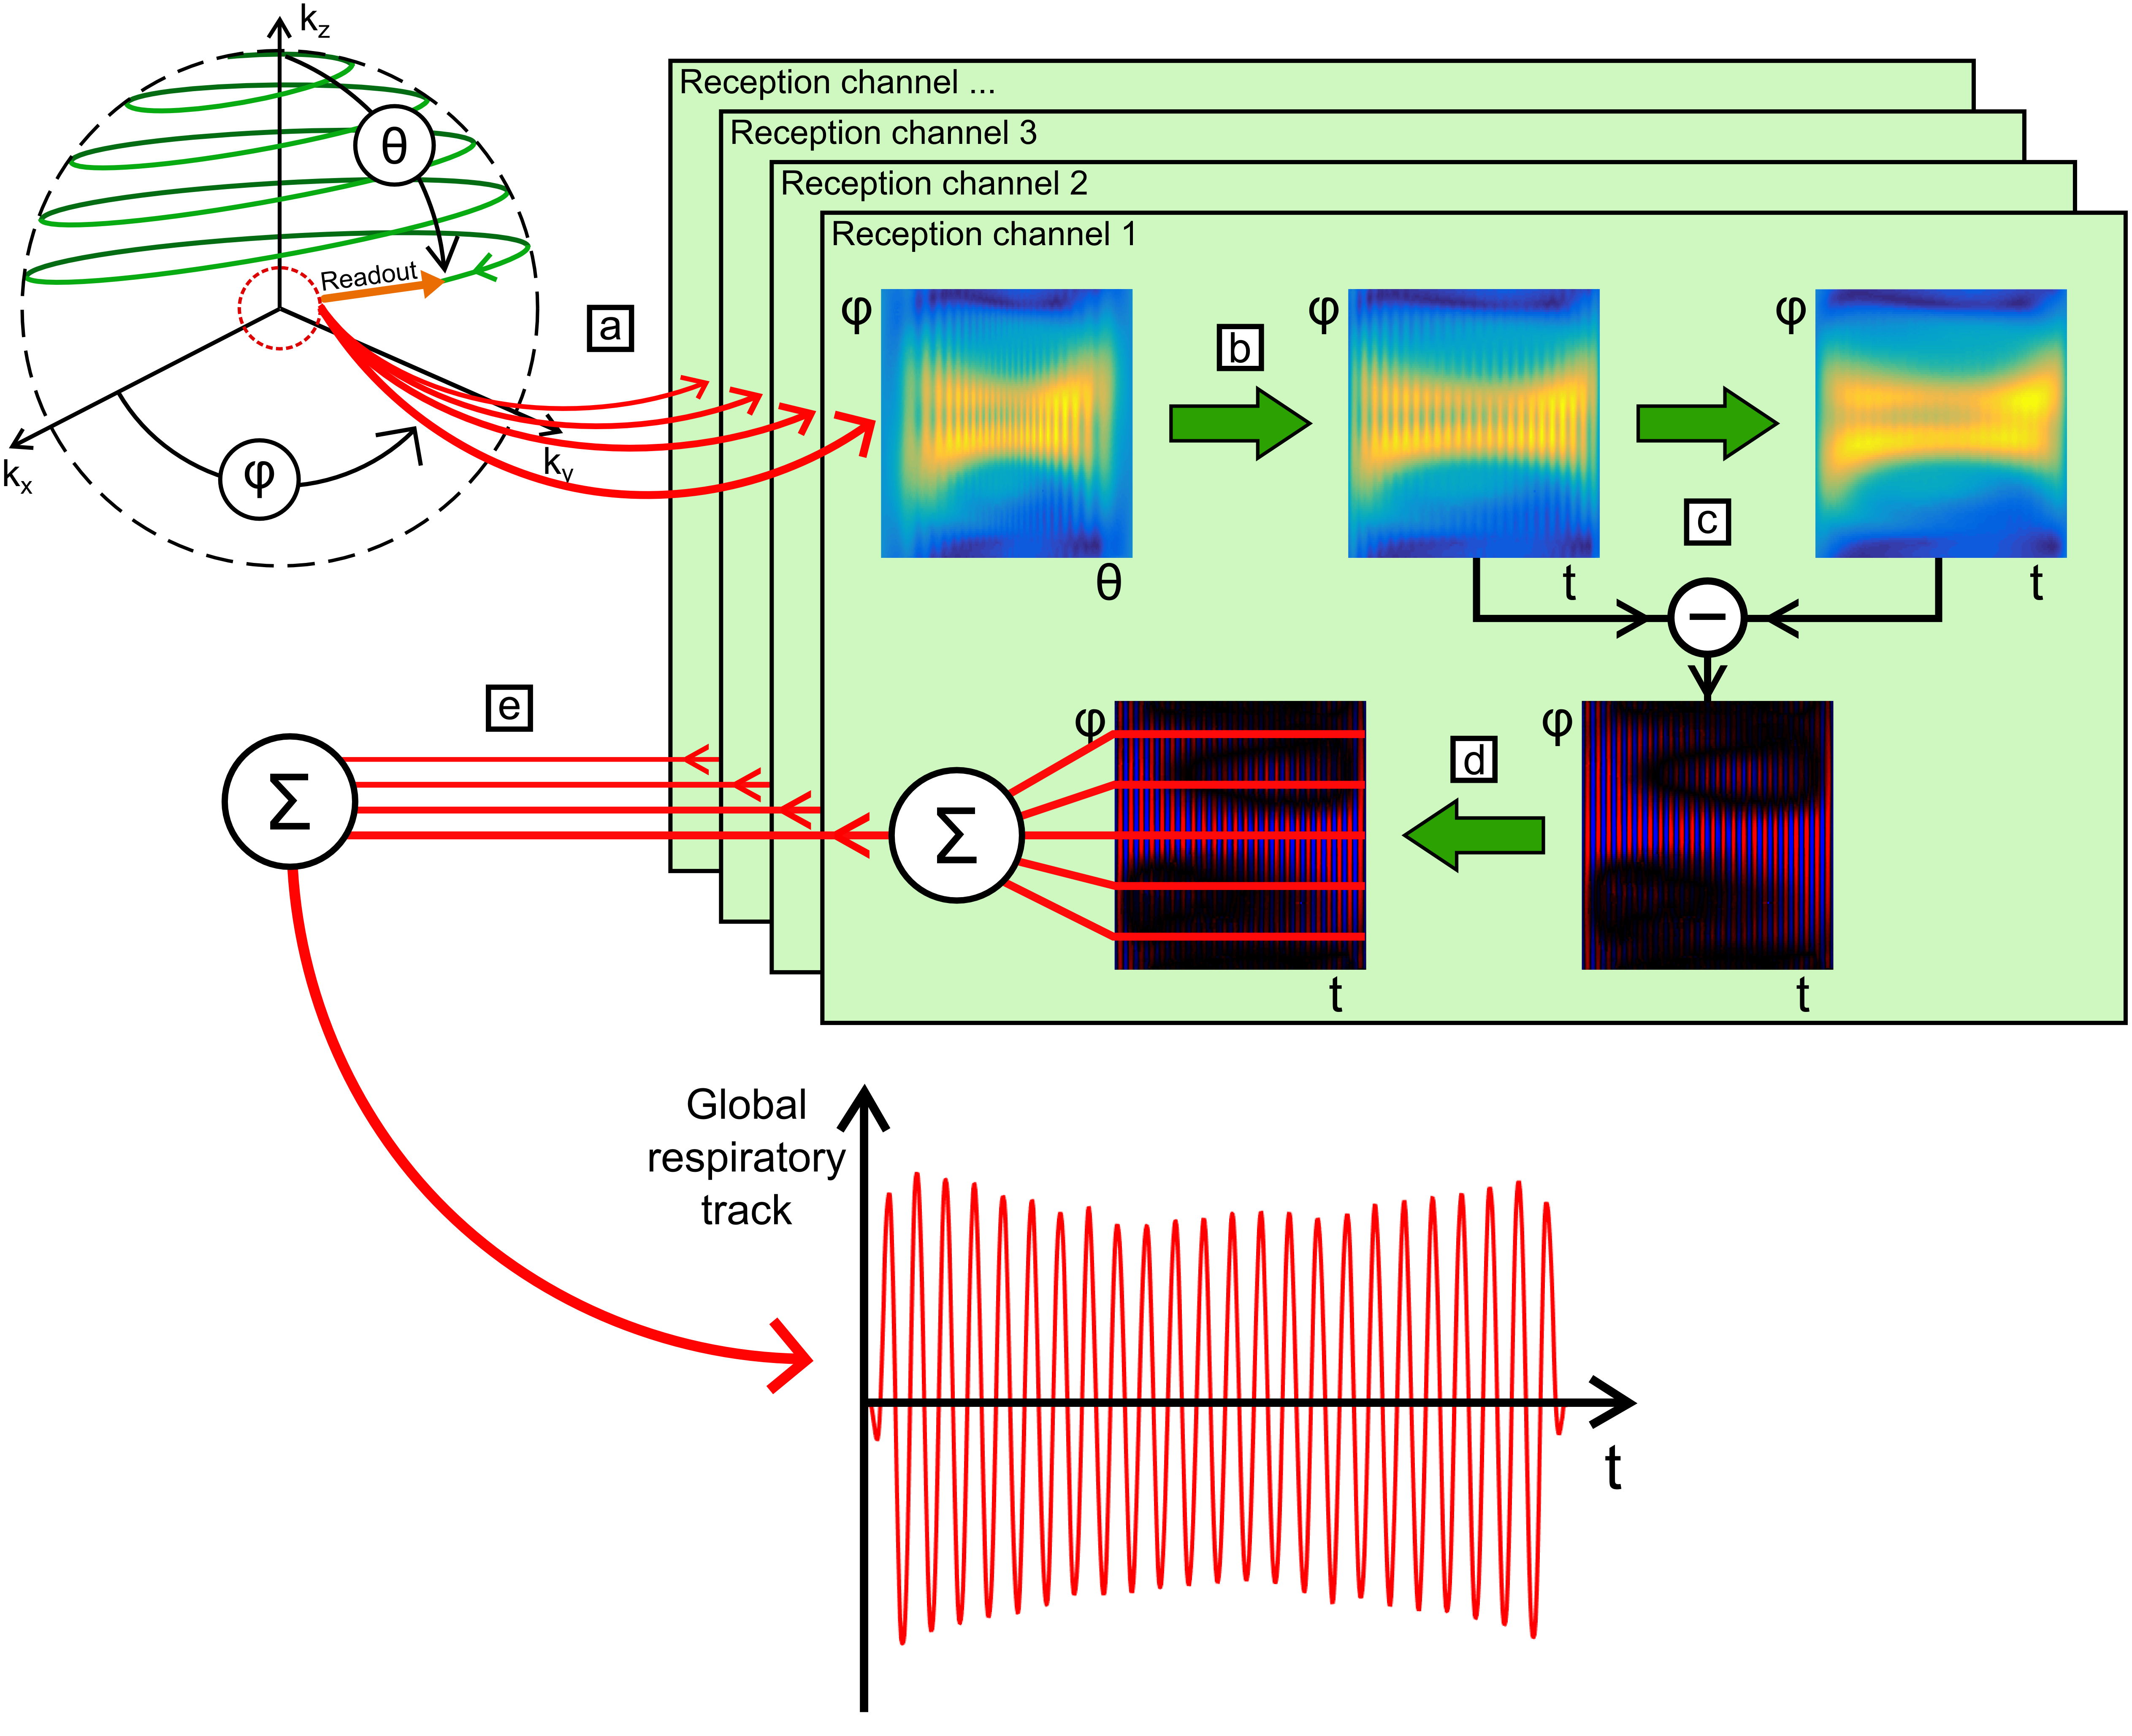
The ZTE pulse-sequence1,11,12 was used on a GE Signa PET/MR 3.0 T system (GE Healthcare, Waukesha, WI, USA) with FOV = (35×35×20) cm3, α = 2°, BW/2 = 31.3 kHz, 64 spokes per segment, 256 points per readout, TR = 2.55 ms, and TScan = 88 s. Data was acquired with a 30-channel thoracic coil array on (1) a rectangular water phantom periodically moved along the bore axis with different motion amplitudes and periods; (2) five healthy human volunteers, 2F/3M, (28 ± 3) years, with three repetitions; and (3) one patient with lung cancer. The phantom motion and the subjects’ respiratory motion were externally recorded with a respiratory belt. MR data was processed using Matlab following five steps (Figure 1):
a. Extraction of the first off-center point acquired in k-space for each readout spoke in the k-space spherical coordinates (θ,φ),
b. Interpolation into the time domain (t,φ),
c. Non-linear high-pass filtering in the time domain,
d. Rephasing of every readout directions (φ) and reception channels,
e. Combination into a global respiratory track.
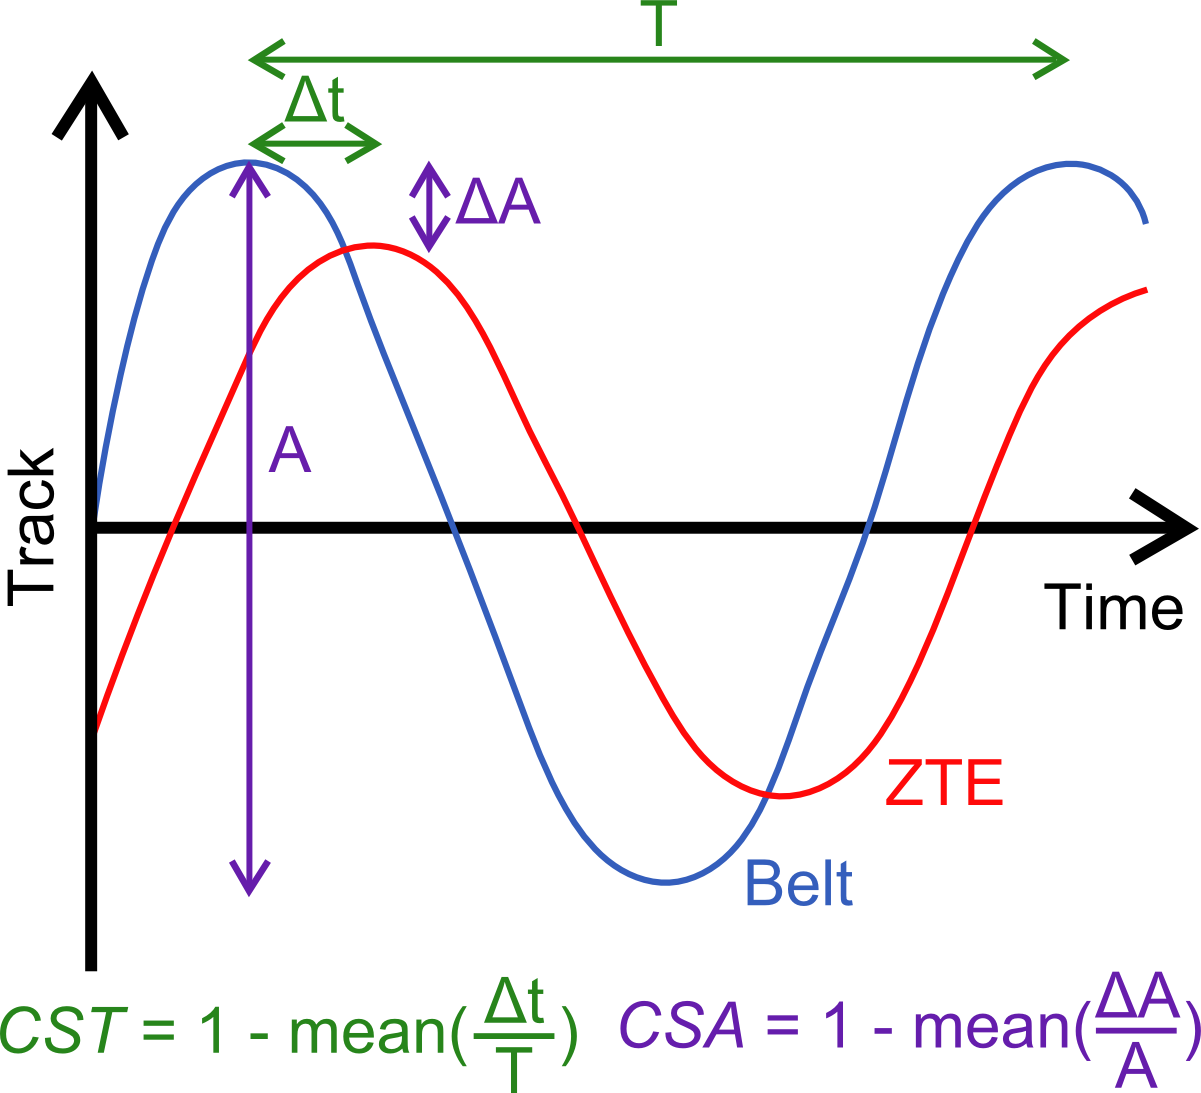
The relevance of this global respiratory track was challenged with the outcome of the respiratory belt. Its accuracy was estimated after amplitude normalization with respect to the motion phase and amplitude through two coefficients of similarity defined in time (CST) and amplitude (CSA) by (Figure 2):
- the mean ratio between (1) the time offset, Δt, between the extrema of the MR and respiratory belt data and (2) the local motion period, T, estimated from the respiratory belt data;
- the mean ratio between (1) the amplitude difference, ΔA, between the extrema of the MR and respiratory belt data and (2) the local motion amplitude, A.
Results
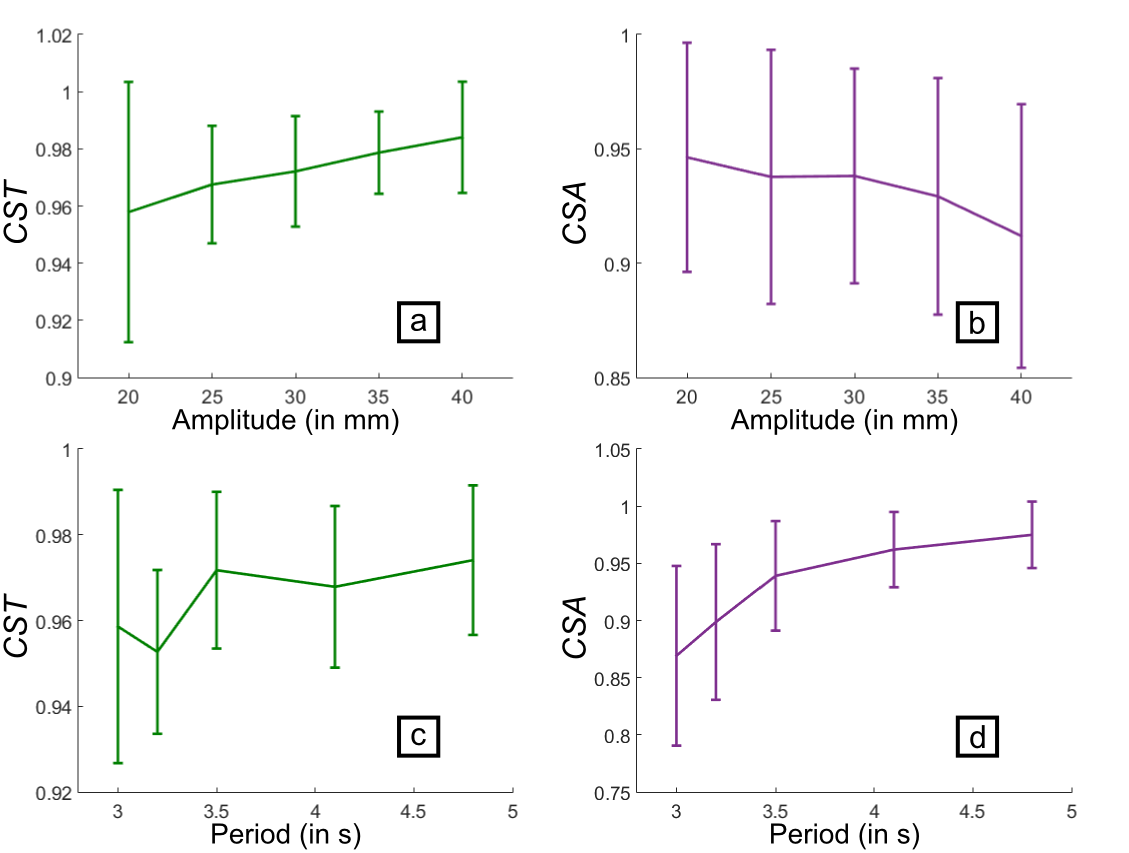
The coefficients of similarity for the phantom are plotted with respect to the motion amplitude and period (Figure 3). The MR follow-up is more precise, for the motion phase, at higher motion amplitudes and periods but, for the motion amplitude, at lower motion amplitudes and higher motion periods. The results were shown to be repeatable with a variation of 0.10 % for CST and 0.11 % for CSA.
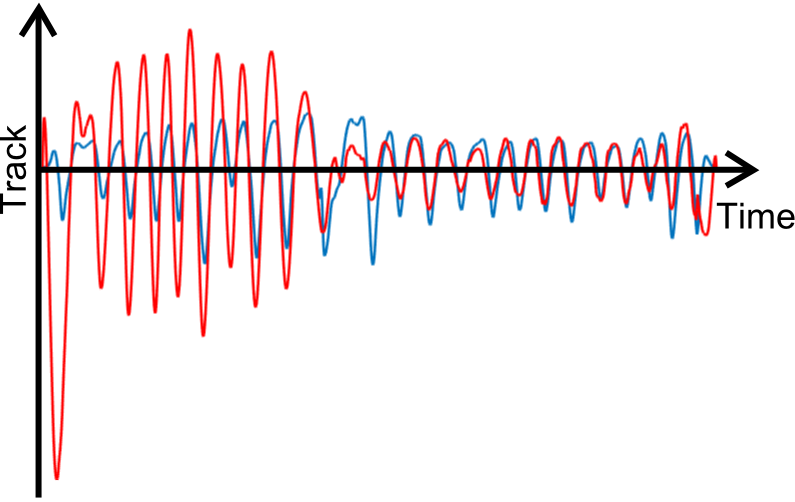
For the human volunteers, the respiratory tracks obtained with ZTE and the respiratory belt are similar: CSTV = (0.93 ± 0.02) and CSAV = (0.83 ± 0.06). For the patient, the respiratory tracks are similar in phase, CSTP = 0.86, but they noticeably differ in amplitude, CSAP = 0.39 (Figure 4).
Discussion and conclusions
The information extracted from off-center k-space data faithfully follows the motion as recorded with the respiratory belt over a large range of motion amplitudes and periods in the periodically-moving phantom. It also faithfully reports the physiological respiratory motion for both volunteers and patient as supported by the large CST. The CSA decrease in-vivo reflects the arbitrary normalization of the recorded motion amplitude for both methods. This difference actually sustains the sensitivity to the motion we may have in the rich information embedded in the MR data.
This original off-center approach could play a major role (1) to retrospectively correct for motion, either by averaging or by gating both PET and MR images, which are simultaneously acquired; (2) to set either dynamic or motion-free pseudo-CT maps for PET attenuation correction12 and density correction in MR elastography of the lungs.
Acknowledgements
This work was supported by the Physics and Imaging for Medicine program at Université Paris-Saclay. Imaging was performed on the PET-MRI platform at SHFJ (Orsay, France), partly funded by France Life Imaging (grant ANR-11-INBS-0006).
The experiments in humans were part of the research protocol PROMISE (PET/MR in Oncology and inflaMmatory process - Clinical trial 100 035 2015-A01431-48) at SHFJ (I2BM, DRF, CEA).
References
1 F. Gibiino, L. Sacolick, A. Menini, et al. Free-breathing, zero-TE MR lung imaging. MAGMA, 28(3):207–215, Jun. 2015.
2 S.A. Nehmeh and Y.E. Erdi, Respiratory Motion in Positron Emission Tomography/Computed Tomography: A Review. Seminars in Nuclear Medicine, 38(3): 167-176, May 2008.
3 K. Thielemans, S. Rathore, F. Engbrant, et al. Device-less gating for PET/CT using PCA. IEEE Nuclear Science Symp. Conf. Record pp 3904–10, 2011.
4 R. Grimm, S. Fürst, I. Dregely, et al. Self-gated Radial MRI for Respiratory Motion Compensation on Hybrid PET/MR Systems. MICCAI, 16(3):17–24, 2013.
5 N.S. Burris, K.M. Johnson, P.E. Larson, et al. Detection of Small Pulmonary Nodules with Ultrashort Echo Time Sequences in Oncology Patients by Using a PET/MR System. Radiology, 278(1):239–246, Jan. 2016.
6 M. Tibiletti, J. Paul, A. Bianchi, et al. Multistage three-dimensional UTE lung imaging by image-based self-gating. Magnetic Resonance in Medicine, 75(3):1324–1332, Mar. 2016.
7 M. Weiger and K.P. Pruessmann. MRI with Zero Echo Time. eMagRes, 1(2), 2012.
8 M. Weiger, M. Wu, M.C. Wurnig, et al. Rapid and robust pulmonary proton ZTE imaging in the mouse. NMR in Biomedicine, 27(9):1129–1134, Sep. 2014.
9 A. Bianchi, M. Tibiletti, A. Kjorstad, et al. Three-dimensional accurate detection of lung emphysema in rats using ultra-short and zero echo time MRI. NMR in Biomedicine, 28(11):1471–1479, Nov. 2015.
10 G. Delso, F. Wiesinger, L. Sacolick, et al. Clinical Evaluation of Zero-Echo-Time MR Imaging for the Segmentation of the Skull. Journal of Nuclear Medicine, 56(3):417–422, Mar. 2015.
11 D.P. Madio and I.J. Lowe. Ultra-Fast Imaging Using Low Flip Angles and FIDs. Magnetic Resonance in Medicine, 34(4):525–529, Oct. 1995.
12 F. Wiesinger, L.I. Sacolick, A. Menini, et al. Zero TE MR Bone Imaging in the Head. Magnetic Resonance in Medicine, 75(1):107–114, Jan. 2016.
Figures