4032
Inversion-non-Recovery (InoR) method for long-T2 suppression in a steady-state 3D-UTE sequence for short-T2 imaging1Université de Strasbourg, CNRS, ICube, FMTS, Strasbourg, France, 2Institut Mines Télécom, Télécom Bretagne, INSERM LaTIM, Brest, France
Synopsis
A novel method for long-T2 suppression in 3D-UTE imaging is introduced. The method is based on long- and short-T2 components phase states in a dual-segment acquisition scheme (digital summation of two k-spaces before reconstruction, respectively acquired with and without adiabatic inversion), and offers a substantial contrast-to-noise ratio over the different components. We compare our method to the state-of-the-art IR-UTE. It shows higher performance and efficiency in terms of signal suppression and short-T2 contrast.
Purpose
Imaging of the very-short T2 tissues is challenging in that the signal decays very rapidly (T2 < 1ms), as well as its signal quantity being often overwhelmed by long-T2 components (fat, free-water). Numerous methods to highlight these species exist using a proper preparation (Inversion-Recovery (IR) modules1, saturation module2, more complex and specific long-T2 suppression pulses3) or a specific excitation pattern (binomial pulses4) to either null the undesired signal or to selectively excite the component of interest. In this work, we explore a novel method for long-T2 suppression and short-T2 signal quantity maximization in a steady-state 3D-UTE sequence. Simulations and results are compared with the IR-UTE method.Theory
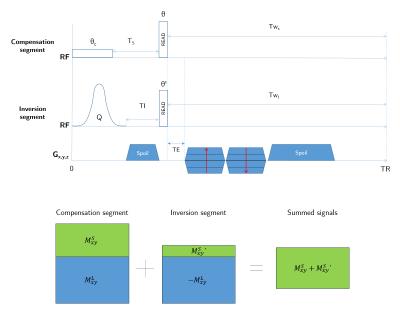
The method employed (fig. 1) consists in a 2-part sequence: one segment (referred hereafter to as “compensation”) composed of a long ($$$\gg$$$$$$T_2^{short}$$$) rectangular-pulse followed by a short one, and one segment (hereafter called “inversion”) similar to the IR-UTE method. Inversion time TI and $$$\theta'$$$ are optimized along with $$$\theta_{c}$$$ and $$$\theta$$$ so that the sum of acquired k-spaces from both segments yields a long-T2-free one while short-T2 component is maximized through the optimization process introduced below. Here, we take advantage of the long-T2 signals being in opposite phases in the different segments to yield a proper suppression. Meanwhile the short-T2 ones stay in phase since at most saturated by the adiabatic inversion pulse (Q=0)5. Hence, the sum of signals is therefore theoretically exclusively composed of short-T2 signal. The use of the compensation pulse gives an additional degree of freedom, all the more important as its long duration is taken into account in the optimization process for short-T2 signal maximization.
Signal quantities can be generally expressed after respective readout pulses ($$$\theta/\theta'$$$) using the Bloch equations:
$$M_{xy}=M_0\frac{(1-E_s)+E_s(1-E_w)f_{z_{C}}}{1-f_{z_{C}}f_zE_SE_w}f_{xy}$$
$$M_{xy}'=M_0\frac{(1-E_I)+E_I(1-E'_w)Q}{1-Qf'_zE_IE'_w}f_{xy}',$$
with $$$E_s=e^{-T_s/T1}$$$, $$$E_I=e^{-TI/T1}$$$, $$$E_w=e^{-T_{w_s}/T1},E_w'=e^{-T{w_I}/T1}$$$,
$$$f_{z}=e^{-\tau/2T_2}\Big[\cos\big(\sqrt{\alpha^2-(\tau/2T_2)^2}\big)+\tau/2T_2\text{sinc}\big(\sqrt{\alpha^2-(\tau/2T_2)^2}\big)\Big]$$$,
$$$f_{xy}=e^{-\tau/2T_2} \alpha\text{sinc}\big(\sqrt{\alpha^2-(\tau/2T_2)^2}\big)$$$ ($$$\tau$$$ being respective pulse durations and $$$\alpha$$$ corresponding flip angles) as described in [6], and $$$Q$$$ inversion efficiency $$$(Q \in [-1,1])$$$.
Thus, suppressing the long-T2 component and maximizing the short-T2 one can be reduced to a 4-parameters optimization problem over $$$\theta, \theta’, \theta_C$$$ and TI:
$$\text{argmin}\|\sum_{i=1}^2\omega_i\phi_i\|_2^2,$$
with $$$\omega_i$$$ weightings,
$$$\phi_1=|M_{xy}^{L}(\theta,\theta_{C})-|M_{xy}^{'L}(\theta',TI)||$$$,
and $$$\phi_2=(M_{xy}^{S}(\theta,\theta_{C})-M_0)+(M_{xy}^{'S}(\theta',TI)-M_0)$$$ ($$$L$$$ and $$$S$$$ superscripts stand for long and short, respectively).
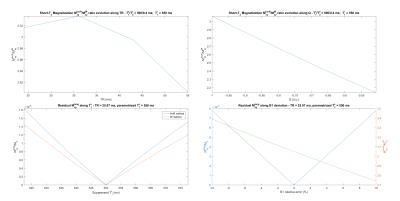
Simulations of signal enhancement compared to the IR-UTE method and signal suppression theoretical efficiency were performed (fig. 2). Both segments are somehow similar to the Actual Flip Angle sequence7, except that the consecutive pulses are different (stretched hard or adiabatic pulses). Thus, gradient spoiling, RF spoiling and delays (such as $$$T_s$$$ and $$$T_{w_{I/s}}$$$) are set to ensure a proper spoiling of the long-T2 component, and a minimal impact of potential static gradients8. Spoiling parameters (gradient/RF phase) were optimized in simulations using the EPG formalism9.
Method
Experiments were conducted on a 7T BioSpec 70/30 USR small animal MRI system (Bruker BioSpin MRI GmbH, Ettlingen, Germany). The phantom was composed of a Lego brick (T1/T2$$$\approx$$$500/0.5 ms at 7T) immersed in a 1 mM Ni2+,2Cl- solution (D=1.81.10-9 m²/s, T1/T2=550/290 ms). Scans were performed using a 86 mm diameter transmitter and a mouse surface coil for reception.
Common sequence parameters were: repetition time=25.07 ms, TE=25 $$$\mu$$$s, RF-phase increment $$$\phi_0$$$=10°, receiver bandwidth=150 kHz, matrix size=96x96x96, voxel dimension=0.26 mm isotropic, number of radial lines=28733, dummy scans=184. Specific parameters were:
InoR-UTE: $$$T_s/TI/T_{w_{s}}/T_{w_{I}}$$$=4/3/20/15 ms, $$$\tau_{inv}$$$=7 ms (hyperbolic secant), $$$\tau_{comp}$$$=1 ms, $$$\tau_{read}$$$=70 $$$\mu$$$s, $$$\theta_{C}$$$=78°, $$$\theta$$$=36.3°, $$$\theta'$$$=90°, $$$G_{spoil}^{comp}\times t_{spoil}^{comp}$$$=1060.2/5301.0 mT/m.s, $$$G_{spoil}^{inv}\times t_{spoil}^{inv}$$$=706.8/3534.0 mT/m.s, scan time=24min20s;
IR-UTE: $$$TI/T_{w_{I}}$$$= 9/9 ms (TI was chosen to theoretically suppress the long-T2 component given the sequence parameters), $$$\tau_{inv}$$$=7 ms (hyperbolic secant), $$$\tau_{read}$$$=70 $$$\mu$$$s, $$$\theta_{IR}$$$=90°, $$$G_{spoil}^{IR}\times t_{spoil}^{IR}$$$=706.8/3534.0 mT/m.s, 24 averaging to reach a sufficient SNR, scan time=4h48min.
Results
Fig. 3 shows a slice acquired with a localizer, an IR-UTE and an InoR-UTE sequence. CNR values between doped-water and Lego brick were respectively 8.05 and 0.39 for InoR and IR methods. Imperfect suppression on top areas of the InoR method is equated to B1 field inhomogeneities. Due to the short TR and in spite of a 3D acquisition modality and substantial averaging, no usable contrast was obtained with the IR method. This observation emphasizes the short-T2 signal quantity difference between InoR- and IR-UTE methods.Conclusion
Short-T2 maximal SNR and long-T2 suppression can be obtained in IR-UTE with a theoretical inversion time $$$TI=-T_1^{long}\ln((1+e^{-TR/T_1^{long}})/2)$$$ and $$$\theta_{IR}$$$=90°. For biological tissues, this TI condition imposes a prohibitively long acquisition time in 3D IR-UTE with very small isotropic voxel dimensions to yield a sufficient SNR over the component of interest. We have shown that a proper suppression of the undesired component can be performed while yielding a high short-T2 signal quantity using the InoR method.Acknowledgements
No acknowledgement found.References
1. Du, J. et al., Dual inversion recovery, ultrashort echo time (DIR UTE) imaging: Creating high contrast for short-T2 species, MRM 2010; 63:447-455
2. Du, J. et al., Short T2 contrast with three-dimensional ultrashort echo time imaging, MRM 2011; 29:470-482
3. Larson, P. et al., Designing long-T2 suppression pulses for ultrashort echo time imaging, MRM 2006; 56:94-103
4. Deligianni, X. et al., Water-selective excitation of short-T2 species with binomial pulses, MRM 2014; 72:800-805
5. Li, C. et al., Comparison of optimized soft-tissue suppression schemes for ultrashort echo time MRI, MRM 2012; 68:680-689
6. Sussman, M., Design of practical T2-selective RF excitation (TELEX) pulses, MRM 1998; 40:890-899
7. Yarnykh, V. et al., Actual flip-angle imaging in the pulsed steady state: A method for rapid three-dimensional mapping of the transmitted radiofrequency field, MRM 2007; 57:192-200
8. Nehrke, K., On the steady-state properties of actual flip angle imaging (AFI), MRM 2009; 61:84-92
9. Weigel, M., Extended phase graphs: Dephasing, RF pulses, and echoes - pure and simple, JMRI 2015; 41:266-295
Figures


