4030
Myelin and cortical bone short-T2 quantification using saturation and diffusion-based long-T2 suppression in a steady-state 3D-UTE sequence1Université de Strasbourg, CNRS, ICube, FMTS, Strasbourg, France, 2ICM, CENIR, UPMC-Inserm U1127, CNRS 7225, Paris, France, 3Institut Mines Télécom, Télécom Bretagne, INSERM LaTIM, Brest, France
Synopsis
Imaging of the very-short T2 tissues in the head is challenging in that the signals decay very rapidly (T2 < 1 ms), as well as their signal quantity being often overwhelmed by long-T2 relaxing components (fat, free-water). In this work, we explore the feasibility of short-T2 quantification in the white matter and in the cortical bone using a novel method for long-T2 suppression based on diffusion and coherence effects in a steady-state 3D-UTE sequence.
Purpose
Fast decaying signals of cortical bone and myelin in the central nervous system are challenging to acquire since long relaxing signals remain dominant, and a short-acquisition start is mandatory. Myelin is especially more complex to directly image since white matter (WM) content is mainly composed of free-water, as well as phospholipids and proteins (with an expected T2* range from 50 $$$\mu$$$s to 1 ms)1,2. Globally, employing a long-T2 suppressing scheme along with a UTE acquisition module has shown to allow short-T2 quantification in biological tissues3,4. Numerous methods to highlight these species exist using a proper preparation to minimize the undesired signal contamination (Inversion-Recovery modules3 or more complex and specific long-T2 suppression pulses5). In this work, we use a novel method for long-T2 suppression in a steady-state 3D-UTE sequence, allowing short-T2 quantification in a mouse head. Simulations and analysis were performed using the Extended Phase Graph (EPG) formalism6.Theory
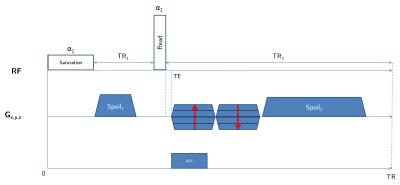
The pulse sequence employed (fig. 1) consists in a long ($$$\gg$$$$$$T_2^{short}$$$) saturation rectangular-pulse followed by a short one, whose flip angle will be computed to maximize the short-T2 signal. Gradient spoiling, RF spoiling and delays are optimized to ensure a steady-state of the long-T2 component to be suppressed, and a minimal impact of potential static gradients (e.g. B0 inhomogeneities)7,8.
Given a first flip angle $$$\alpha_1$$$ = 90°, $$$\alpha_2$$$ ($$$\leq$$$ 90°) is computed to maximize the short-T2 component by using the Bloch equations (accounting for relaxation occurring during excitation9), and using myelin semi-solid T1 and T2* values found in [4]. Then, using the expression of configuration states in [6], the signal to be suppressed can be written:
$$F_0^+=\cos(\alpha_2/2)^2F_{0}^-+e^{2i\Phi}\sin(\alpha_2/2)^2F_0^{-*}-ie^{i\Phi}\sin(\alpha_2)Z_{0}^{-},$$
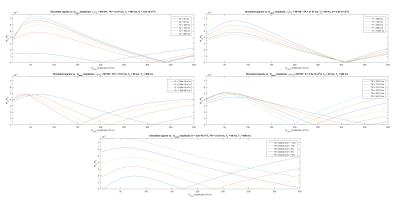
with $$$F_0$$$ and $$$Z_0$$$ being functions of $$$\alpha_1,\alpha_2$$$, RF-phase $$$\Phi,n=TR_2/TR_1,TR_2,TR_1,T_1^{long},T_2^{long}$$$ and diffusion coefficient $$$D$$$. Since no trivial analytical expression exists for the $$$F_0^-$$$ and $$$Z_0^-$$$ states in steady-state, we numerically explored the tissues and sequence parameters space in order to assess whether the diffusion effect induced by the spoiling gradients would combine the $$$F_0^-$$$ and $$$Z_0^-$$$ states in order to satisfy $$$|F_0^+|=0$$$, corresponding to a signal cancellation. This condition has been met in simulations using an EPG implementation (fig. 2).
Method
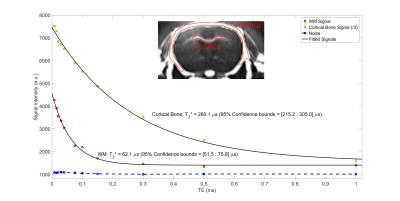
Experiments were conducted on a 7T BioSpec 70/30 USR small animal MRI system (Bruker BioSpin MRI GmbH, Ettlingen, Germany). A mouse head soaked in PFPE (Galden, Solvay) was scanned with a 86 mm diameter transmitter and a mouse surface coil for reception. T1, T2 and D values were previously established in WM (T1=923$$$\pm$$$8.1 ms, T2=70$$$\pm$$$2.5 ms, D=(0.328$$$\pm$$$0.011).10-9 m²/s over the same spoiling direction), and used as an initial value computed in EPG to iteratively find the optimal $$$G_{spoil}$$$. Sequence parameters were: repetition time = 31.07 ms (TR1/TR2 = 5/25 ms (n = 5), $$$\tau_{1}$$$ = 1 ms, $$$\tau_{2}$$$ = 70 $$$\mu$$$s), 11 TE values from 8 $$$\mu$$$s to 1 ms for T2* quantification, $$$t_{spoil}$$$ = 3/15 ms, $$$G_{spoil}$$$ = 66.3 mT/m, $$$\alpha_1/\alpha_2$$$ = 90°/50°, RF phase increment $$$\Phi_0$$$ = 0°, receiver bandwidth = 138.88 kHz, matrix size = 128x128x128, voxel dimension = 0.156 mm isotropic, number of radial lines = 51530, dummy scans = 200 and 4 averaging for a total scan time of 19h58min. An additional scan with 16 averaging was performed with the same parameters at TE = 50 $$$\mu$$$s (scan duration = 7h05min). A ROI-based mono-T2* estimation was performed in the corpus callosum (CC) and in the cortical bone (CB)3,10, following the model $$$S(t)=S_0e^{-t/T_2*}+C$$$, where $$$C$$$ accounts for background noise, residual long-T2 signal and potential radial artifacts.Results
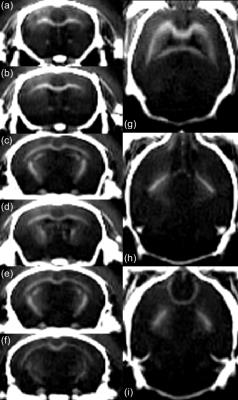
Fig. 3 shows axial and coronal views of the acquired head using the proposed method. A suitable suppression is obtained over the long-T2 component, offering a positive contrast over myelinated areas in WM (CC, anterior and posterior commissures, cerebellar peduncle, striatum, optic tract, internal capsule and fimbria) and in CB. Fig. 4 shows accurate T2* estimations of the fast relaxing component in CC ($$$R^2$$$=0.99) and CB ($$$R^2$$$=0.99), with estimated values of 62.1 $$$\mu$$$s and 260.1 $$$\mu$$$s, respectively.Conclusion
We have shown that a T2* quantification over short-T2 components while suppressing the undesired long-T2 component in a 3D experiment in a mouse head was made possible using the proposed method. The long scan time is a consequence of the small voxel dimension and the low relative proton density of myelin semi-solid pool in the WM (~4% in a human WM, implying a mandatory averaging to yield a reasonable SNR). The method shows to be compatible with high performance scanner, therefore lifting these limitations in a clinical application (e.g. because of a wider myelin volume).Acknowledgements
The authors thank Dr. Arnaud Duchon for mouse head preparation.References
1. Horch, R. et al., Origins of the ultrashort-T2 1H NMR signals in myelinated nerve: A direct measure of myelin content?, MRM 2011; 66:24-31
2. Wilhelm, M. et al., Direct MR detection of myelin and prospects for quantitative imaging of myelin density, PNAS 2012; 109:9605-9610
3. Du, J. et al., Ultrashort echo time (UTE) magnetic resonance imaging of the short T2 components in white matter of the brain using a clinical 3T scanner, NeuroImage 2014; 87:32-41
4. Du, J. et al., Measurement of T1 of the Ultrashort T2* Components in White Matter of the Brain at 3T, 2014 PLoS ONE; 9:e103296
5. Larson, P. et al., Designing long-T2 suppression pulses for ultrashort echo time imaging, MRM 2006; 56:94-103
6. Weigel, M., Extended phase graphs: Dephasing, RF pulses, and echoes - pure and simple, JMRI 2015; 41:266-295
7. Yarnykh, V. et al., Actual flip-angle imaging in the pulsed steady state: A method for rapid three-dimensional mapping of the transmitted radiofrequency field, MRM 2007; 57:192-200
8. Nehrke, K., On the steady-state properties of actual flip angle imaging (AFI), MRM 2009; 61:84-92
9. Sussman, M., Design of practicalT2-selective RF excitation (TELEX) pulses, MRM 1998; 40:890-899
10. Chen, J. et al., Fast volumetric imaging of bound and pore water in cortical bone using 3D-UTE and inversion recovery UTE sequences, NMR in Biomedicine 2016; 29:1373-1380
Figures


