4027
The Value of Ultrashort-Echo-Time (UTE) MR in Depiction of the Eustachian Tube at 3 Tesla1Shandong Medical Imaging Research Institute, Shandong University, Jinan, People's Republic of China, 2MR Collaborations NE Asia, Siemens Healthcare, 3Shandong Provincial Hospital Affiliated with Shandong University, 4Siemens Shenzhen Magnetic Resonance Ltd., Shenzhen, People's Republic of China
Synopsis
This study aimed to investigate the feasibility of ultrashort echo time (UTE) in visualizing the Eustachian tube (ET). Nineteen healthy volunteers were involved in this study. The quality of images was rated by two experienced radiologists using a double-blind method. Using the depiction of the cartilaginous part of the ET from standard T2-weighted images and that of the bony part from CT acquisition as reference points, UTE images were analyzed. The results indicate that UTE can not only display ET cartilage, but also display bone structure. This could lead to the application of whole-ET imaging in one MR exam.
Purpose
The Eustachian tube (ET) is a connection between the tympanum and the nasopharynx, and plays an important role in protection, clearance, and normal ventilation of the middle ear [1]. At present, endoscope technology provides a direct and effective means for pathophysiologic research related to ET disease and dysfunction; however, endoscopy for ET analysis is limited by the small diameter of the endoscope, which limits display of the overall shape of the ET. Currently, the cartilaginous structure of the ET can be visualized by magnetic resonance imaging (MRI) [2]. However, detection of the bony structures of the ET rely on CT, due to the extremely short T2 of compact bone using MRI. Therefore, it is difficult for an examination method to detect the cartilage and bone structure of ET at the same time. Ultra-short echo time (UTE) imaging uses a short and high-amplitude excitation pulse, and measures echo and readout in a very short time after RF excitation [3]. This study aims to explore the feasibility of UTE in visualization of ET.Methods
Nineteen healthy volunteers were involved in this study. The subjects were placed supine with head-first position. The scanning scheme consisted of T2-SPACE with water excitation, UTE scan with a prototype sequence, and CT scan. MR data were collected on a MAGNETOM Skyra 3T MR scanner (Siemens Healthcare, Erlangen, Germany) using a 16-channel head coil. The parameters were as follows: T2-SPACE imaging: repetition time/echo time (TR/TE) 14.1/5.0ms, flip angle 25°, number of slices 56, slice thickness 0.8mm, distance factor 20%, field of view (FOV) 220×220mm², voxel size 0.9×0.9×0.9mm3; prototype UTE imaging: TR 10ms, TE1 0.06ms, TE2 3.54ms, flip angle 20°, number of slices 256, slice thickness 0.8mm, FOV=200×200mm², voxel size 0.8×0.8×0.8mm3; CT images: KV 100, mAs 201, pitch 0.75, voxel 0.6×0.6mm3, FOV 160mm, slice thickness 0.6mm. The images were then post-processed on a syngo.via workstation (Siemens Healthcare, Erlangen, Germany) using MR 3D tools (T2-SPACE, CT images) and a subtraction tool (UTE images).The UTE images were compared with both T2-SPACE and CT images. The quality of the images was rated using a scale of 0 (non-depiction), 1 (depiction), 2 (good depiction) to 3 (excellent depiction) by two radiologists blindly. The inter-observer agreement was assessed using kappa statistic. Statistical analysis was performed using SPSS software (version 17, SPSS Inc.). A value of p<0.05 was considered statistically significant.Results
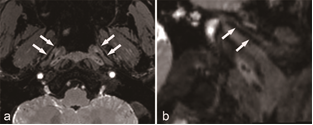
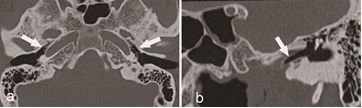
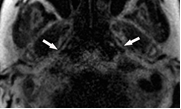
Among all subjects, T2-SPACE images successfully displayed the cartilaginous part of the ET (Fig 1). The visualization scores of both readers were 3.23±0.67 and 3.22±0.71. The inter-observer agreement was good (κ=0.788). CT images fully showed the bony part of the ET among all subjects (Fig 2). The visualization scores of both readers were 3.13±0.48 and 3.43±0.79. The inter-observer agreement was excellent (κ=0.806).UTE images successfully displayed both the cartilaginous and bony part of ET (Fig 3). For both observers, the ET mean visualization scores were 2.75±0.47 and 2.53±0.60. The inter-observer agreement was good (κ=0.796).Discussion
In all volunteers, the anatomical landmarks and structures of the ET cartilage were clearly depicted in the T2-SPACE images. In this region, the amount of soft tissue is small and consists only of the mucous membrane, connective tissue, and the periosteum. Neither air nor bone contributes to the signal on T2-SPACE images. Therefore, the bony part of the ET was shown with inferior image quality than the cartilage part. CT is now a widely used imaging modality, but CT cannot detect the ET lumen. While the importance of the ET for proper function has been recognized, it has been difficult to evaluate this important anatomic structure using conventional MRI and CT techniques. Thanks to new technical developments, the bony part of ET that were undetectable on conventional MR images, can now be visualized using UTE techniques.Conclusion
By analyzing the depiction of ET from UTE images and comparing with MR and CT images, we found that UTE images could not only display ET cartilage that can be seen by conventional MR sequences, but also could display bone structure that previously could only be seen on CT images. UTE can provide a convenient and new method to display the overall shape of the ET.Acknowledgements
.References
1. Anna Lükens, Ercole DiMartino, Rolf W. Günther, Gabriele A. Krombach. Functional MR imaging of the Eustachian tube in patients with clinically proven dysfunction: correlation with lesions detected on MR images. Eur Radiol. 2012: 22:533–538.
2. Oshima T, Kikuchi T, Hori Y, Kawase T, Kobayashi T. Magnetic resonance imaging of the eustachian tube cartilage. Acta Otolaryngol. 2008; 128:510-514.
3. Eric Y. Chang, Jiang Du, Christine B. Chung. UTE imaging in the musculoskeletal system. J Magn Reson Imaging. 2015, 41(4):870-883.
Figures