4010
Reducing the effects of under-sampling in images acquired with a 3D radial sequence for the purposes of real-time navigation.1Division of Biomedical Engineering, Department of Human Biology, University of Cape Town, Cape Town, South Africa, 2Department of Radiology, Athinoula A. Martinos Center for Biomedical Imaging, Massachusetts General Hospital, Boston, MA, United States
Synopsis
Radial sequences hold great potential for real-time navigation in MRI. Navigator images can be produced off very few spokes of sampled data however, characteristic streaking artifacts appear due to under-sampling at the outer edges of the k-space field of view. In this study, a method is proposed to reconstruct navigator images with a reduced base resolution to minimize the effects of under sampling and reduce the appearance of streaking artifacts, improving the accuracy of motion-registration. The success of this method supports the pursuit of radial sequences for applications in real-time navigation.
Introduction
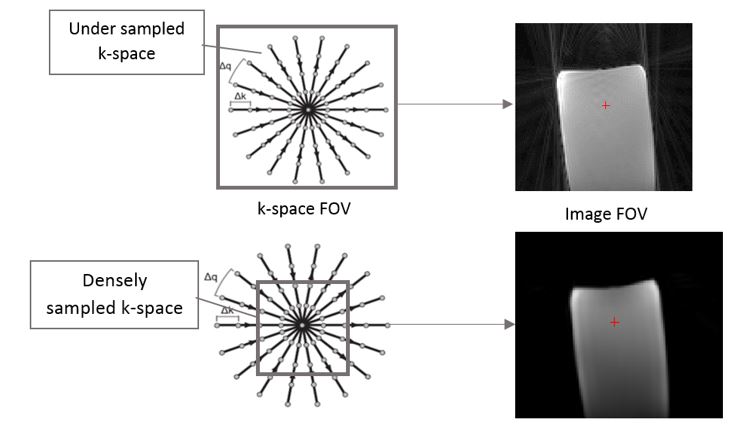
Radial sequences hold great potential for real-time navigation in MRI. Data are sampled along a series of diametric spokes each passing through the k-space origin, resulting in a final distribution where the central region of k-space is more densely sampled than the outer region1. This enables the reconstruction of images with good contrast and signal from very few sampled spokes. In comparison, Cartesian sequences are not robust to the effects of under-sampling2, suggesting that radial sequences may be better suited to rapidly produce navigator images whilst scanning for the purpose of real-time navigation. Unfortunately, images produced by radial sequences suffer from characteristic Nyquist or “streaking” artifacts due to under-sampling of the outer regions of k-space1, which compromise the accuracy of co-registration. Here we propose a method to reduce the appearance of these artifacts.Methods
The Siemens cardiovascular (3D, GRE) pulse sequence was modified to sample data with a new trajectory3 along a series of diametric spokes in k-space whose end points mapped a spiral pattern on the surface of a sphere. During a single acquisition, multiple sub-volumes of data were sampled and then reconstructed offline4 to generate a series of navigator images that provided information on the motion of the object during scanning. The minimum number of diametric spokes required to produce navigator images with sufficient information for motion registration was predetermined to be N=512, corresponding to an acquisition time of 2.6 s per sub-volume. A method was then implemented to enable reconstruction of navigator images at a reduced base resolution (BR). Therefore, only data from the densely sampled central region of k-space would be included during reconstruction, minimizing the effects of under-sampling on the images produced.
Experiments
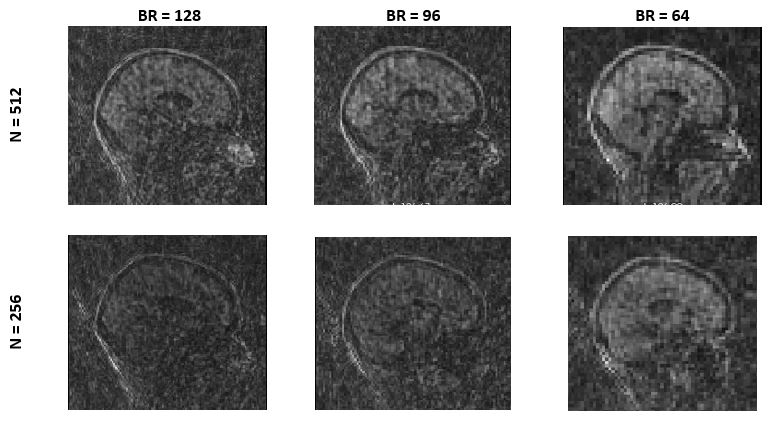
All scans were acquired on a 3T Magnetom Skyra (Siemens Medical Solutions, Erlangen, Germany) using a 32 channel Siemens head coil. Typical scan parameters were: 300 mm FOV, matrix size 128x128x128, TE/TR 1.65/4.9 ms, 1002 Hz/px, flip angle 8o. A single sub-volume acquired during a phantom scan was reconstructed at BRs of 128 and 64 to determine the effect on the appearance of streaking image artifacts.
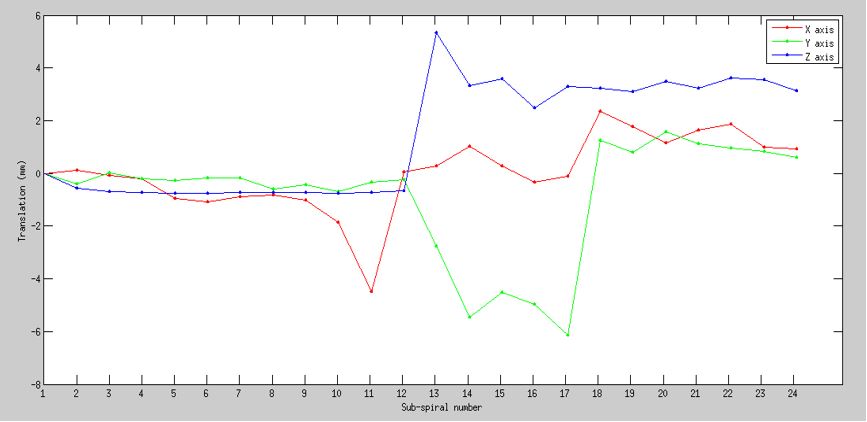
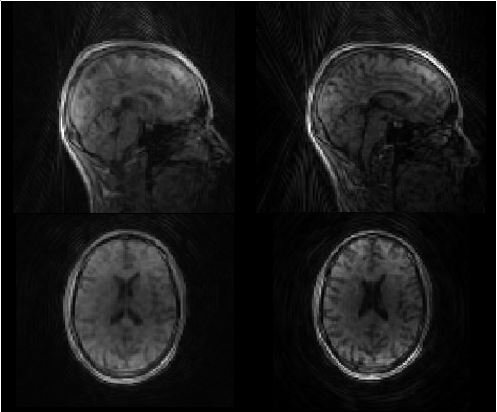
An adult volunteer was then asked to nod their head during two radial acquisitions, one with 24 sub-volumes of N=512 spokes and the other with 48 sub-volumes of N=256 spokes, each with BR = 128. We first compared single sub-volumes from each acquisition reconstructed at base resolutions of 128 (the scanned resolution), 96 and 64. Series of Affine transformation matrices were then generated for each acquisition by co-registering sub-volumes using FLIRT5 in FSL. The set of 24 sub-volumes were reconstructed at the scanned BR of 128 prior to co-registration, while the set of 48 sub-volumes were reconstructed at a reduced BR of 64. Motion-curves were plotted in Matlab. Finally, the set of 48 navigator images were reconstructed again at the scanned BR of 128, and their respective transformation matrices were applied, before combining them in image space to generate a final motion-corrected volume.
Results and Discussion
There is a significant reduction in streaking artifacts within images reconstructed at a reduced BR (Fig.1). For navigator images of the adult brain, reconstruction at a reduced BR visibly improves both the contrast and signal-to-noise ratio (SNR) (Fig.2) providing greater detail at the expense of spatial resolution, which may be acceptable for navigator images when robust motion-registration software can be used. Figures 3 and 4 show motion plots generated by co-registering navigator images reconstructed at a base resolution of 128 for the set of sub-volumes with 512 spokes and BR=64 for the set of sub-volumes with 256 spokes, respectively. A motion-corrected volume was generated by combining co-registered navigator images (Fig.5), producing an image with more detail than that obtained when combining k-space data prior to image reconstruction.
The results indicate
that fewer spokes can be used for more rapid navigator image acquisitions that
are still capable of providing accurate motion-registration results when the
method of reconstructing at a reduced base resolution is implemented. In this way
a minimum sub-volume acquisition time of 1.25 s was achieved.
Conclusion
This
study shows that reconstructing radially sampled data at a reduced base
resolution minimizes the effects of under-sampling on reconstructed images. The
effects include a reduction in the appearance of streaking artifacts,
improvements in image contrast and SNR at the expense of spatial resolution
which did not affect the accuracy of motion-registration in this case.
Additionally, this method allows for faster image reconstruction and improves
the temporal accuracy of a navigating sequence. These findings support the
pursuit of radial sequences for applications in real-time navigation.
Acknowledgements
Research funding was provided by the South African Research Chairs Initiative, the National Research Foundation of South Africa, the University of Cape Town and NIH grants R21AA017410, R21AG046657, R01HD071664 and R01HD085813 .References
1)K. T. Block, “Advanced Methods for Radial Data Sampling in Magnetic Resonance Imaging,” Ph.D. Dissertation, Gottingen University, Gottingen, 2008.
2) Block, K. T., Chandarana, H. & Milla , S. et al., 2014. Towards Routine Clinical Use of Radial Stack-of-Stars 3D Gradient-Echo Sequences for Reducing Motion Sensitivity. Journal of the Korean Society of Magnetic Resonance in Medicine, 18(2), pp. 87-106.
3) Bhat, H., Ge, L. & Li, D. et. al., 2011. 3D Radial Sampling and 3D Affine Transform-based Respiratory Motion Correction Technique for Free-breathing Whole-Heart Coronary MRA with 100% Imaging Efficiency. Magnetic Resonance in Medicine, Volume 65, pp. 1269-1277.
4) A. J. W. van der Kouwe and H. Bhat, “Motion Correction for 3D Radial Encoded Spoiled Gradient Echo Imaging of the Head,” Proc. International Society for Magnetic Resonance in Medicine, vol. 20, p. 3413, 2012.
5) M. Jenkinson, P. Bannister, J. Brady and S. Smith, “Improved optimisation for the robust and accurate linear registration and motion correction of brain images,” NeuroImage, vol. 17, no. 2, pp. 825-841, 2002.
Figures