3997
Application of Random Forest Regression for Fast and Robust MRF Dictionary Matching1Medical Imaging Research Centre, Dayananda Sagar Institutions, Bangalore, India, 2Institute of Surgical Technology and Biomechanics, University of Bern, Bern, Switzerland
Synopsis
Magnetic Resonance Fingerprinting (MRF) provides for simultaneous generation of MR multi-parametric maps from a single acquisition. In this work, a machine learning based regression method that does not require a dictionary has been demonstrated. A leave-one-out evaluation strategy was employed for numerical evaluation of the proposed MRF-RF approach. A comparative study was performed on two previously employed matching methods. Results depict that proposed MRF-RF method produces maps similar to the vector dot product approach, with a 10-fold saving in time. The method can also be extended to other non-linear maps such as B0 inhomogeneity, diffusion maps, and perfusion maps.
Purpose
MRF is a recently proposed technique for simultaneous generation of MR multi- parametric maps such as T1 and T2 from a single acquisition1. However, MRF reconstruction poses a high computational demand due to the inherent requirement of dictionary matching2. In this work, we propose a supervised learning method based on regression forest3 for MRF reconstruction. Contrary to previous approaches, the proposed regression method does not require a dictionary for MRF reconstruction, and can simultaneously generate accurate parametric maps in a computationally efficient fashion (eg. < 2min for a brain scan).Materials and Methods
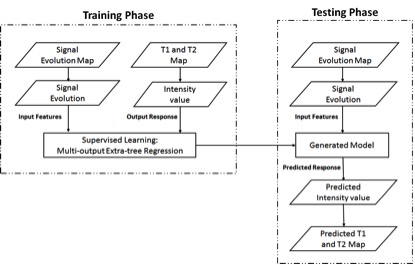
Six datasets were acquired with 108 signal evolutions of brain images using the PSIF (mirrored FISP) sequence on a SIEMENS 1.5T Avanto scanner. The data was acquired with the following parameters: TR/alpha ranging from 15-68ms/17-35 respectively with minimum echo time (TE) 4.8. We cast our solution to the MRF reconstruction as a multi-output extra-tree regression3 problem as depicted in figure 1, which aims to establish the non-linear relationship between signal evolutions and parametric maps. The regression algorithm builds an ensemble of 40 regression trees. The splitting of nodes of the trees was based on the variance reduction measure3. Each node of the tree was recursively split until it reached the minimum sample size 5. The leaf was assigned with a vector of intensity values once the tree had grown. The estimates of each tree were then aggregated by arithmetic average to yield a final prediction. A leave-one-out evaluation strategy was employed for numerical evaluation of the proposed MRF-RF approach. The random forest method and MRF-Partial Least Square (PLS)5 were compared with dot vector product matching4 (PnP-DP). A dictionary was generated using the analytical equation6 for PSIF sequence for the vector product and PLS methods.TR/alpha ranging from 0-100ms/0-90, T1 ranging from 100-5000ms and T2 ranging from 20-2000ms were considered for dictionary building. The range for T1 considered was 100 to 2000ms in steps of 20, 2000 to 5000 in steps of 300. The range for T2 considered was 20 to 100ms in steps of 10, 100 to 200 in steps of 50 and 200 to 3000 in steps of 200. From the generated dictionary, T1 and T2 maps were obtained through PnP-DP4,5 approach.Results
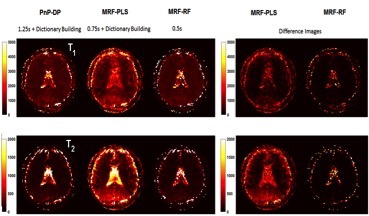
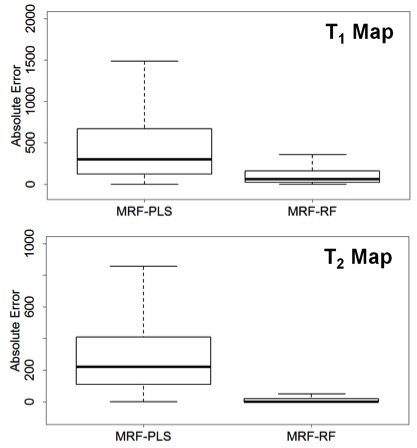
Figure 2 demonstrates the quantitative T1 and T2 reconstructed maps for PnP-DP matching, MRF-PLS matching and proposed MRF-RF approach. Absolute difference images are also provided. Qualitative results show that the proposed MRF-RF approach offers better prediction than MRF-PLS matching for both T1 and T2 maps. Figure 3 depicts the box plots of absolute prediction error computed for all the pixels of the T1 and T2 map, following the LOO strategy. Quantitative results obtained by MRF-PLS matching and proposed MRF-RF approach was also compared. Results show fairly accurate predictions for both T1 and T2 maps.Discussion and Conclusion
Proposed MRF-RF approach represents a 10-fold speedup compared to the PnP-DP4,5 approach. Advantage is better scalability to data compared to PnP-DP4,5 approach which requires more computation time as the dictionary grows. Further, multi-output features enable simultaneously prediction of accurate parametric maps. According to our knowledge this is the first supervised learning based study for MRF reconstruction without using dictionary. The study also shows the potential of supervised learning approaches in predicting other parametric maps. The approach can be extended to other non-linear maps such as B0 inhomogeneity, diffusion maps, and perfusion maps.Acknowledgements
1. This work was supported by Vision Group on Science and Technology (VGST), Govt. of Karnataka, Karnataka Fund for strengthening infrastructure(K-FIST), GRD#333/2015
2. Department of Science and Technology (DST), Govt. of India under the program Technology Systems Development (TSD) for the project “Novel acquisition and reconstruction strategies to accelerate magnetic resonance imaging using compressed sensing”, No: DST/TSG/NTS/2013/100-G.
3. Department of Information Technology (DIT), Govt. of India for the project "Indigenous - Magnetic Resonance Imaging (I-MRI)- A national Mission"
References
1) Ma, Dan, et al. "Magnetic resonance fingerprinting." Nature 495.7440 (2013): 187-192.
2) Cauley et al. “Fast Group Matching for MR Fingerprinting Reconstruction”, Magn.Reson.Med, August 2016.
3) Geurts et al. “Extremely randomized trees”, Machine Learning, pp.3-42, vol 63, 2006.
4) Chikop et al “Plug-n-Play Magnetic Resonance Fingerprinting” ISMRM- 2015.
5) Chikop et al. “Application of Partial Least Squares regression for Fast and Robust Dictionary Matching for Magnetic Resonance Fingerprinting”, ISMRM 2016.
6) Hanicke W et al. Magn. Reson. Med. 2002; 10:2357.
Figures