3993
Machine-learning-based treatment response stratification for trans-arterial chemoembolization in HCC patients.1Medical Imaging Technologies, Siemens Medical Solutions USA, Princeton, NJ, United States, 2MR Application Predevelopment, Siemens Healthcare, Erlangen, Germany, 3The Russell H. Morgan Department of Radiology and Radiological Sciences, Johns Hopkins University School of Medicine, Baltimore, MD, United States, 4Siemens Healthcare, Baltimore, MD, United States
Synopsis
In determining the effectiveness of chemoembolization in HCC, functional MRI has been shown to differentiate responders and non-responders earlier than anatomical measurements such as RECIST or EASL criteria. In previous studies, multiparametric response criteria based on thresholds of changes in ADC and venous enhancement (VE) intensities were proposed. We present improved stratification based on machine learning and image-based features. On a set of 57 chemoembolization patients, the proposed approach achieved a mean classification accuracy of 84% versus 66% for the previous threshold-based approach. These results further demonstrate the incremental value of functional MRI over traditional anatomical measures.
PURPOSE
Functional MRI has been shown to effectively identify responders to chemoembolization for treatment of hepatocellular carcinoma (HCC) over anatomical measures such as RECIST or EASL, thereby allowing for earlier responder determination and therefore better patient care. Previous studies used ADC and venous enhancement (VE) percent change thresholds [1]. We make use of machine learning approaches and identify useful spectral and textural features to enhance patient response stratification.METHODS
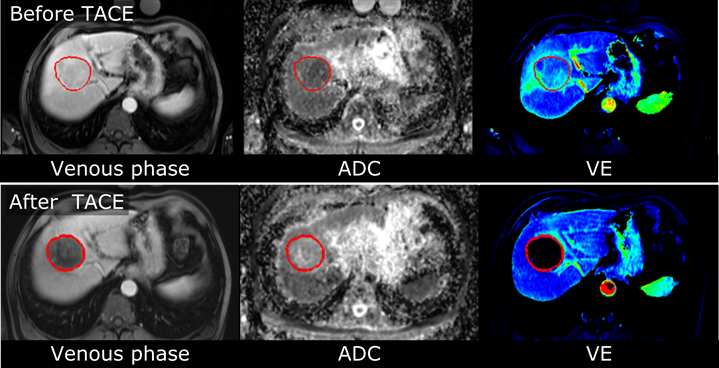
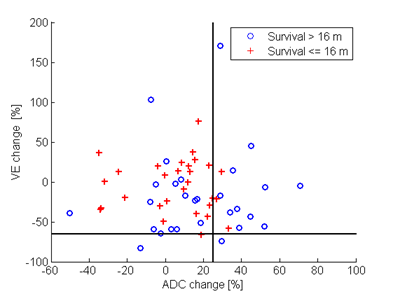
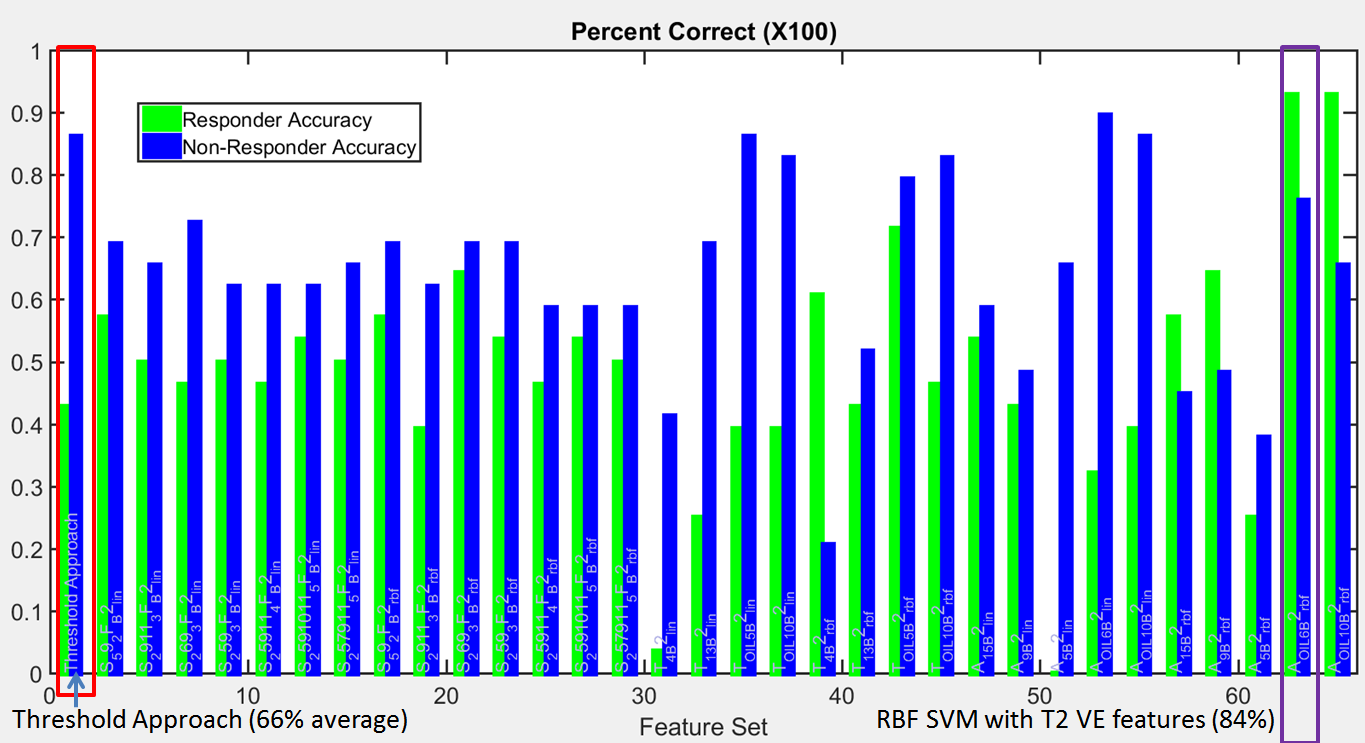
A total of 57 patients undergoing chemoembolization for liver tumors were analyzed in this retrospective study. Functional MR images were obtained prior to and approximately one month after the procedure using 1.5 T MRI scanners (MAGNETOM Avanto; Siemens Healthcare, Erlangen, Germany). Each tumor was semi-automatically segmented using the MR OncoTreat prototype software at both time points [1]. All images of each sequence were elastically co-registered using the portal-venous-phase T1-weighted images as reference. The patients’ median survival of 16 months was used as a cut-off to differentiate between the two classes of long-term responders (survival >16 months) and non-responders (survival ≤16 months). Figure 1 shows an example from one case. Two classification approaches were evaluated: (1) The threshold-based approach from [1], where patients with an increase by at least 25% in the volumetric mean ADC and / or with a decrease by at least 65% in mean VE were considered as responders (Figure 2); (2) support vector machine (SVM) classification based on percent change in various volumetric spectral and textural features [2] of ADC, VE and T2-weighted, fat-saturated image signal intensity resulting in a total of 480 features. A subset of 10 useful features were determined using correlation-based feature selection [3] and sub-combinations of those features were evaluated by leave-one-out cross correlation with an SVM with linear and radial basis functions (Figure 3) [4].RESULTS
Example images of a patient with parametric response and a 55 month survival time (responder) are shown in Figure 1. An overview of the distribution of the mean ADC and VE changes in the study population is given in Figure 2. The classification accuracy of machine learning approaches result in more balanced sensitivity and specificity than that of the threshold-based approaches. The approach based on the original method (1) resulted in sensitivity and specificity of 46 % / 86 %, respectively for predicting non-responders to the treatment (i.e., short survival time), while the machine learning approach (2) performance was 93 % / 76 % sensitivity / specificity using selected features. This results in a mean accuracy of 66% and 84% for the previous and proposed approaches respectively. For SVM classification, the signal intensity in T2-weighted images provides improved classification performance with textural features. Textural features in the venous enhancement map also were found to increase the classification accuracy. Figure 3 shows the SVM classification results across different feature sets. Notably, the best performing feature set contained VE map skewness and cluster tendency features as well as correlation and variance of textures in the T2-weighted images.DISCUSSION
The proposed approach improves the differentiation of responders and non-responders compared to traditional approaches. Our investigation has yielded features that are more effective for response stratification. These include the T2-weighted image signal intensity and textural features of correlation and variance. Cluster tendencies in the VE volumes provide excellent discrimination between responders and non-responders. In future work, additional available phases of contrast enhancement and other MR contrasts will be considered in a larger patient population to allow for further improvements in stratification and survival prediction. The additional patient population will also allow for more data-driven approaches to be explored. Multiparametric MRI has promise to identify and predict responders to tumor treatment earlier than anatomical measures and can lead to more effective patient care.Acknowledgements
No acknowledgement found.References
1. Bonekamp, S., Halappa, V. G., Geschwind, J.-F. H., Li, Z., Corona-Villalobos, C. P., Reyes, D., … Kamel, I. R. (2013). Unresectable hepatocellular carcinoma: MR imaging after intraarterial therapy. Part II. Response stratification using volumetric functional criteria after intraarterial therapy. Radiology, 268(2), 431–439.
2. Kurani, A., Xu, D., Furst, J., & Raicu, D. (2004). Co-occurrence matrices for volumetric data. 7th IASTED International Conference on Computer Graphics and Imaging, 447–452.
3. Hall, M. A. (2015). Correlation-based Feature Selection for Discrete and Numeric Class Machine Learning., Proceeding ICML '00 Proceedings of the Seventeenth International Conference on Machine Learning, 359–366.
4. MATLAB and Statistics Toolbox Release 2012b, The MathWorks, Inc., Natick, Massachusetts, United States.
Figures