3990
Deep Mapping: Using deep convolutional neural networks to estimate quantitative T1 maps trained on a 7 T minimum deformation average model1Centre for Advanced Imaging, University of Queensland, Brisbane, Australia
Synopsis
Deep convolutional neural networks are increasingly being used to solve challenging medical image processing tasks. The acquisition of high resolution quantitative parameter maps in MRI, such as T1 and quantitative susceptibility maps often require long or additional acquisitions and post-processing steps. We therefore trained a convolutional neural network on a minimum deformation model of MP2RAGE data acquired at 7 T and show the feasibility of computing T1 maps from single subject data.
Purpose
The acquisition of high resolution quantitative parameter maps in MRI, such as T1 and quantitative susceptibility maps often require long or additional acquisitions and post-processing steps. It could therefore be advantageous to train a deep convolutional neural network on a large database of images to predict these maps from standard clinical imaging data. Due to the availability of powerful GPUs, deep learning based methods are increasingly being used to solve a large variety of challenging medical image processing tasks in an efficient manner. Three dimensional fully convolutional neural networks (FCN) were for example used to learn an end to-end nonlinear mapping from MR image to CT image data1. Others implemented image segmentations2,3 or trained a convolutional neural network to predict higher image resolutions4. We attempted to train a convolutional neural network on a T1 map generated using minimum deformation averaging and show that such a network can predict quantitative parameter maps.Methods
After approval by the local human ethics committee and written informed consent, we scanned 116 participants (63 males, 20-77 years of age, 40 years mean age) using a 7T whole-body research scanner (Siemens Healthcare, Erlangen, Germany) with a gradient strength of 70 mT/m, slew rate of 200 T/m/s and a 32-channel head coil (Nova Medical, Wilmington, USA). T1w images and T1 maps were acquired using the prototype MP2RAGE sequence (WIP 900) with a range of resolutions: 0.5mm (40 indiv.), 0.75mm (41), 1.0mm (8) and 1.25mm (1) isotropic. Common image parameters were TR = 4330ms, TI1/TI2 = 750/2370ms, TE=2.8ms, flip angles = 5 degrees, and GRAPPA = 3.
The MP2RAGE denoised images5,6 were used to create a probabilistic model7–9. The fitting strategy consisted of one linear fit to the evolving internal model followed by a hierarchical series of non-linear grid transforms. These transforms started with a step size of 32mm followed by 16mm, 12mm, 8mm, 6mm, 4mm, 2mm, 1.5mm, 1mm, and finished with 0.8mm. These fitting steps use progressively de-blurred data with a 3D kernel FWHM of half the current step size. Twenty iterations at the first 5 fitting stages, 10 iterations at next 3 stages and 5 iterations at the last 2 stages were performed using the ANIMAL algorithm10. As the step size decreased the resolution of the evolving model to which data was being fit was increased, starting with a step size of 1.0mm and finishing with a resolution of 0.3mm. It is possible to increase the resolution to this point as there is overlapping information which allows the extraction of sub-voxel boundary information. A robust averaging process was used to reduce the effect of artefacts. The transformations were then applied to the MP2RAGE T1 maps and the UNI images from the MP2RAGE sequence and averaged using the robust averaging procedure.
A deep convolutional neuronal network (MatConvNet, http://www.vlfeat.org/matconvnet/) implemented in Matlab 2016a (Mathworks) was trained on a Tesla K40c card. The network consisted of 3 convolutional layers followed by rectified linear unit layers and a final prediction layer. The network was trained on 4000 32x32x32 patches randomly extracted from the UNI and T1 model data, which were masked using BET11 to exclude non brain tissue (see Figure 1). 500 epochs were trained with a learning rate of 0.02, a batch size of 16 and 20 percent validation data in 6 hours.
Results & Discussion
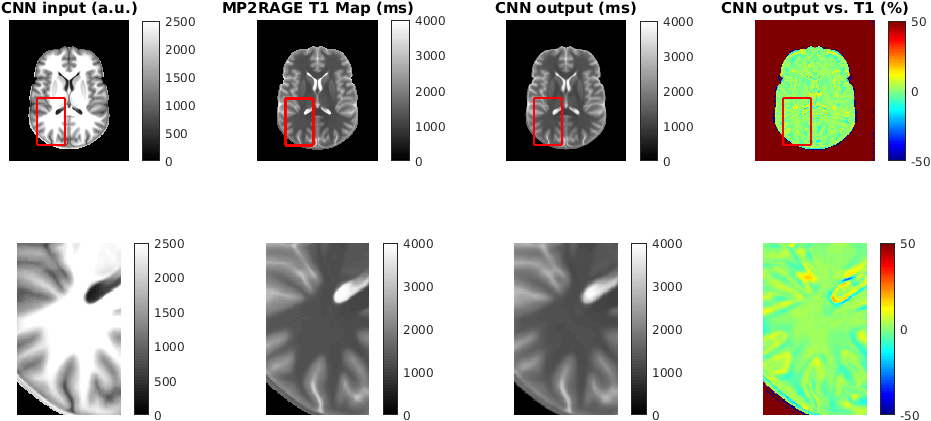
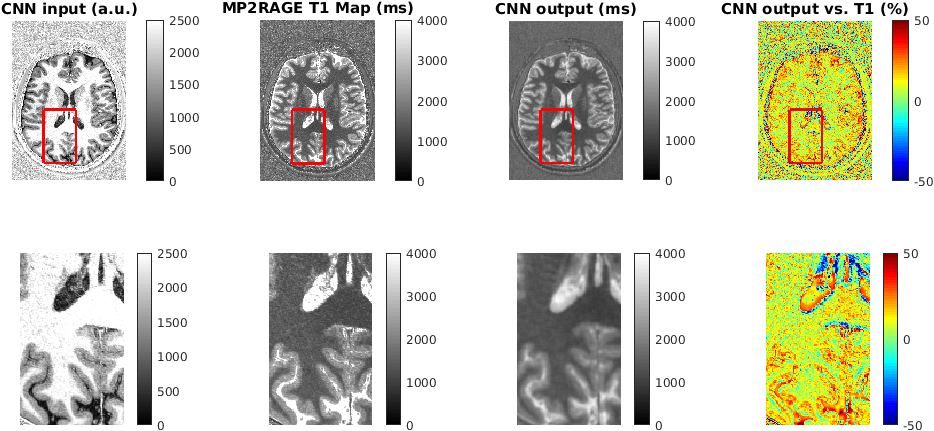
A single subject UNI data set was used to test the trained network and to predict a T1 map (see Figure 2). The output of the network shows a T1 map which matches the values of the MP2RAGE T1 map within less than 10 % in most areas. However, the difference between predicted and MP2RAGE computed T1 map can be as high as 50 % at CSF/gray matter boundaries and could be caused by a clipping of T1 values in CSF during the lookup procedure in the MP2RAGE T1 map computation. The ability to compute T1 values in these regions is an advantage of the proposed deep learning approach. However, the convolutional filters introduce an additional smoothing, which needs to be reduced by optimizing the filter architecture and training procedure.Conclusions
Our results suggest that deep convolutional neural networks can be used to learn the relationship between MP2RAGE data and T1 maps.Acknowledgements
The authors acknowledge the scientific support of Kieran O’Brien, Siemens Ltd, Bowen Hills, Australia and the facilities of the National Imaging Facility at the Centre for Advanced Imaging, University of Queensland. SB acknowledges funding from UQ Postdoctoral Research Fellowship grant and support via an NVIDIA hardware grant. MB acknowledges funding from ARC Future Fellowship grant FT140100865.References
1. Nie, D., Cao, X., Gao, Y., Wang, L. & Shen, D. in Deep Learning and Data Labeling for Medical Applications (eds. Carneiro, G. et al.) 170–178 (Springer International Publishing, 2016). doi:10.1007/978-3-319-46976-8_18
2. Choi, H. & Jin, K. H. Fast and robust segmentation of the striatum using deep convolutional neural networks. J. Neurosci. Methods 274, 146–153 (2016).
3. Nie, D., Wang, L., Gao, Y. & Shen, D. FULLY CONVOLUTIONAL NETWORKS FOR MULTI-MODALITY ISOINTENSE INFANT BRAIN IMAGE SEGMENTATION. Proc. IEEE Int. Symp. Biomed. Imaging Nano Macro IEEE Int. Symp. Biomed. Imaging 2016, 1342–1345 (2016).
4. Bahrami, K., Shi, F., Rekik, I. & Shen, D. in Deep Learning and Data Labeling for Medical Applications (eds. Carneiro, G. et al.) 39–47 (Springer International Publishing, 2016). doi:10.1007/978-3-319-46976-8_5
5. O’Brien, K. R. et al. Dielectric pads and low- B1+ adiabatic pulses: Complementary techniques to optimize structural T 1 w whole-brain MP2RAGE scans at 7 Tesla: How to Acquire Whole-Brain MP2RAGE at 7T. J. Magn. Reson. Imaging 40, 804–812 (2014).
6. O’Brien, K. R. et al. Robust T1-Weighted Structural Brain Imaging and Morphometry at 7T Using MP2RAGE. PLoS ONE 9, e99676 (2014).
7. Janke, A. L. & Ullmann, J. F. P. Robust methods to create ex vivo minimum deformation atlases for brain mapping. Methods 73, 18–26 (2015).
8. Grabner, G. et al. in Medical Image Computing and Computer-Assisted Intervention–MICCAI 2006 58–66 (Springer, 2006).
9. Janke, A. L., O’Brien, K., Bollmann, S., Kober, T. & Barth, M. A 7T Human Brain Microstructure Atlas by Minimum Deformation Averaging at 300μm. in ISMRM (2016).
10. Collins, D. L., Neelin, P., Peters, T. M. & Evans, A. C. Automatic 3D intersubject registration of MR volumetric data in standardized Talairach space. J. Comput. Assist. Tomogr. 18, 192–205 (1994).
11. Smith, S. M. Fast robust automated brain extraction. Hum. Brain Mapp. 17, 143–155 (2002).
Figures