3964
IR-TSE MRF: Rapid and Accurate Parametric Mapping Using Inversion-recovery Turbo Spin Echo and MR Fingerprinting1Center for Brain Imaging Science and Technology, Department of Biomedical Engineering, Zhejiang University, Hangzhou, People's Republic of China
Synopsis
This study proposes a rapid and accurate MR fingerprinting (MRF) framework based on inversion-recovery turbo spin echo (IR-TSE) sequence. Compared with the conventional quantitative imaging method and FISP-MRF, the proposed one can provide T2 maps with high accuracy in addition to T1 and proton density (PD) for whole brain in about 6 minutes. In this regard, this new MRF strategy would potentially aid in achieving high resolution quantitative mapping for T2-sensitive circumstances such as epilepsy and multiple sclerosis applications.
Purpose
A recent proposed MR fingerprinting (MRF) approach and its related works1,2 have shown a potential to rapidly and simultaneously obtain T1, T2 and PD maps. However, since the T2 map estimated by conventional MRF method utilizes gradient echo sequence with short TE, in which the signal is inevitably mixed with T2* decay, the T2 map is affected by T2* effect and thus prone to errors during the MRF acquisitions. In this study, we combine the IR-TSE imaging with MRF framework, dubbed IR-TSE MRF, to obtain the accurate multi-parametric quantitative mapping, especially more accurate T2 maps in a reasonable time.Method
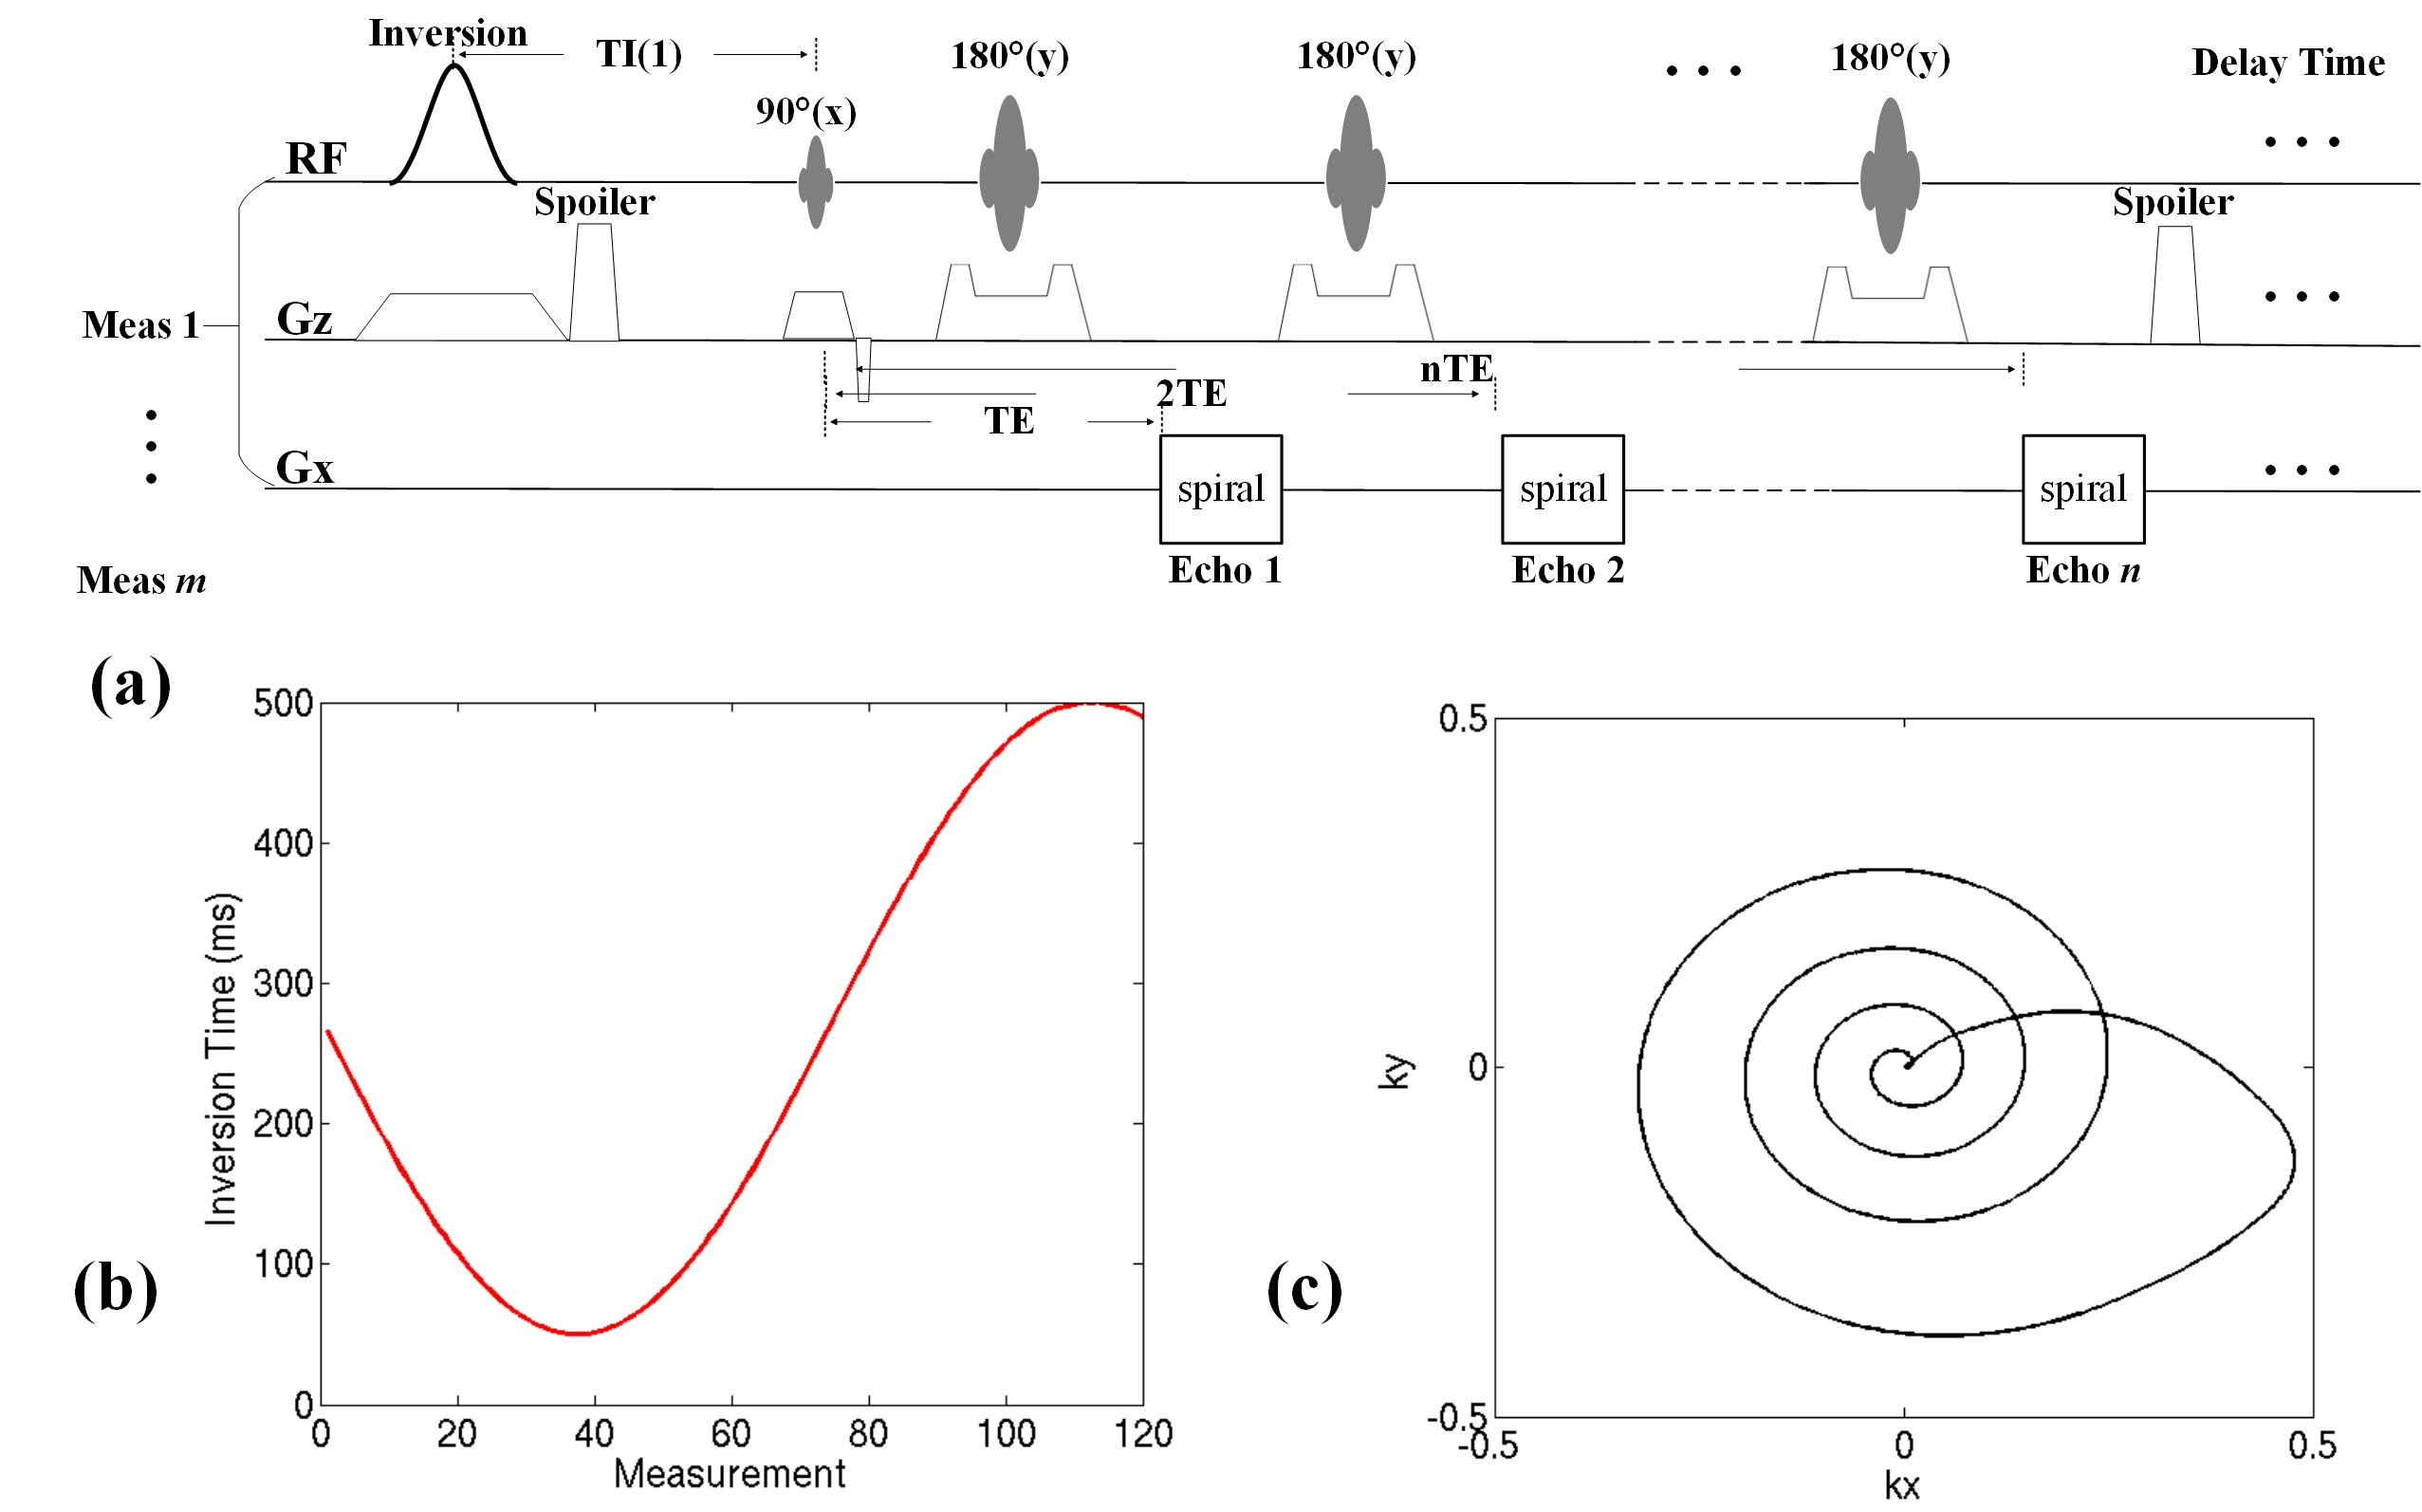
The procedure of our proposed IR-TSE MRF includes the following steps: (i) For acquisition, inversion-recovery turbo spin echo (IR-TSE) sequence with multiple measurements was utilized. The spiral acquisition with zero-momentum compensation shown in Fig.1(c) was utilized to satisfy spatial incoherent condition for MRF, and variable TIs and TEs of measurements were utilized for temporal incoherence. The pulse sequence diagram was shown in Fig.1(a). In this study, the TIs shown in Fig.1(b) varied from 50 to 500 ms to distinguish the different T1 values in vivo. (ii) The dictionary was generated by EPG method3 according to the paradigm of pulse sequence. Unlike conventional MRF method that arranges the entries along acquisition order, the calculated entries of dictionary were rearranged along measurement dimension. (iii) The final T1, T2 and PD maps were recognized by a sliding-window matching algorithm4 between rearranged dictionary and corresponding data. The accuracy and effectiveness of proposed IR-TSE MRF method were validated using phantom and in vivo experiments, and its performance were compared with the conventional MRF with inversion-recovery fast imaging with steady-state precession sequence (FISP-MRF)2, conventional quantitative imaging methods and literature reports5.
Both phantom and in vivo brain experiments were performed for validation on a 3T scanner (MAGNETOM Prisma, Siemens Healthcare, Erlangen, Germany) with 20-channel head coil. In this study, 120 measurements with 6-echo per measurement acquired in IR-TSE sequence, therefore the TEs of echoes were from 25 to 150 ms so that the possible range of in vivo T2 values was covered. The slice thickness was 3 mm and the in-plane spatial resolution of 1.2 × 1.2 mm2 was achieved for the field-of-view (FOV) of 240 × 240 mm2. For quantitative comparisons, FISP-MRF method with same resolution was also utilized in brain imaging. The corresponding T1 and T2 maps were also evaluated by conventional multi-TI IR method and single spin echo (SE) sequence with multiple TEs respectively as the golden-standard references5.
Results and Discussion
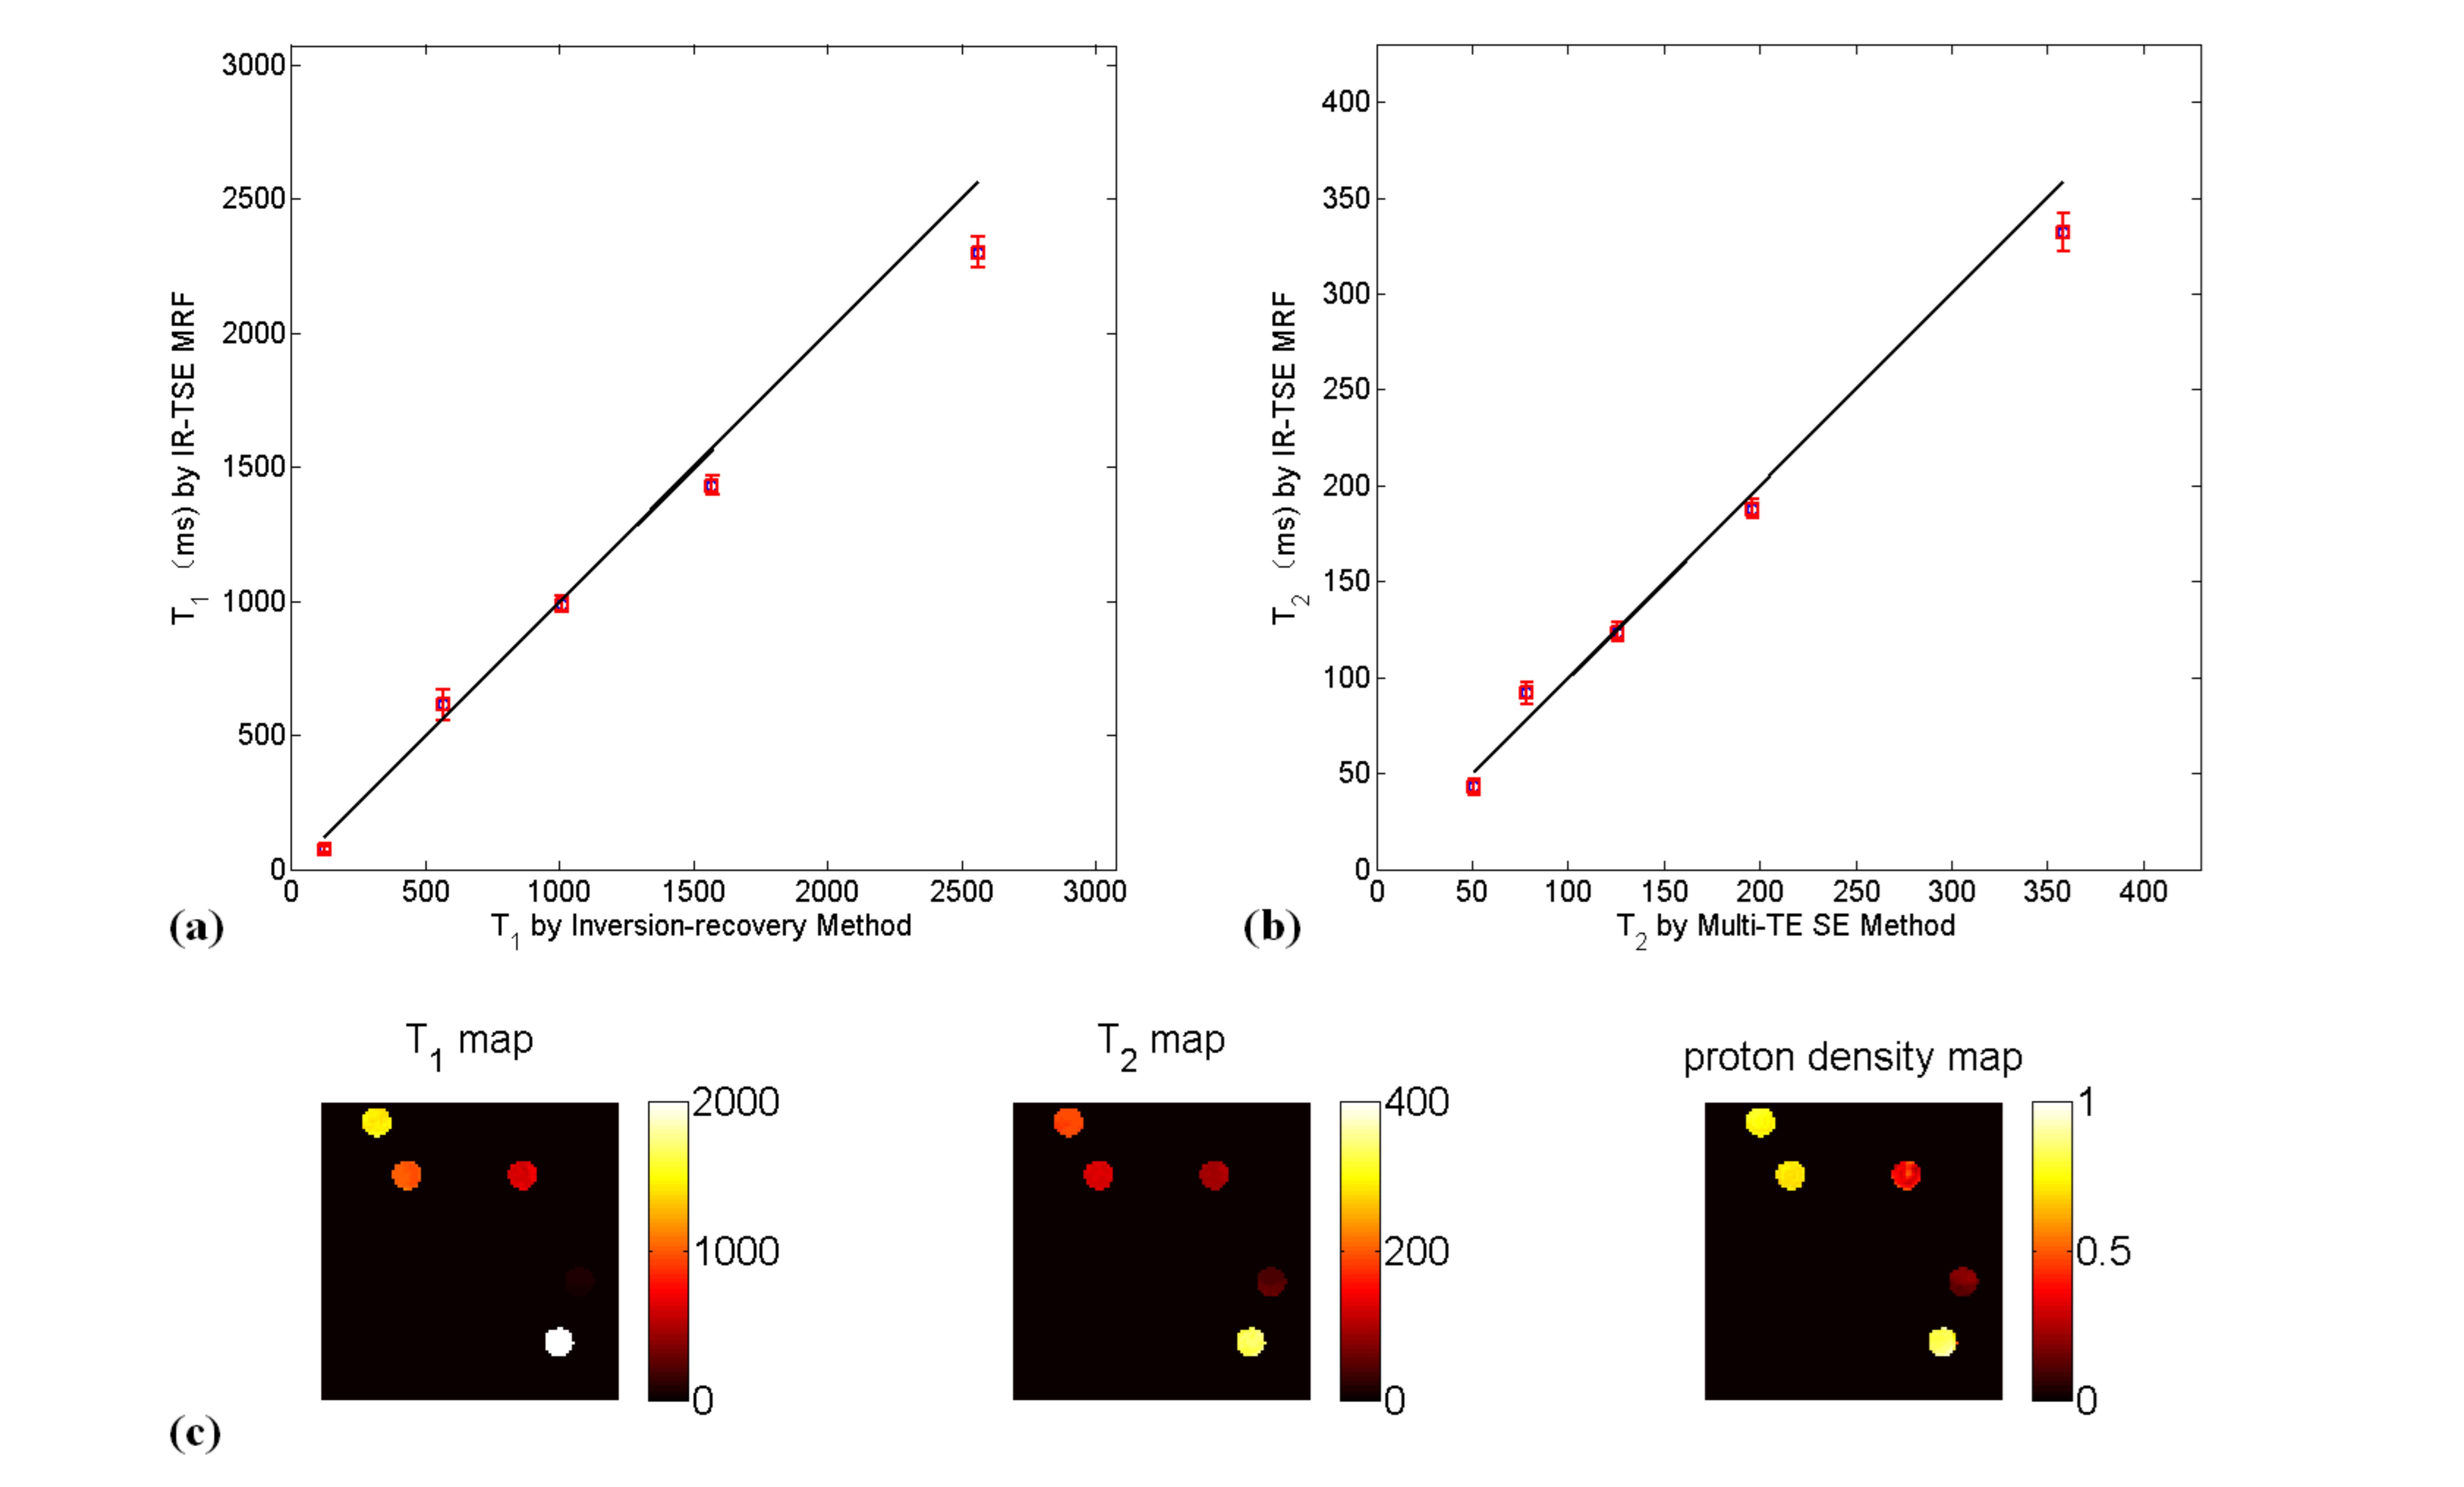
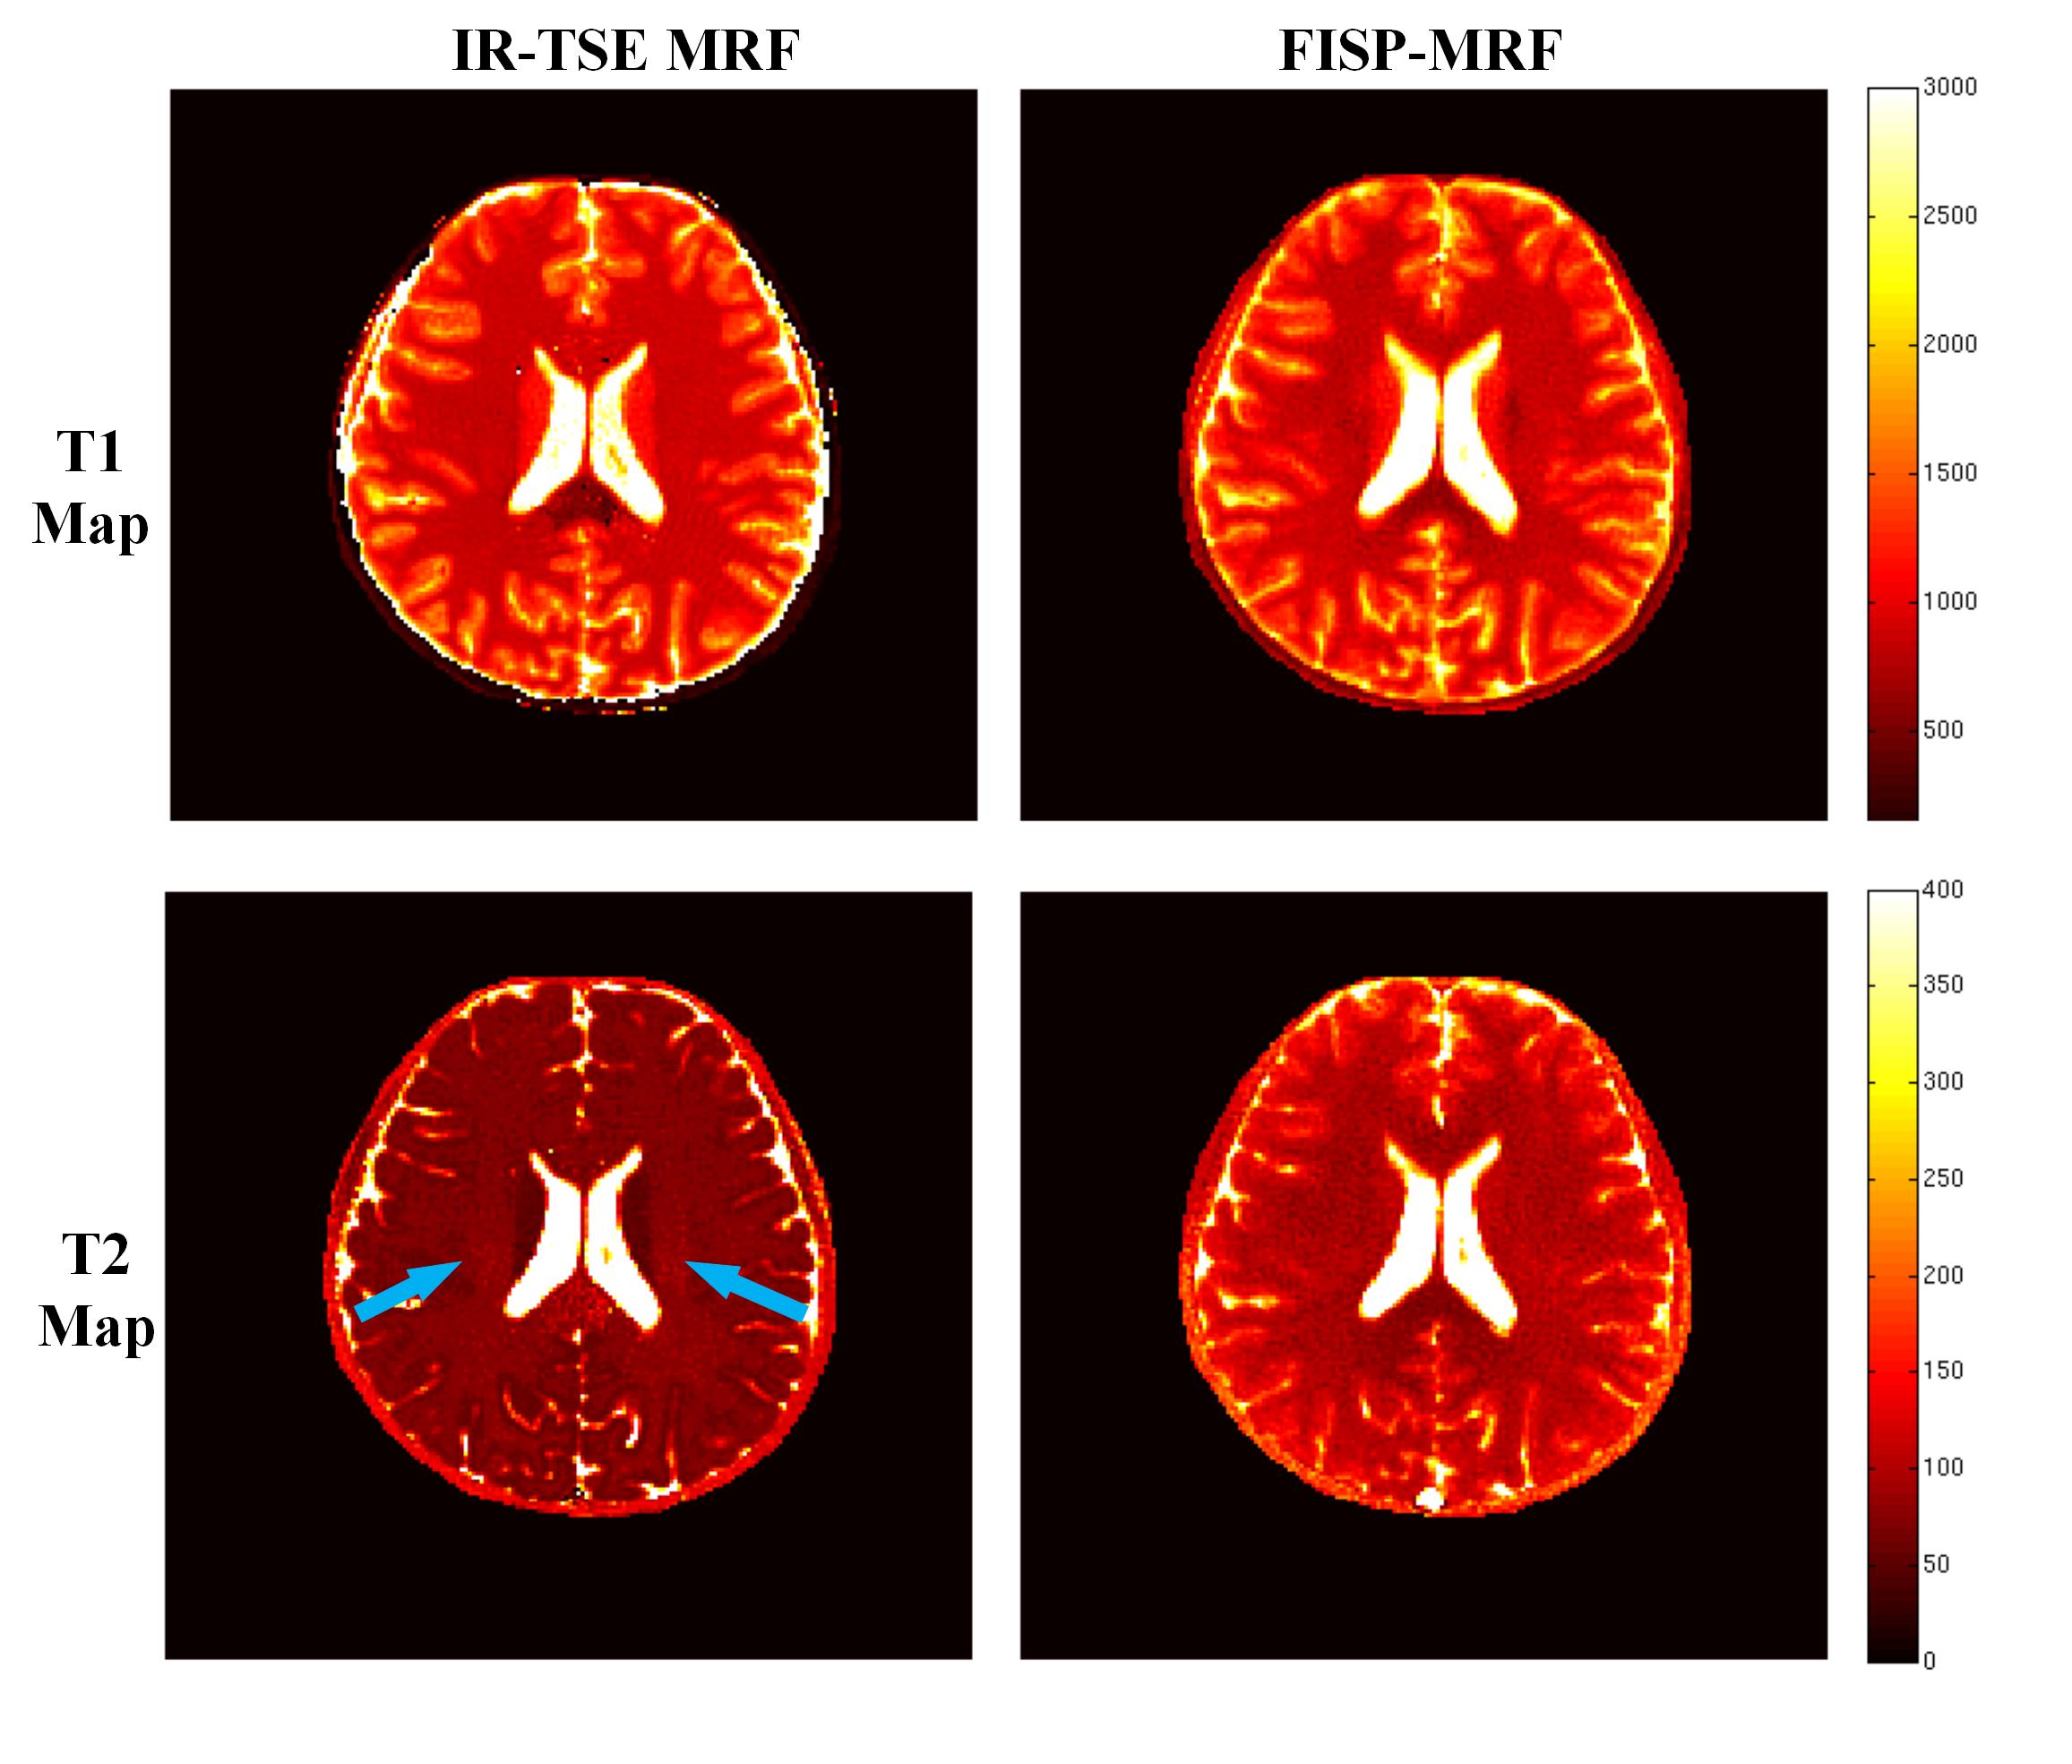
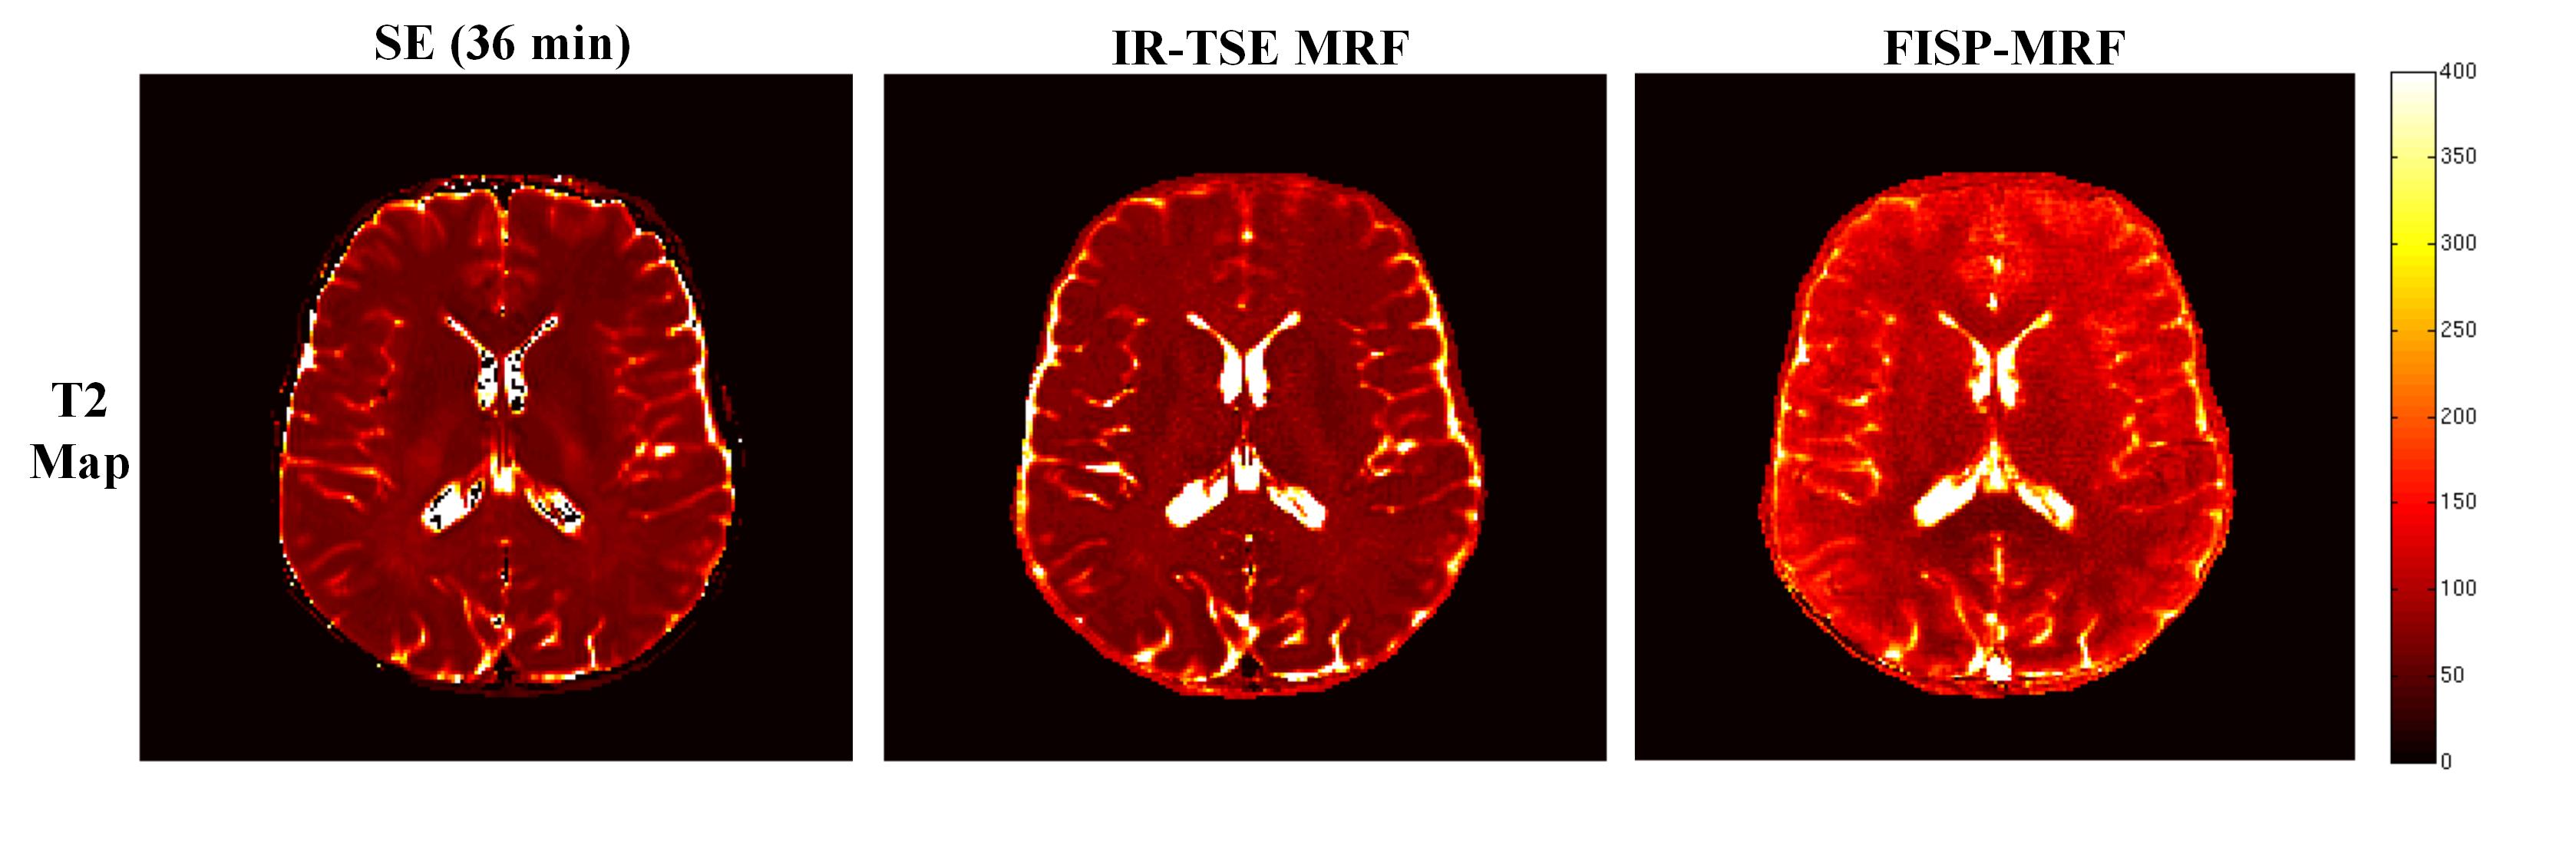
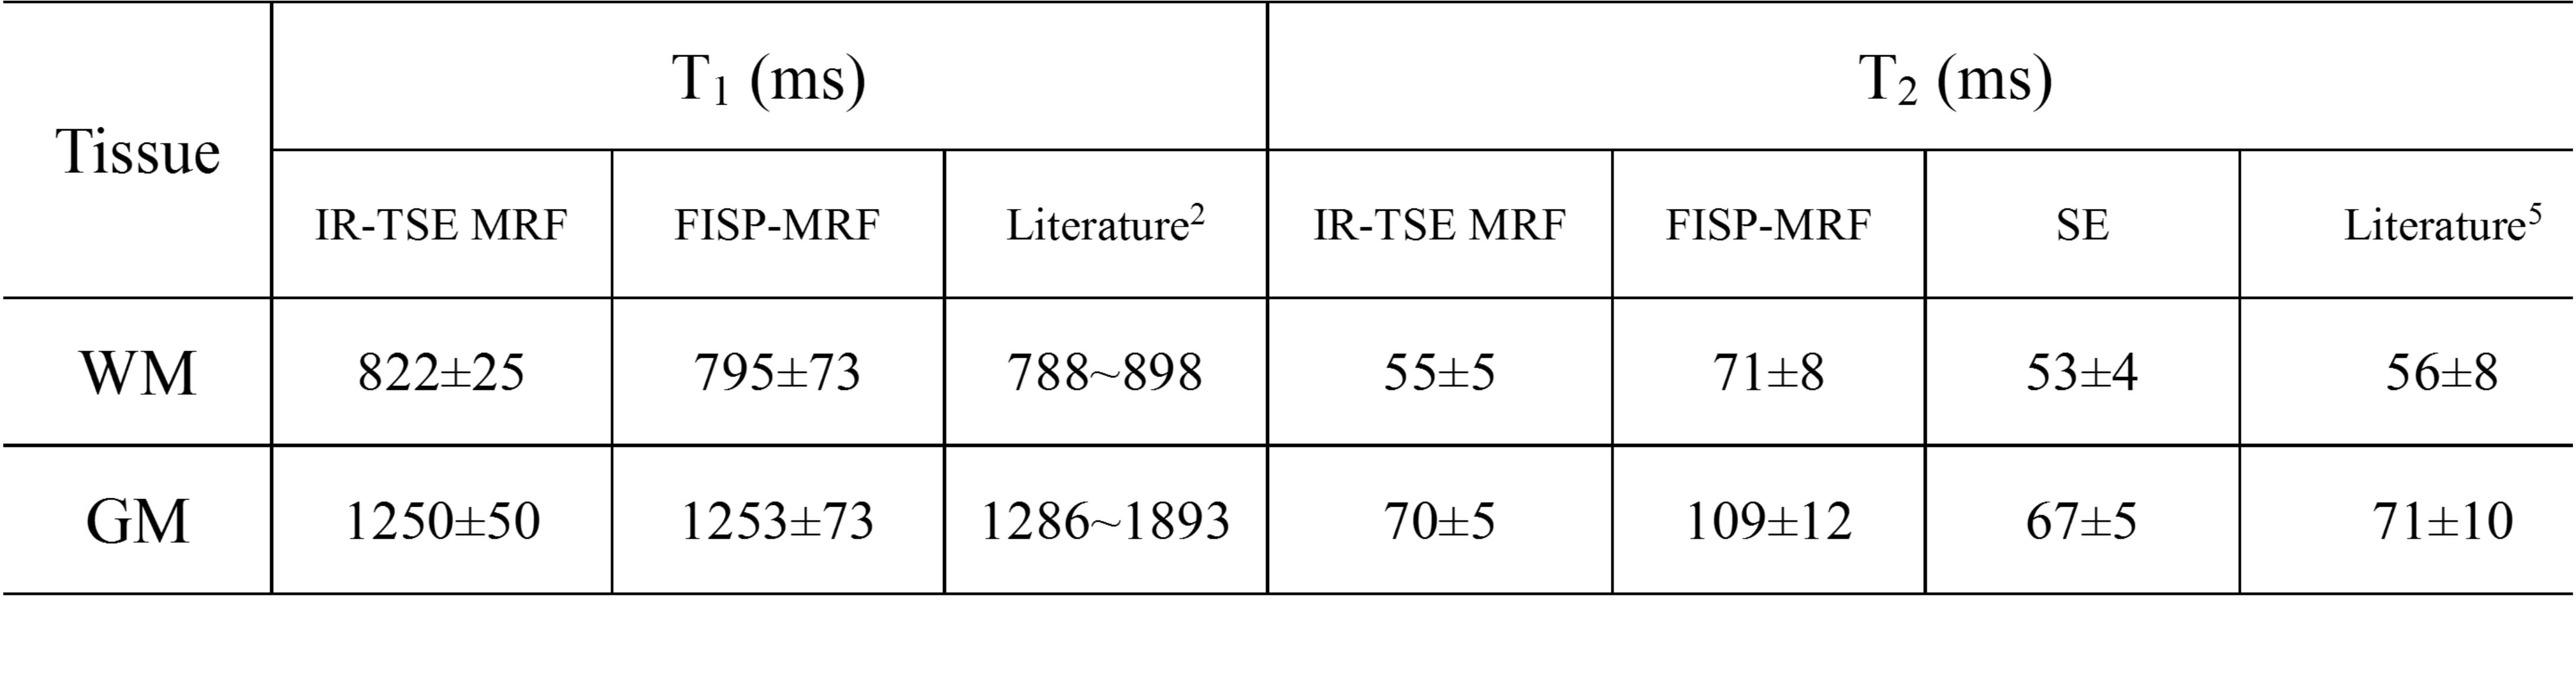
T1, T2 and PD maps of phantom study are shown in Fig.2. It can be seen that both for T1 and T2 estimation the proposed IR-TSE MRF method generate results well in accord with the golden standard. The results of in vivo human brain study obtained by IR-TSE MRF and FISP-MRF methods are displayed in Fig.3. The same slice of T1 and T2 maps were generated from a health volunteer. Both methods showed detailed structures and similar intensities of T1 maps, which indicated that the T1 values of both gray matter (GM) and white matter (WM) can be well recognized by both methods. For T2 mappings, these two methods had different performances. The result of IR-TSE MRF provided more detail structures than FISP-MRF method. For instance, as the blue arrows pointed in Fig.3, some fiber can be seen in T2 map of IR-TSE MRF method while there is nothing significant structures can be observed in the same area of T2 map obtained by FISP-MRF. Another issue that can be seen in Fig.3 is the overall T2 values of FISP-MRF are higher than proposed method. For further comparison, SE sequence was utilized as golden standard for comparison. Table. 1 lists the averaged T1 and T2 values of proposed method, FISP-MRF and SE in typical regions of interest, such as GM and WM, as well as the literature reported values. The T2 maps shown in Fig.4 indicated that proposed method is closer to golden standard method for T2 estimation. Therefore, the results both shown in Fig.4 and Table 1 demonstrated that that the proposed method has the possibility to provide accurate T2 values with smaller standard deviation. It should be noted that although the proposed method is based on TSE sequence, the SAR of sequence is still under the safety threshold set by scanner built-in SAR monitor.Conclusion
A novel MRF strategy is introduced, in which multi-measurement IR-TSE sequence with variable TIs is utilized for rapid and accurate multi-parametric mappings.Acknowledgements
No acknowledgement found.References
1. Ma D, Gulani V, Seiberlich N, Liu K, Sunshine JL, Duerk JL, Griswold MA. Magnetic resonance fingerprinting. Nature 2013;495(7440):187-192.
2. Jiang Y, Ma D, Seiberlich N, Gulani V, Griswold MA. MR fingerprinting using fast imaging with steady state precession (FISP) with spiral readout. Magn Reson Med 2015;74(6):1621-1631.
3. Weigel M. Extended phase graphs: dephasing, RF pulses, and echoes - pure and simple. J Magn Reson Imaging 2015;41(2):266-295.
4. Cao X, Liao C, Wang Z, Ye H, Chen Y, He H, Chen S, Ding Q, Liu H, Zhong J. Sliding-Window Reconstruction Strategy for Accelerating the Acquisition of MR Fingerprinting. No. 4200, ISMRM 2016, Singapore.
5. Deoni S. Magnetic Resonance Relaxation and Quantitative Measurement in the Brain. Magnetic Resonance Neuroimaging: Methods and Protocols 2011:65-108.
Figures