3960
Magnetic Resonance Fingerprinting with Quadratic RF Phase for Simultaneous Measurement of δf, T1, T2, and T2*1Biomedical Engineering, Case Western Reserve University, Cleveland, OH, United States, 2Radiology, Case Western Reserve University, OH, United States
Synopsis
We propose a modified Magnetic Resonance Fingerprinting pulse sequence with quadratic RF excitation phase (qRF-MRF) for the purpose of simultaneous measurement of T2* in addition to previously established spin parameters δf, T1, and T2. Existing bSSFP based MRF pulse sequence1 was modified to incorporate excitation segments with quadratic RF phase to sensitize signal evolutions to T2*. Measurements using qRF-MRF were performed in both phantom and in vivo. Maps from qRF-MRF were validated against traditional MRF, literature, and Multi-Echo GRE.
Background/Purpose
Local Field Inhomogeneity (LFI) is a product of a variety of factors, including blood oxygenation level, and parenchymal iron deposition level. Diagnosis and monitoring of conditions known to effect distribution of iron content, such as increased age, Huntington’s disease, and Alzheimer’s disease, may be aided by a rapid and quantitative MR method capable of measuring LFIs simultaneously with other tissue spin parameters. LFI is typically estimated by T2* measurements using multiple TEs in a gradient echo sequence. However, within the MRF framework, this would result in prohibitively long TR times, which would eliminate the ability to measure the other important parameters of interest. This study sought to overcome this limitation by using a quadratic RF excitation phase (qRF-MRF) to measure LFI.Methods
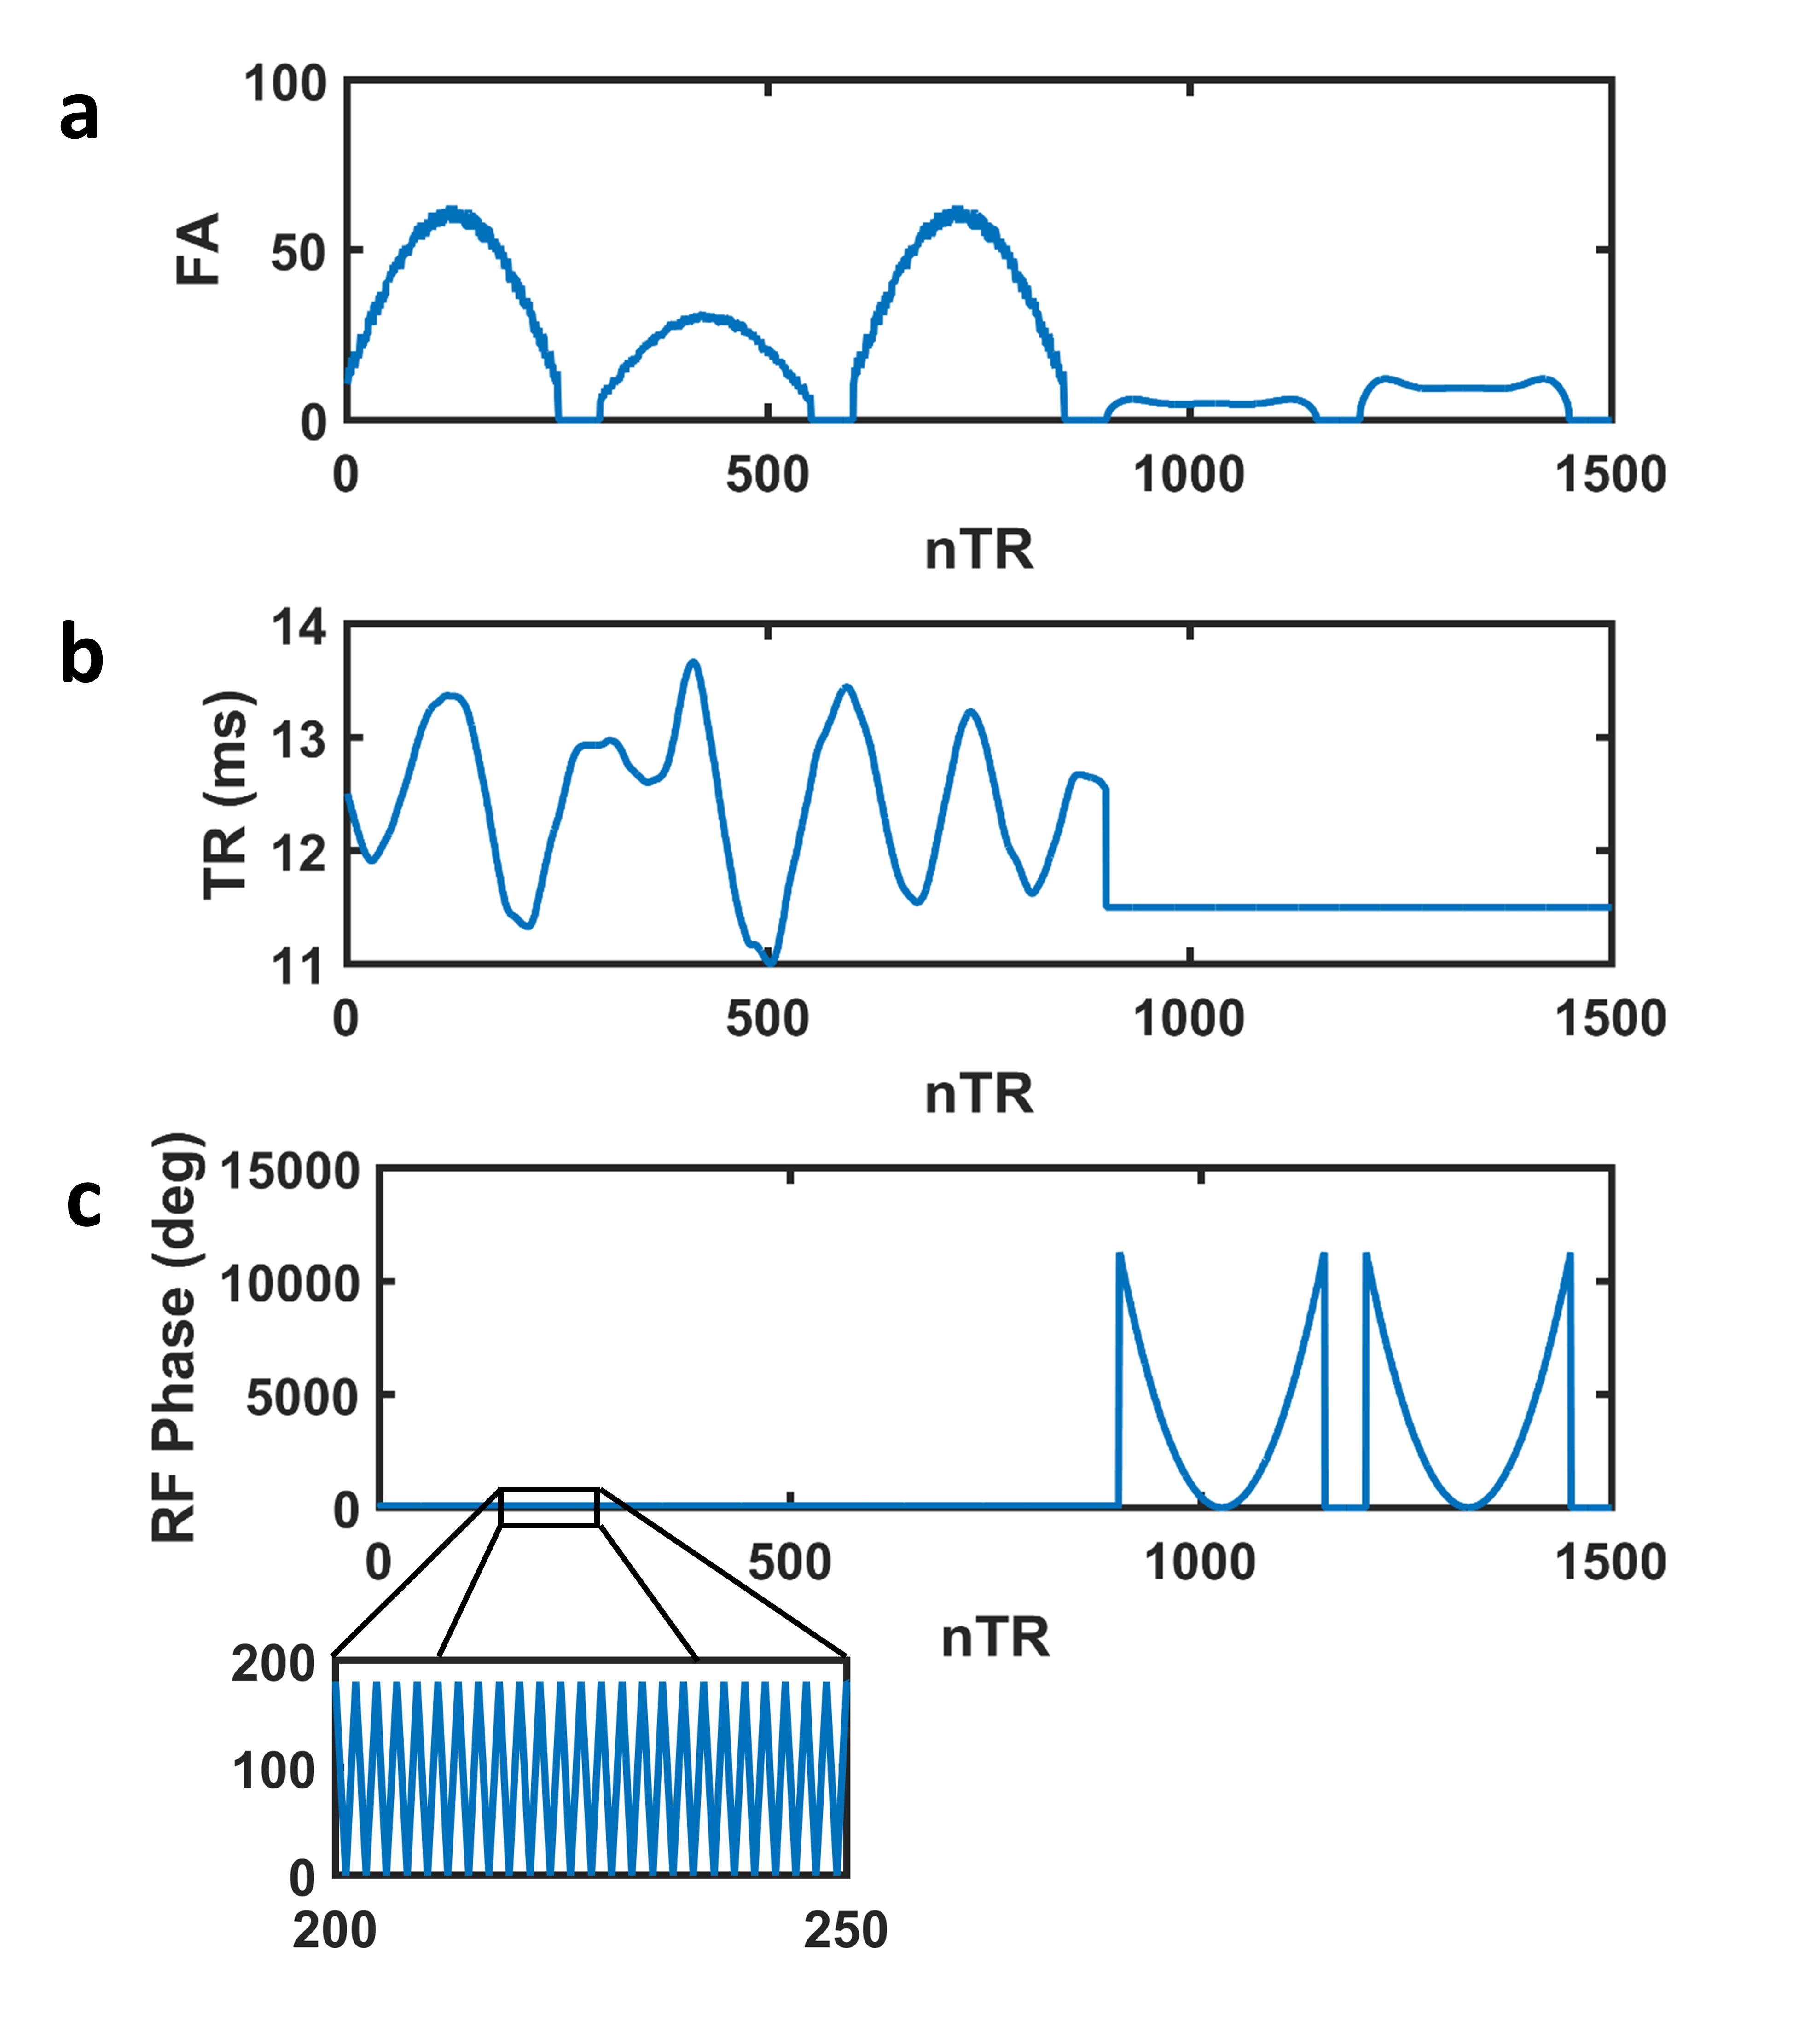
The proposed qRF-MRF pulse sequence was based on bSSFP-MRF pulse sequence1 (Fig. 1). The middle 1200 TRs were changed from bSSFP-MRF to use a low flip angle RF flip angle pattern with quadratic phase evolution and a constant 11.5 ms TR. Single-shot spirals2 were used for k-space measurements in similar fashion as previously reported. Undersampled 256x256 images were acquired with 1.2 x 1.2 mm2 in-plane resolution with 5 mm slice thickness. Total time for the acquisition was 36.4 s for a single slice.
Dictionary for template matching was constructed in two steps. First, a base dictionary containing different T1, T2, and off-resonance parameters (δf) was simulated. In the second step, a dimension of LFIs was appended to the base dictionary. 22 different LFIs were modeled by convolving the base dictionary with Gaussian kernels of different full width at half maximum (FWHM) across δf values. FWHM for the different LFIs ranged from 0.001 to 15 Hz. T2* value associated with each dictionary entry was then calculated as: $$$\frac{1}{T_{2}^{*}}=\frac{1}{T_{2}}+\pi FWHM$$$. Parameter matching with the complete dictionary was performed using l2-normalized complex template matching1.
A phantom study, using the ISMRM/NIST MRI System Phantom3,4, was performed to validate measurements from qRF-MRF. A 2D imaging slice containing the phantom’s T2 array was selected. After calibrations, the through-plane shim gradient was intentionally de-shimmed by 14.1 µT/m to induce intravoxel LFI. qRF-MRF derived quantitative T1 and T2 values were compared against manufacturer supplied measurements3, while derived T2* values were compared against multi-echo GRE imaging measurements. Additionally, qRF-MRF was evaluated in human brain imaging. Multi-echo GRE (ten echoes times ranging from 5-77 ms) and bSSFP-MRF1 using 3000 time points were also acquired as reference measurements. All scans were performed on a 3T system (Skyra, Siemens) after informed consent.
Results
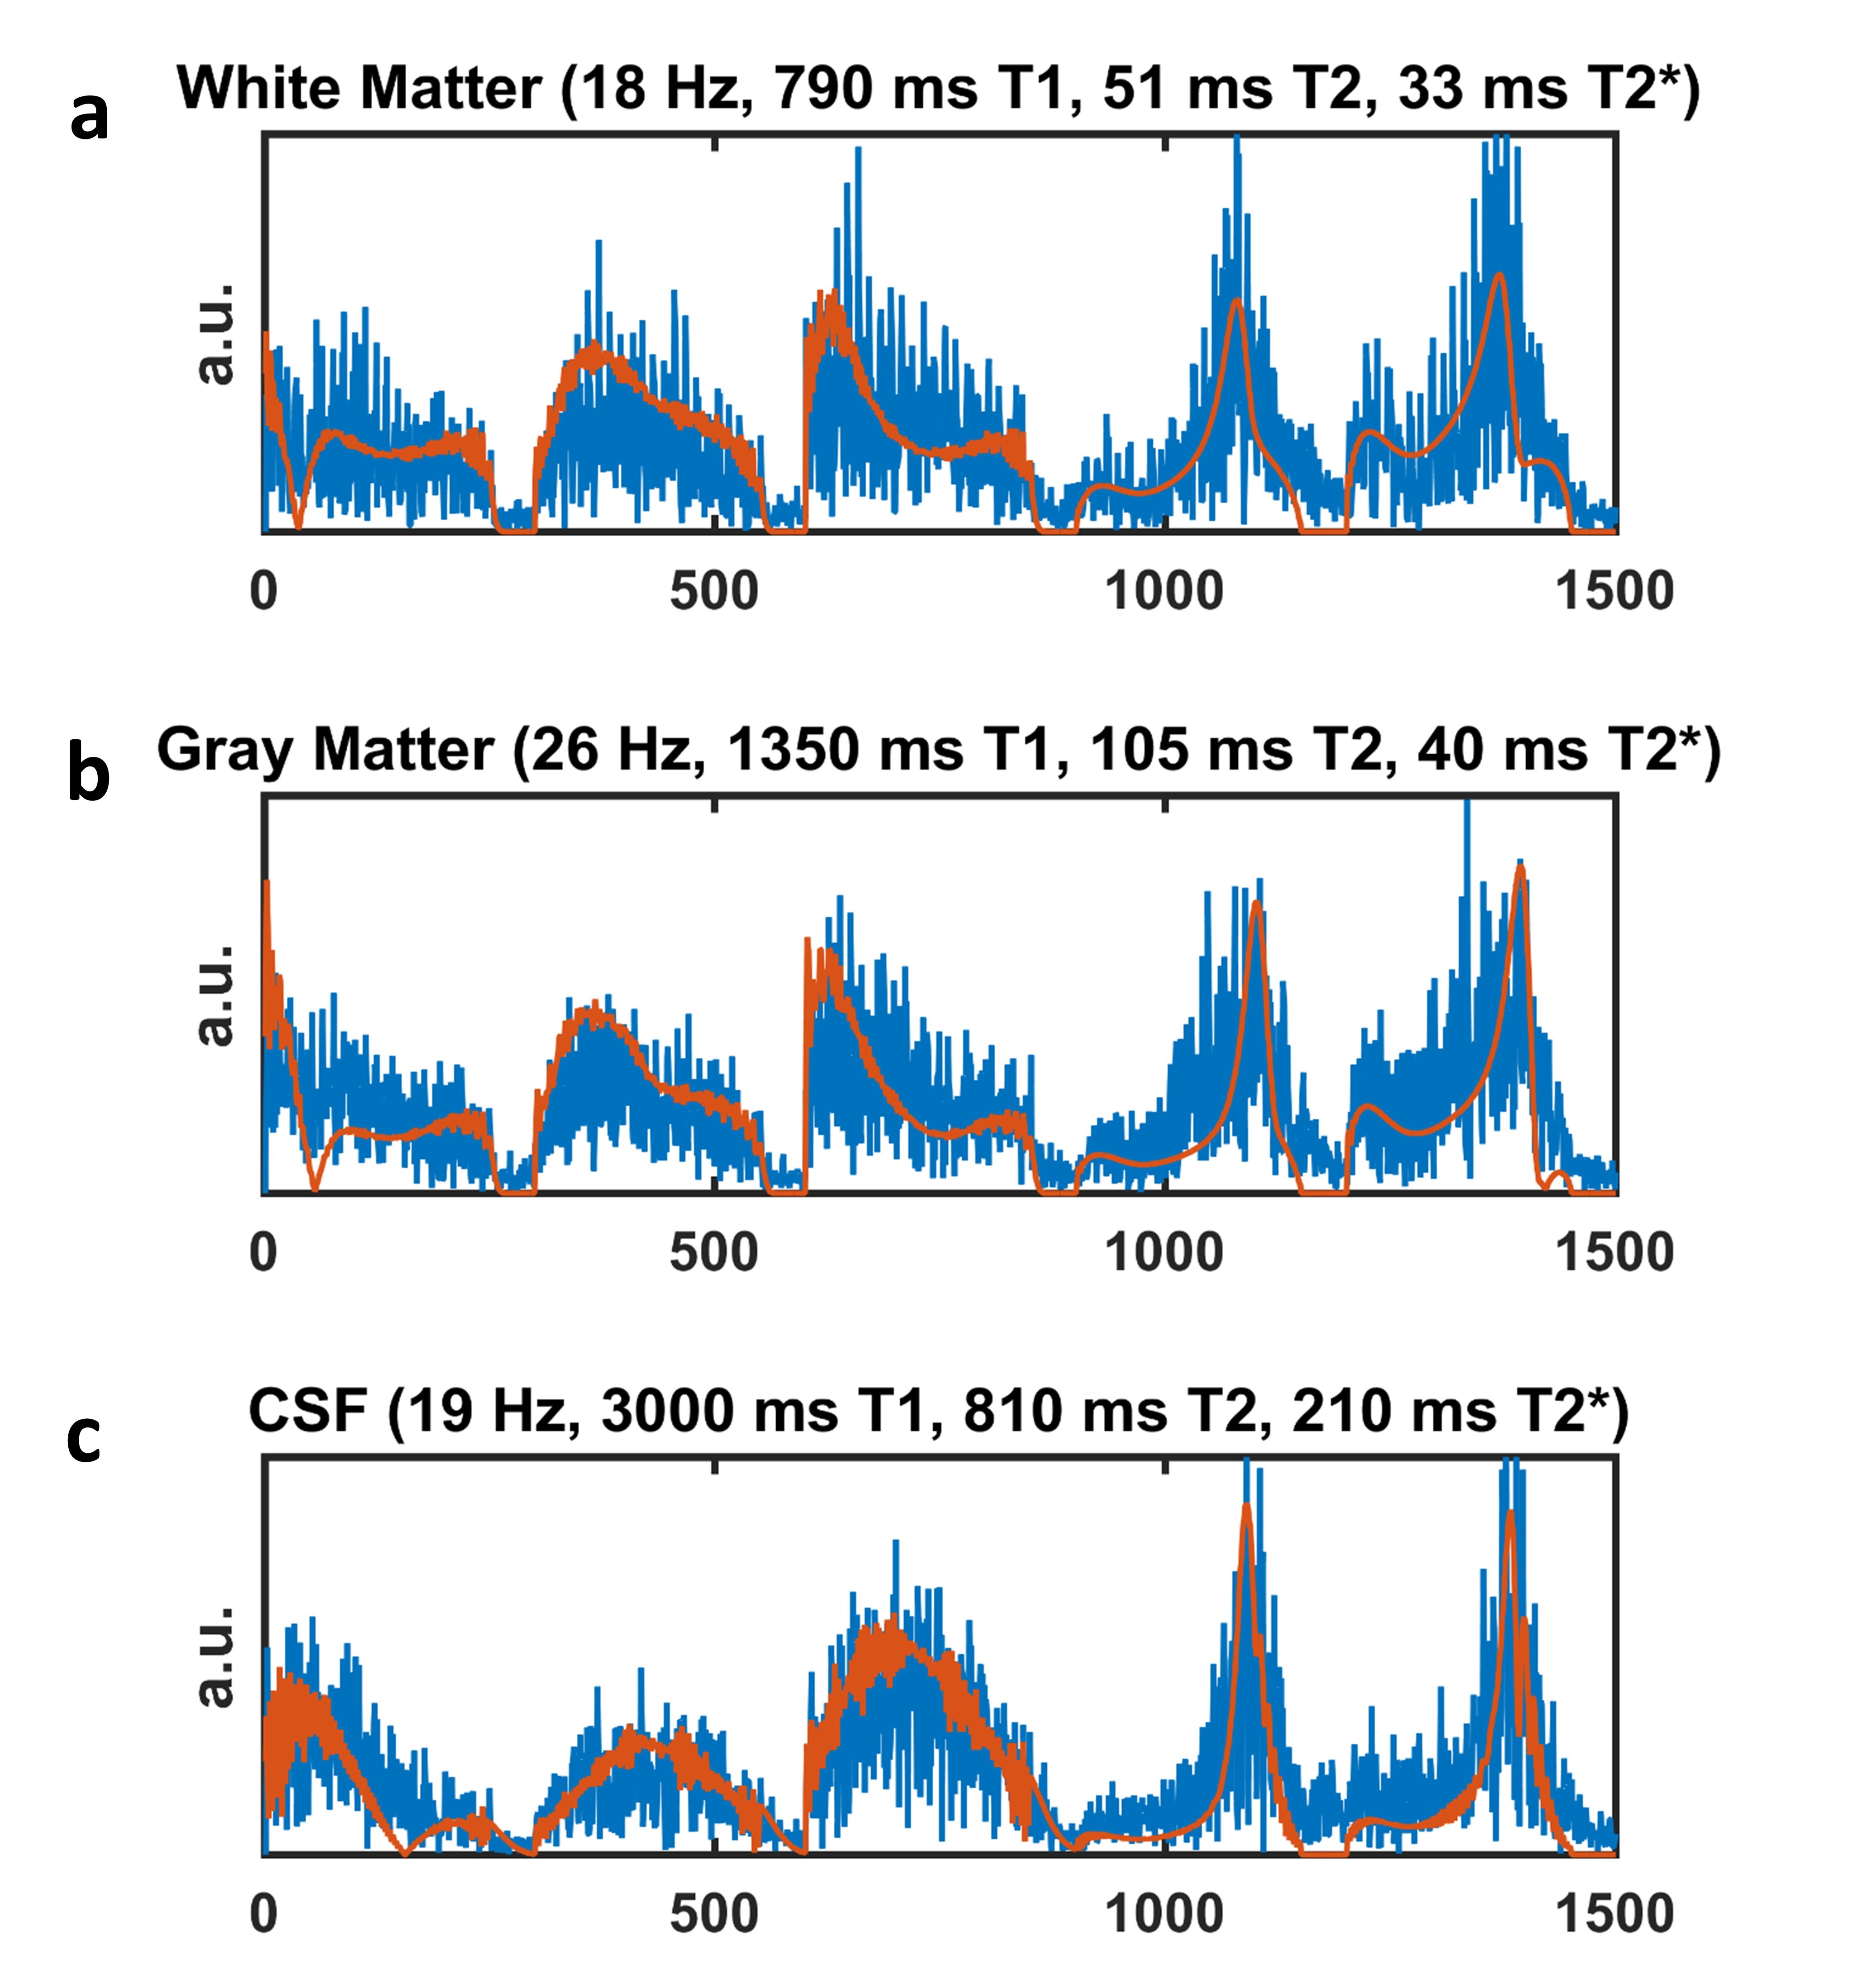
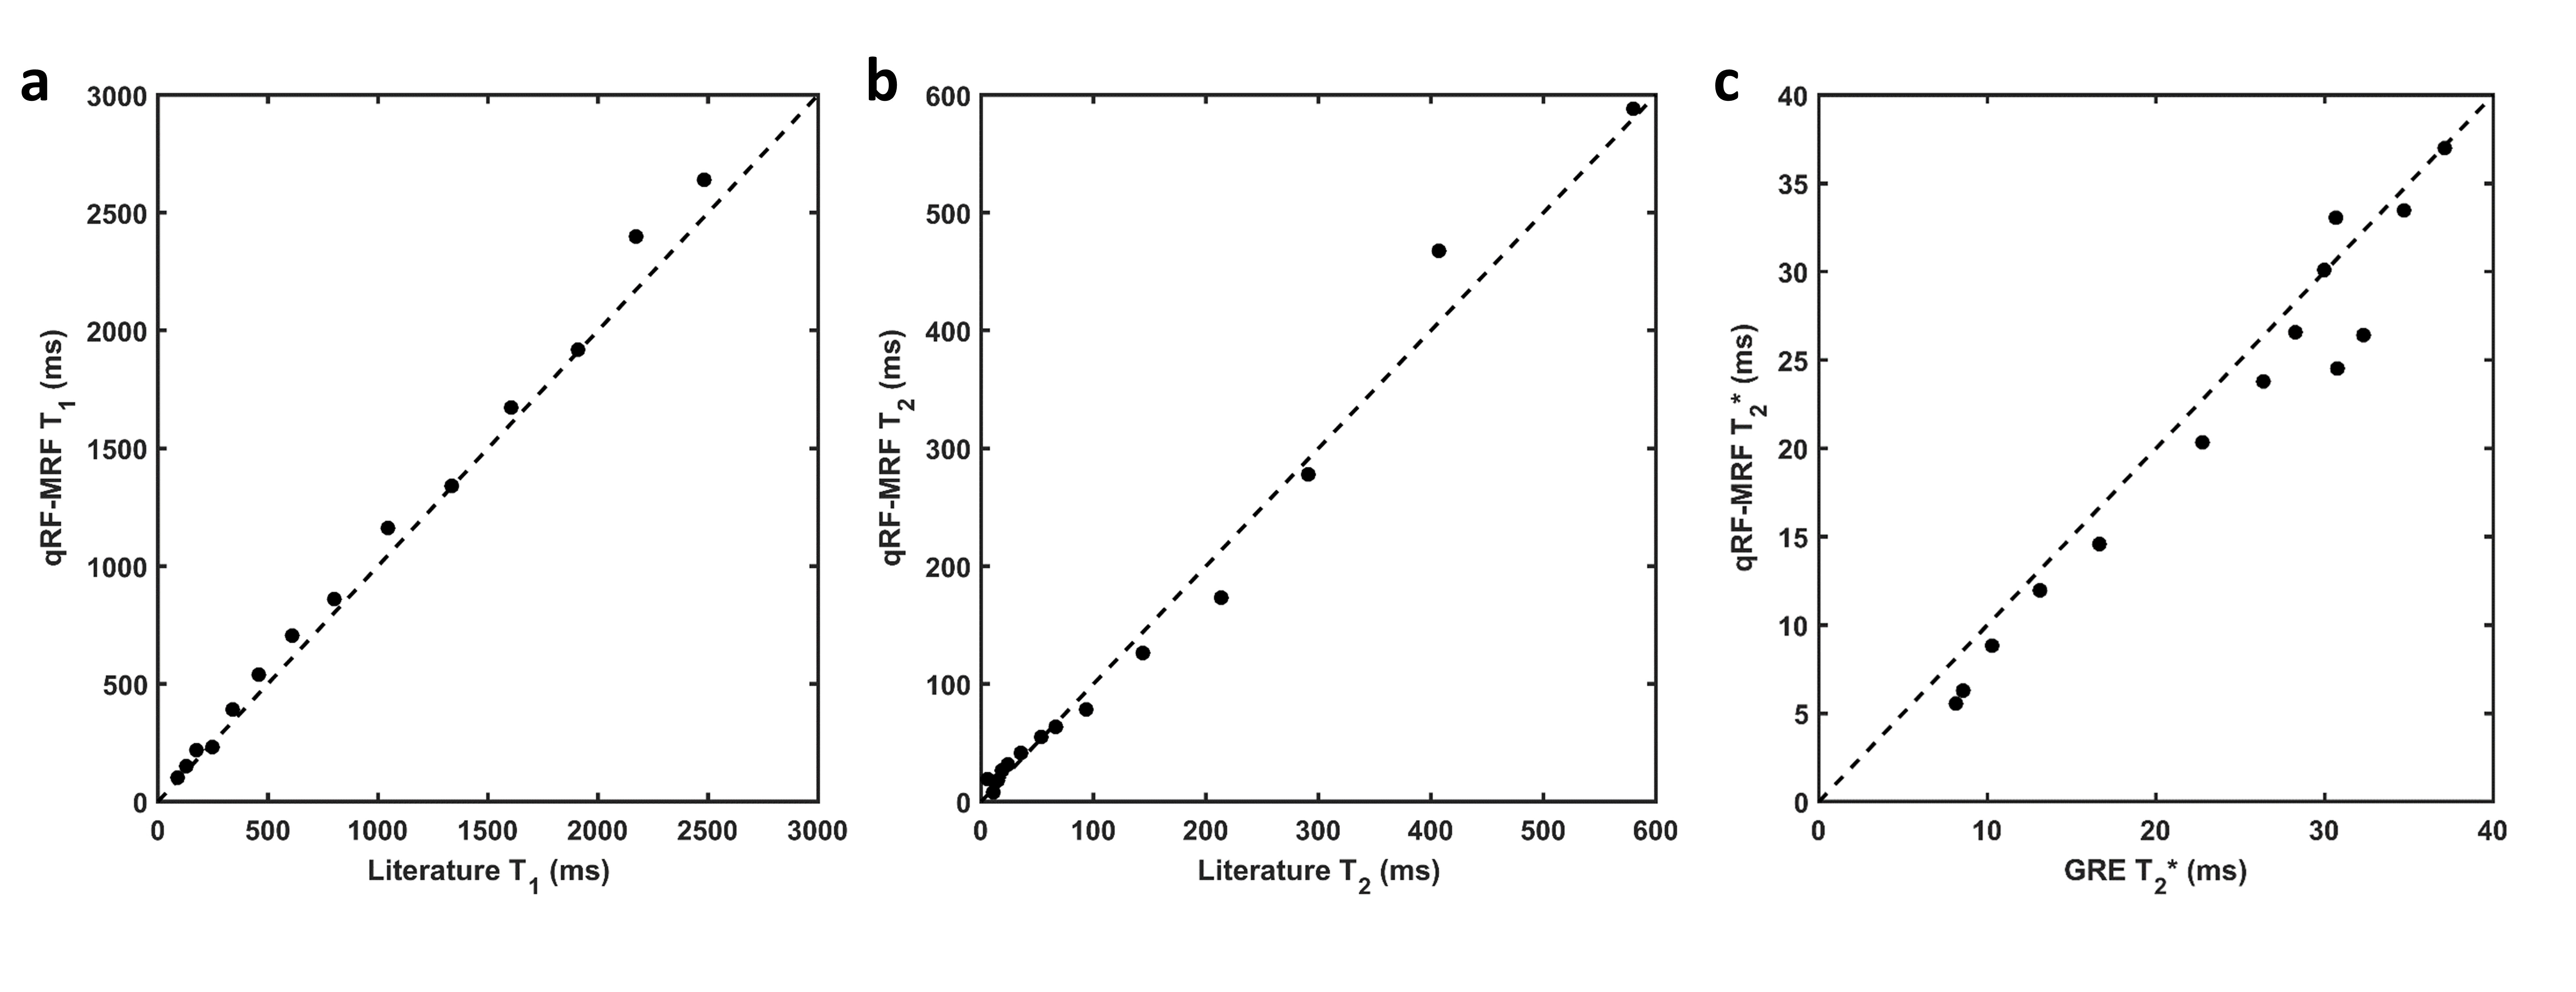
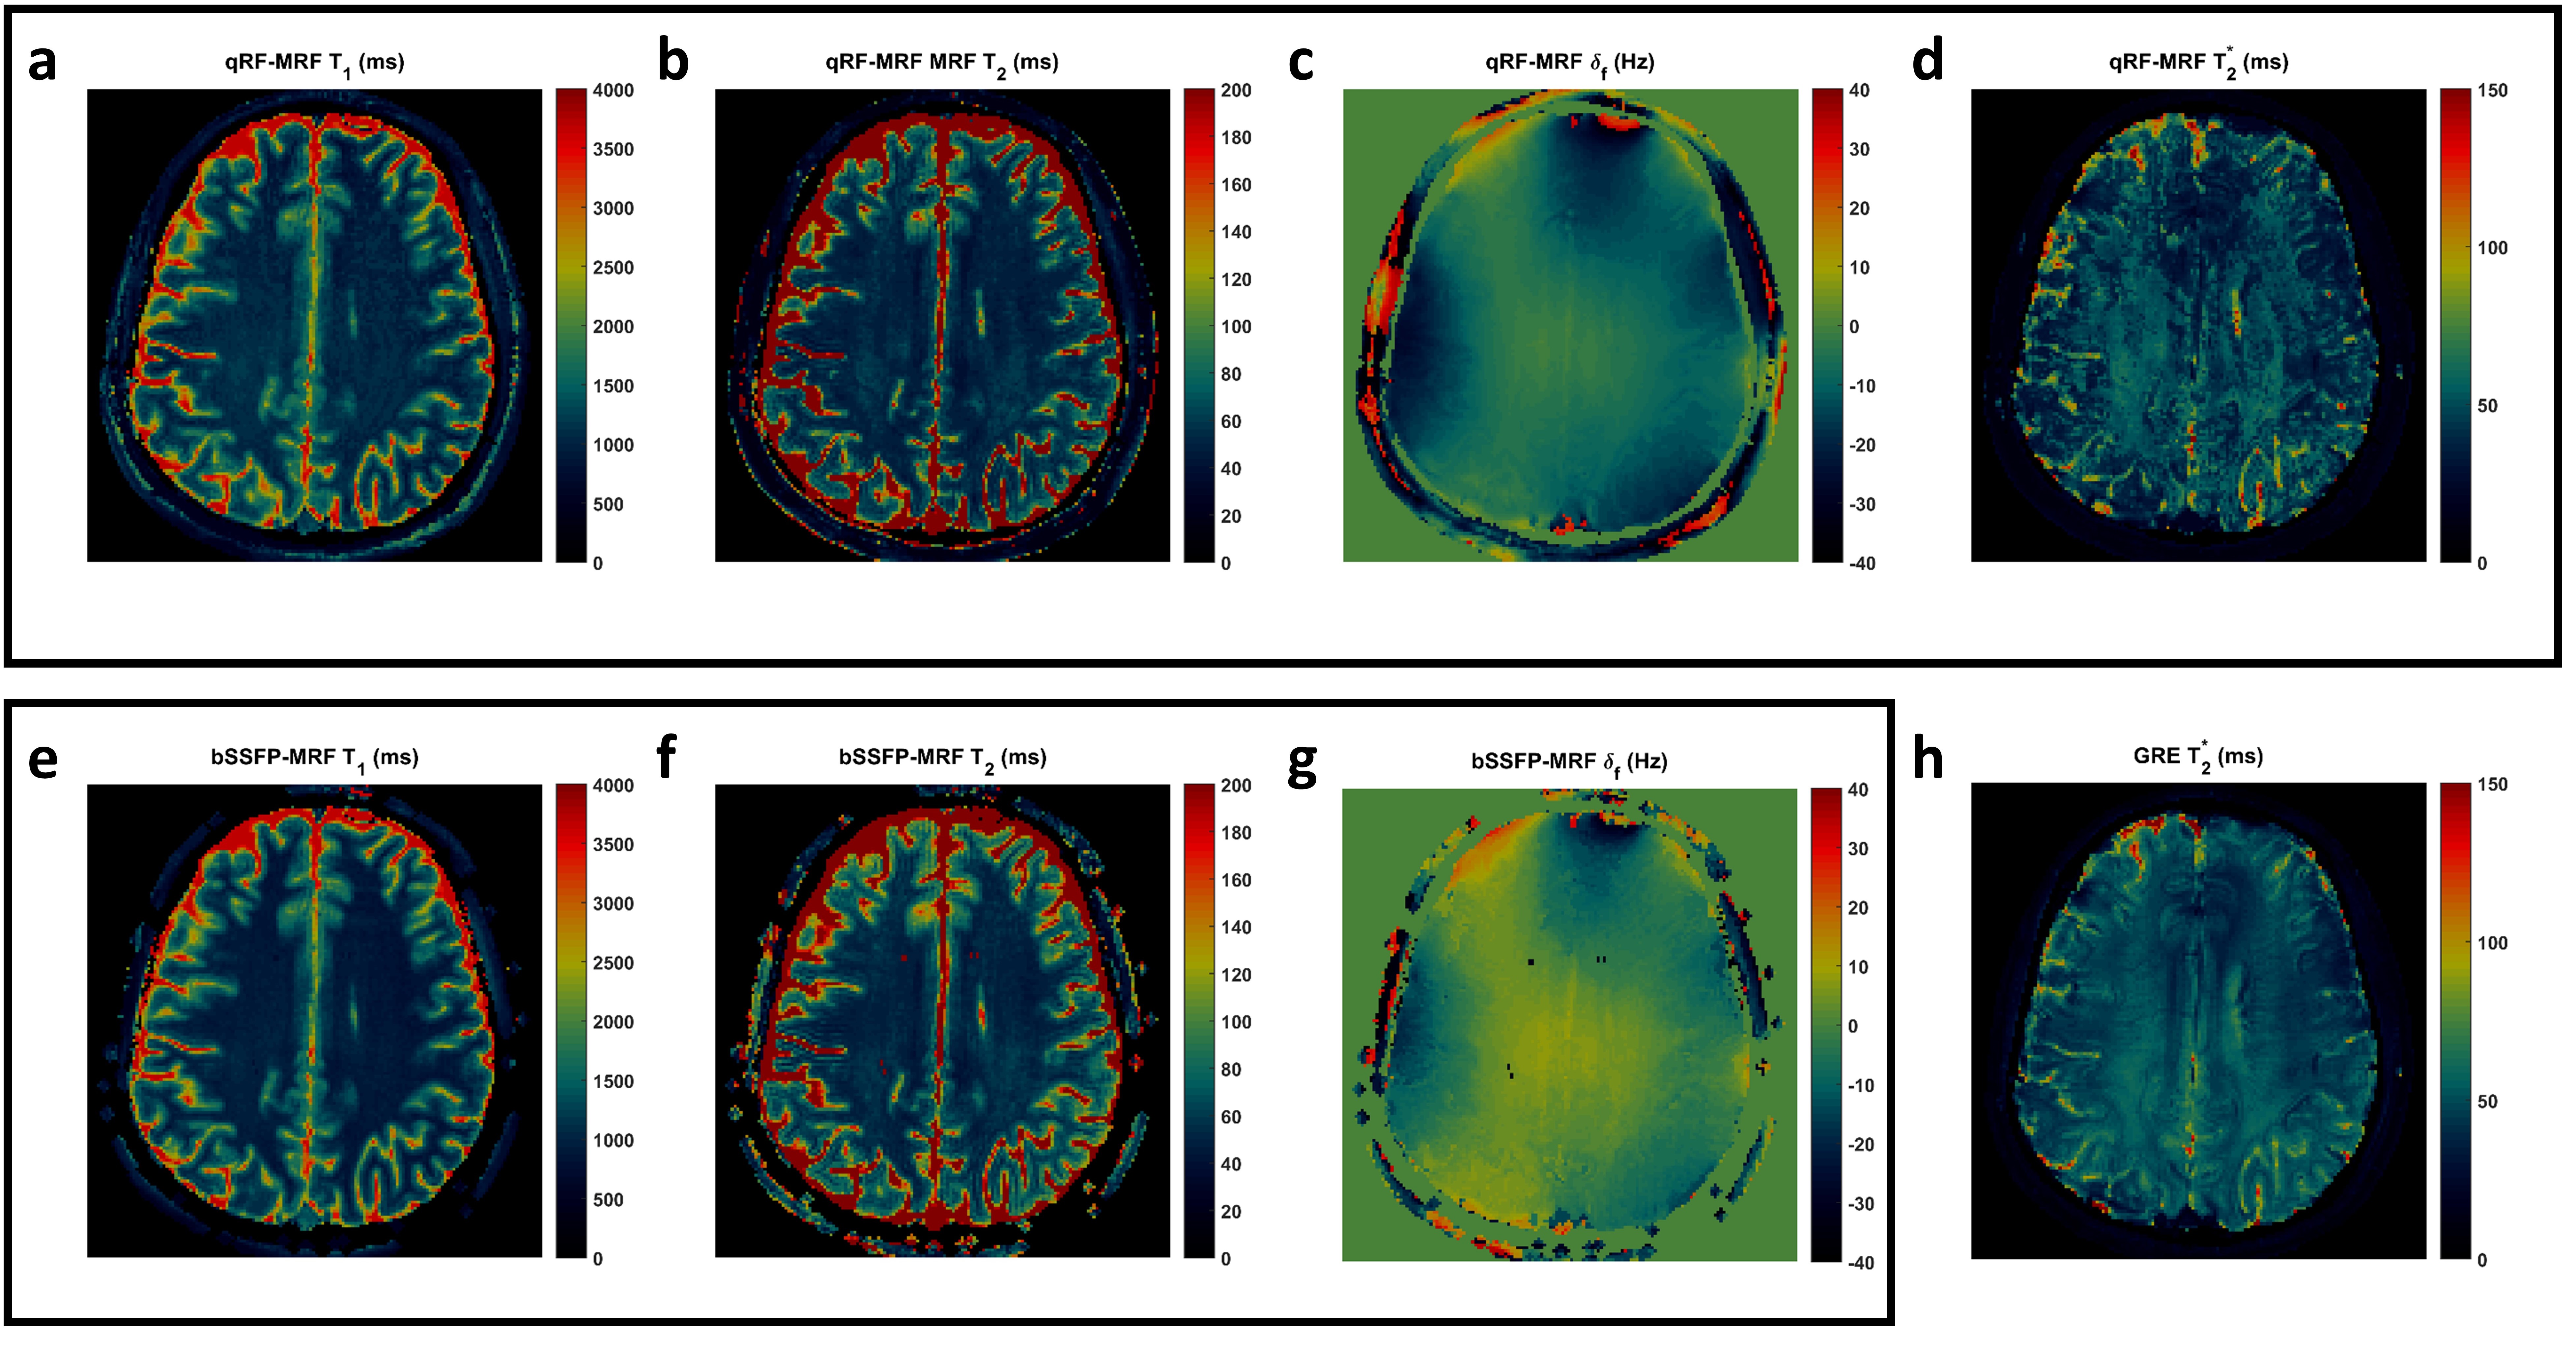
Fig. 2 shows representative in vivo time course fingerprints from three tissue types. High signal magnitude with unique encoding can be observed from the different tissue types during quadratic phase excitation segments (nTR = 900-1500). Fig. 3a-b shows the comparison of matched T1 and T2 values from qRF-MRF acquired in NIST phantom against published literature values. Fig. 3c shows the comparison of T2* values between qRF-MRF and conventional multi-echo GRE. R2 values for linear regression between measurements by qRF-MRF against standard methods were 0.996, 0.986, and 0.956 for T1, T2, and T2* values respectively. Fig. 4 shows maps derived from volunteer acquisition. In vivo T1, T2, and δf maps show good agreement between qRF-MRF and bSSFP-MRF. White matter regions were found to have consistently shorter T2 values than gray matter. qRF-MRF derived T2* map show the reverse trend, with gray matter having shorter T2* due to LFI effects. These findings are consistent in T2* map from multi-echo GRE, which was acquired in 28 minutes.Discussion/Conclusion
The proposed qRF-MRF method uses quadratic RF phase to sensitize signal evolutions to intravoxel LFI, while maintaining sensitivity to spin parameters T1, and T2. Despite being acquired in only 36.4 s of experiment time, qRF-MRF show promising accuracy in both phantom and volunteer experiments. Quantitative measurements performed in phantom and in vivo show good agreement with traditional measurement methods. This study suggests that simultaneous parameter mapping of T1, T2, δf and T2* is feasible in clinically relevant time.Acknowledgements
The authors would like to acknowledge funding from NIH TL1-TR000441, T32-EB007509, F30-HL124894, R01-HL73315, R01-HL094557, R01-DK098503, 1R01-EB016728, 5R01-EB017219, R21-HL126215 , and Siemens Healthcare.References
1. Ma, D. et al., "Magnetic Resonance Fingerprinting", Nature 2013;495:187–92.
2. Jin H. Lee, et al., "Fast 3D imaging using variable-density spiral trajectories with applications to limb perfusion", MRM 2003; 50(6):1276.
3. Russek SE, et al., "Characterization of NIST/ISMRM MRI System Phantom". Proceedings of the 20th meeting of the ISMRM, Melbourne, Australia, 2012.
4. Kathryn E Keenan, et al.,"Multi-site, multi-vendor comparison of T1 measurement using ISMRM/NIST system phantom", Proceedings of the 24th meeting of the ISMRM, Singapore, 2016. Abstract #3290.
Figures