3956
Spatial biases in Magnetic Resonance Fingerprinting parameter maps arising from undersampling patterns1Application Development, Siemens Healthcare, Erlangen, Germany, 2Friedrich-Alexander Universität Erlangen-Nürnberg, Erlangen, Germany, 3Physics department, Siemens Healthcare, 4Department of Biomedical Engineering, Case Western Reserve University, OH, United States, 5Dept. of Radiology, Case Western Reserve University and University Hospitals of Cleveland, OH, United States
Synopsis
Magnetic Resonance Fingerprinting (MRF) is an MR technique that generates parameter maps by matching pseudo randomly generated MR signals with a precalculated dictionary. In order to acquire the signals in a reasonable time, rapid imaging techniques with high undersampling factors are necessary. We show a detailed analysis of the artifacts originating from this and their impact on measured signals and subsequently on parameter maps. Additionally, an analytical approach of predicting undersampling artifacts is proposed. With the help of this approach, a more robust and time efficient sampling of signals in MRF can be designed.
Purpose
Magnetic Resonance Fingerprinting (MRF) 1 is a new technique that promises multi-parametric, quantitative MRI. A series of RF pulses generates a complex signal response in non-steady-state which is compared to a physically modelled signal to determine the parameters of the tissue where the signal originates from.
The magnetization is sampled after each RF pulse, e.g. by using rapid imaging techniques like radial or spiral scanning 1,2. For a clinically feasible field of view, resolution and scan time, high undersampling factors are required. An important property of MRF is its tolerance to artifacts, if they are not correlated with the underlying signal and thus do not impact the pattern-matching process 1.In spiral imaging, this can be achieved by rotating the spiral trajectory for each echo acquisition. This leads to a series of highly artifact-afflicted images, each consisting of the underlying magnetization and the superimposed undersampling artifacts.
Starting from examples how inappropriate sampling schemes can introduce significant deviations in the resulting parameter maps, we demonstrate how these effects can be analyzed and predicted based on simulations and analytical considerations, in order to finally identify sampling schemes with minimal impact on MRF results.
Methods
A prototype implementation of the MRF method 3 based on a steady-state free-precession (SSFP) sequence that employs a spiral acquisition (undersampling factor 48, field of view 300 mm, resolution 1.2 mm) is used. 48 equidistantly rotated versions of the original spiral were used that can be freely reordered.
Especially STEP – x reorderings, meaning a constant spiral rotation angle increase between adjacent time points were examined. Here, x indicates the number of indices that are skipped between adjacent time points which is equivalent to a rotation angle increase of 7.5*x degrees between adjacent time points. More experimental details are described elsewhere 4.
Measurements were performed on a human-brain-shaped gel phantom. The signal of the same pixel acquired with different spiral reorderings was subtracted from the true artifact-free signal and the resulting residuals analyzed.
For the theoretical investigation, we calculated the point spread functions of the spirals. This was used as the basis for what we called a “point collection function” (PCF, exemplary shown in figure 1) which describes from which pixels signal is folded to one pixel because of undersampling. Applying this to digital phantoms, artificial undersampling can be performed to investigate the effects of reordering schemes.
Results
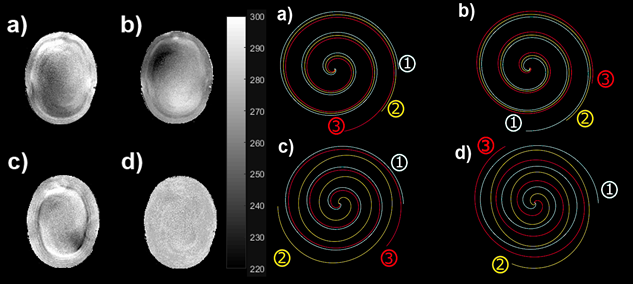
Figure 2 shows T1 maps of a homogenous human-brain-shaped gel phantom and the corresponding reordering modes. The residuals after subtracting the true (=simulated) from one pixel’s signal measured were divided into 48 time points long sections (Figure 3 a)). Figures 3b)-e) show these residuals from MRF acquisitions with different reorderings plotted one above the other. The mean value of these curves can be ordered back to the angle of the spiral that was used (Figure 3f)). Frequency analysis was performed with rearranging the sum of residuals ordered by angle. Weighting the frequency spectrum with a reversed exponential function (Figure 4a)) gives a scalar called weighted frequency score. The result of this for all pixels in the phantom and all possible STEP reorderings is shown in Figure 4b).
The PCF was utilized for artificial undersampling of signals from a round oil phantom. The simulation incorporates a B1+ map, coil sensitivities and off-resonances from a real scan of this phantom. Figure 5 shows a comparison of the parameter maps resulting from the match of these signals theoretically generated with different reorderings and the measured parameter maps.
Discussion
With different spiral reorderings, the same artifacts are generated but have a varying impact on the signal matching, depending on where in the signal the artifacts occur. The investigation shows that the reordering that produces a high frequency undersampling noise affects the template matching the least, which is confirmed by experimental work 4.
This can be shown experimentally and also theoretically by using the PCF. We were able to artificiallly reproduce the spatial bias on a phantom with arbitrary reorderings.
Conclusion
We demonstrate that the MRF undersampling pattern has a severe impact on parameter maps. The errors arising from undersampling artifacts in the maps are spatially distributed and can therefore change phantom and anatomic results significantly. Theoretical work has shown that with a change in spiral reordering, the parameter matching can be stabilized. With the PCF formalism, we provide a tool for analyzing and testing undersampling patterns of all kinds (e.g. radial, EPI,..).
Acknowledgements
No acknowledgement found.References
Ma D. et al., Magnetic Resonance Fingerprinting, Nature 2013
Cloos et al, Multiparametric imaging with heterogenous radiofrequency fields, nature communications 2016
Jiang Y. et al, MR fingerprinting using fast imaging with steady state precession (FISP) with spiral readout, MRM 2014
Pfeuffer J. et al, Mitigation of Spiral Undersampling Artifacts in Magnetic Resonance Fingerprinting (MRF) by Adapted Interleave Reordering, Proceedings ISMRM 2017, submitted
Figures
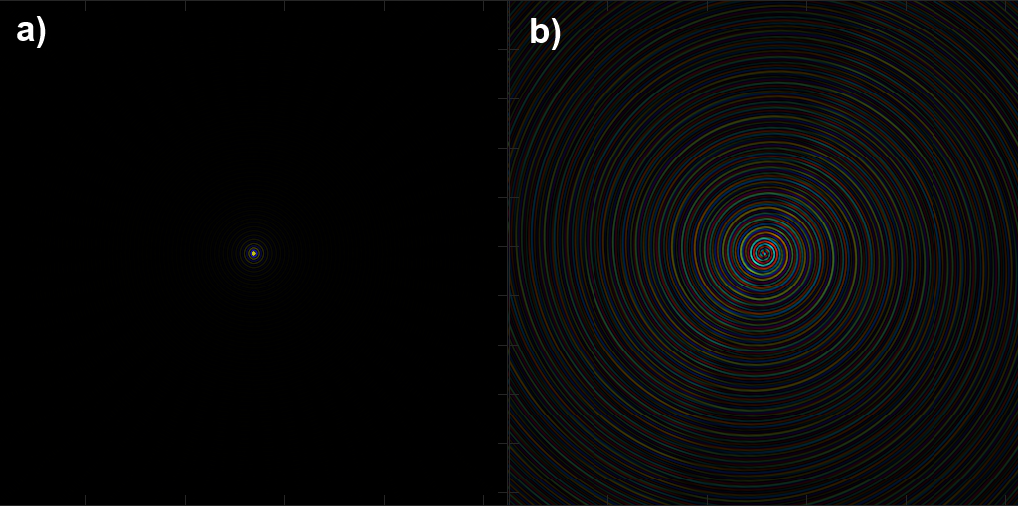
a) mean Point Collection Function (PCF) over all 48 rotated spirals. b) difference of one spiral’s PCF and the mean PCF. The plot shows the amount of signal from all pixels in the field of view that is folded to the middle pixel’s signal. A huge amount of the signal measured at one pixel originates from the surronding pixels. Color represents phase and brightness the magnitude. The 9 middle pixels in a) are downscaled by a factor of 5 for better visualization.
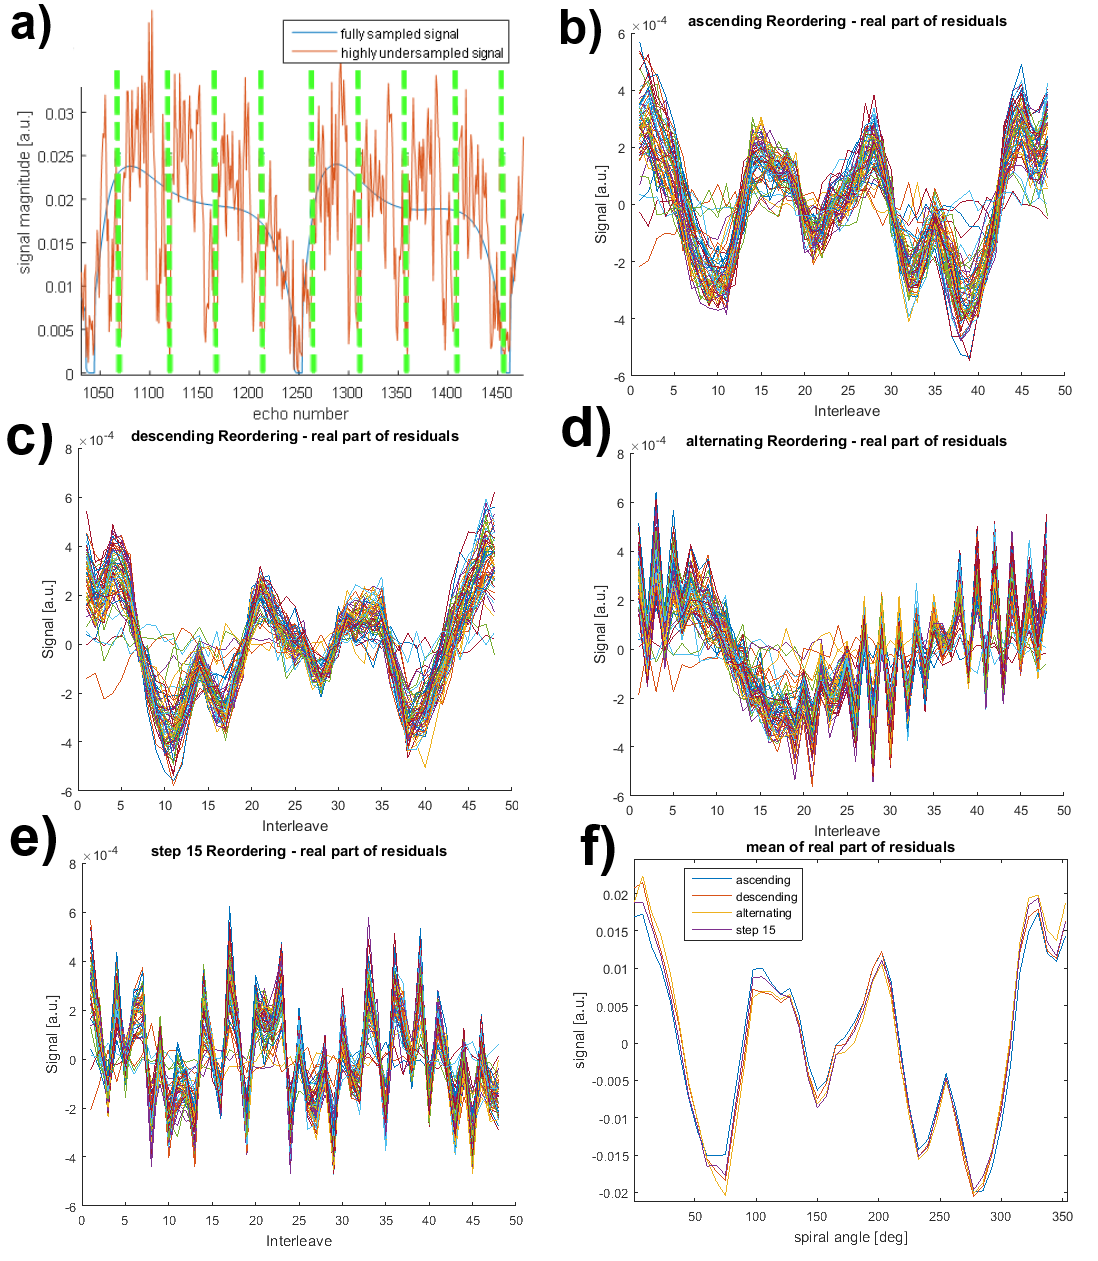
a) True and measured undersampled signal from one pixel (excerpt). Dashed green vertical lines every 48 echoes. Subtraction of measured and true signal is divided in these parts. b) to e) Residuals from subtracting true and measured signals for several reorderings. Residuals are recurrent and therefore residuals are plotted one above the other. Only the real part of the residuals is shown here (similar behavior for imaginary part). b)ascending reordering, c)descending reordering, d)alternating and e)STEP 15 reordering. f)shows the mean real value of the 48 time points long residuals for each reordering. The residuals are plotted against the spirals angle.
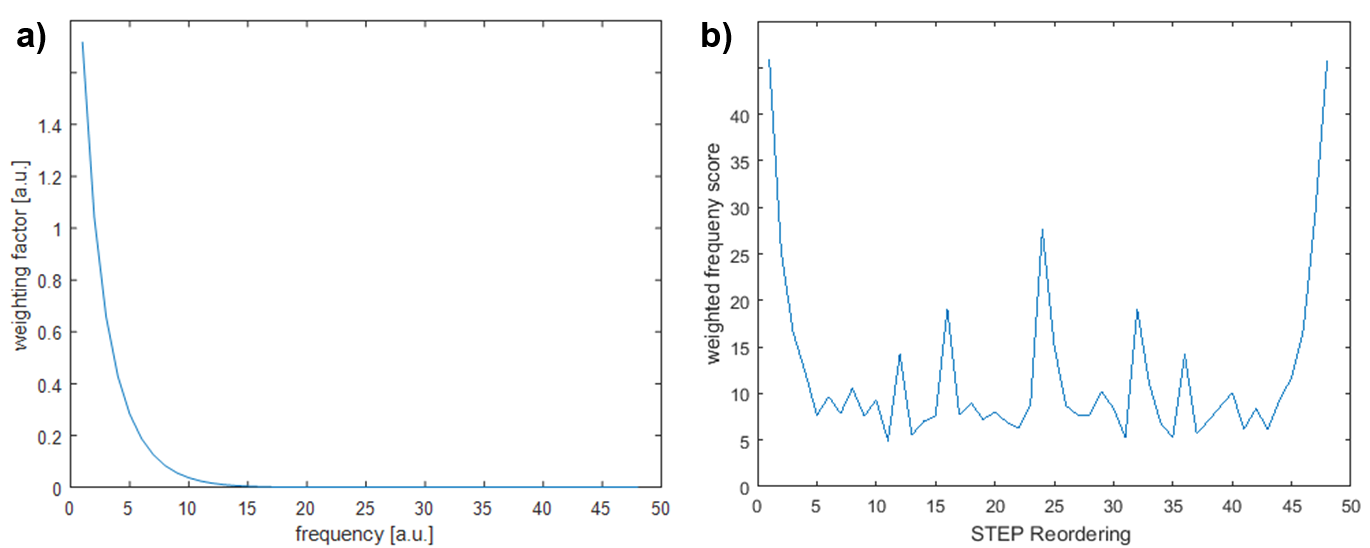
a) Function used for weighting the frequency spectrum of the residuals. b) Weighted frequency score of residuals from all pixels in the phantom from figure 1. Residuals were computed by reordering the sum of residuals according to STEP patterns. Weighted frequency score for all STEP reorderings is shown. High score means that residuals have a relatively high amount of low frequency components. STEP-11 turns out to be the best STEP reordering, regarding this measure. be the best STEP reordering, regarding this measure.
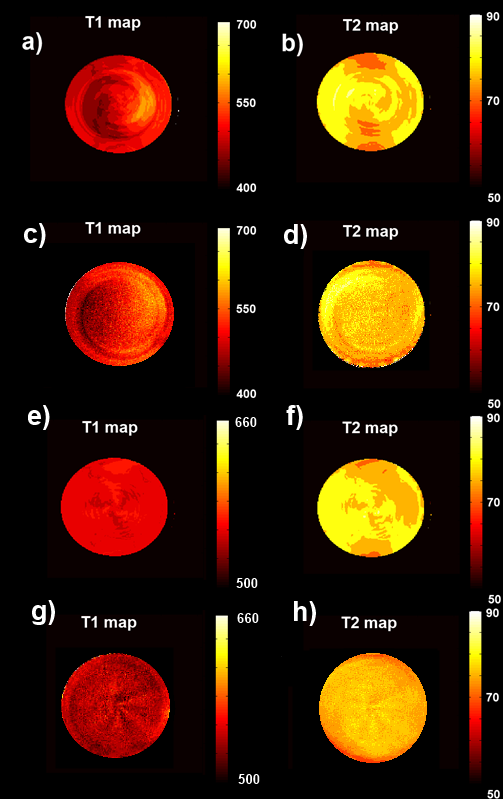
a) b) parameter maps resulting from matching artificial undersampled signals using the PCF formalism. c) and d from measurement with the same parameters. a) b) c) d) use ascending reordering. e) f) g) h) STEP-15 reordering. e) and f) result from simulations using the PCF formalism and g) and h) from measurement. Spatial bias is clearly visible in the T1 maps a, c) and the T2 map b), d). It is mitigated with the STEP-15 reordering both in simulation and experiment.