3950
SNR analysis and sequence parameter optimization for T1 and T2 mapping using an ellipse fitting approach of phase cycled bSSFP data1Center for Imaging Sciences/Imaging Division, University Medical Center Utrecht, Utrecht, Netherlands, 2Dept. of Radiotherapy/Imaging Division, University Medical Center Utrecht, Utrecht, Netherlands, 3Image Sciences Institute/dept. of Radiology, University Medical Center Utrecht, Utrecht, Netherlands
Synopsis
An ellipse fitting approach has been recently proposed for simultaneous estimation of the relaxation times T1 and T2 from phase-cycled balanced steady-state free precession (PC-bSSFP). In this work we present an analysis of the SNR sensitivity of the proposed method and optimization of the sequence parameter settings. We demonstrate, that it is feasible to perform an accurate and precise T1 and T2 mapping while using an optimal FA and TR combination for realistic SNRs.
Purpose
Recently, an ellipse fitting approach for simultaneous estimation of the relaxation times T1 and T2, the off-resonance Δf0 and the banding free magnitude M from phase-cycled balanced steady-state free precession (PC-bSSFP) was presented [1]. Here we present an analysis of the SNR sensitivity of the proposed method and subsequent optimization of the sequence parameter settings for optimal precision and accuracy in T1 and T2 estimates in relation to the SNR.Methods
The elliptical signal model was used to describe the complex PC-bSSFP steady-state signal [2,3] :
$$I=M_{eff} \frac{1-ae^{i\theta}}{1-b\cos\theta}e^{i\Omega TE},$$where $$$M_{eff}=M\exp{(-\frac{TE}{T_{2}})}$$$, $$$M=\frac{M_{0} (1-E_{1}) \sin\alpha}{1-E_{1}\cos\alpha-E_2^2 (E_{1}-\cos\alpha)}$$$, $$$a=E_{2}$$$, $$$b=\frac{E_{2}(1-E_{1})(1+\cos\alpha)}{1-E_{1}\cos\alpha -E_2^2 (E_{1}-\cos\alpha)}$$$, $$$E_{1}=\exp(-\frac{TR}{T_{1}})$$$, $$$E_{2}=\exp(-\frac{TR}{T_{2}})$$$, M0 - the equilibrium magnetization, α - the flip angle, TR - the repetition time, θ - the resonance offset angle, θ = θ0 + ∆θ, θ0 = 2π(δCS+Δf0), ∆f0 - the off-resonance, caused by local field deviations, δCS - the chemical shift of the species with respect to water, ∆θ - the user controlled RF phase increment.
To investigate the optimal choice for FA and TR, Monte Carlo simulations were performed (Matlab R2015a) for a range of FA 0-90˚ and TR 0-50 ms for the initial settings: M0 = 10000, T1 = 675 ms, T2 = 75 ms, ∆f0 = 0, δCS = 0, 10 phase cycles with phase increments $$$∆\theta_{n}=\frac{2\pi n}{10}, n=\left\{0,1...9\right\}$$$. The chosen T1 and T2 represent white matter. Gaussian noise with a standard deviation σ = 16 was added to the complex data, resulting in an SNR range 30-100. The accuracy of the method was assessed by calculating the absolute errors in T1 and T2 estimates.
The SNR was defined as $$$SNR=\frac{\sum_{n=1}^N \mid I_{n}(\theta)\mid}{N\sigma}$$$, as proposed by Björk et.al. [4], with $$$\mid I_{n}(\theta)\mid$$$ - the magnitude of nth phase-cycled image, N - the total number of phase cycles, σ – the standard deviation of noise in each bSSFP acquisition.
The precision of the method was assessed by calculating the standard deviation of T1 and T2 estimates. The minimum SNR required to obtain a 5% precision, was calculated for the same initial parameter settings and the found optimal combination of TR and FA.
MRI experiments on a phantom (TO5, Eurospin II test system, Scotland) and in vivo (brain of healthy volunteer) were performed on a clinical 1.5T MR scanner (Philips Ingenia, Best, The Netherlands). A 16-channel head receive coil was used. Sequence parameter settings: 3D bSSFP, FOV 220x220x80 mm3, voxel size 1.5x1.5x4 mm3, TR 10 ms, FA 20˚, 10 phase cycles.
Results
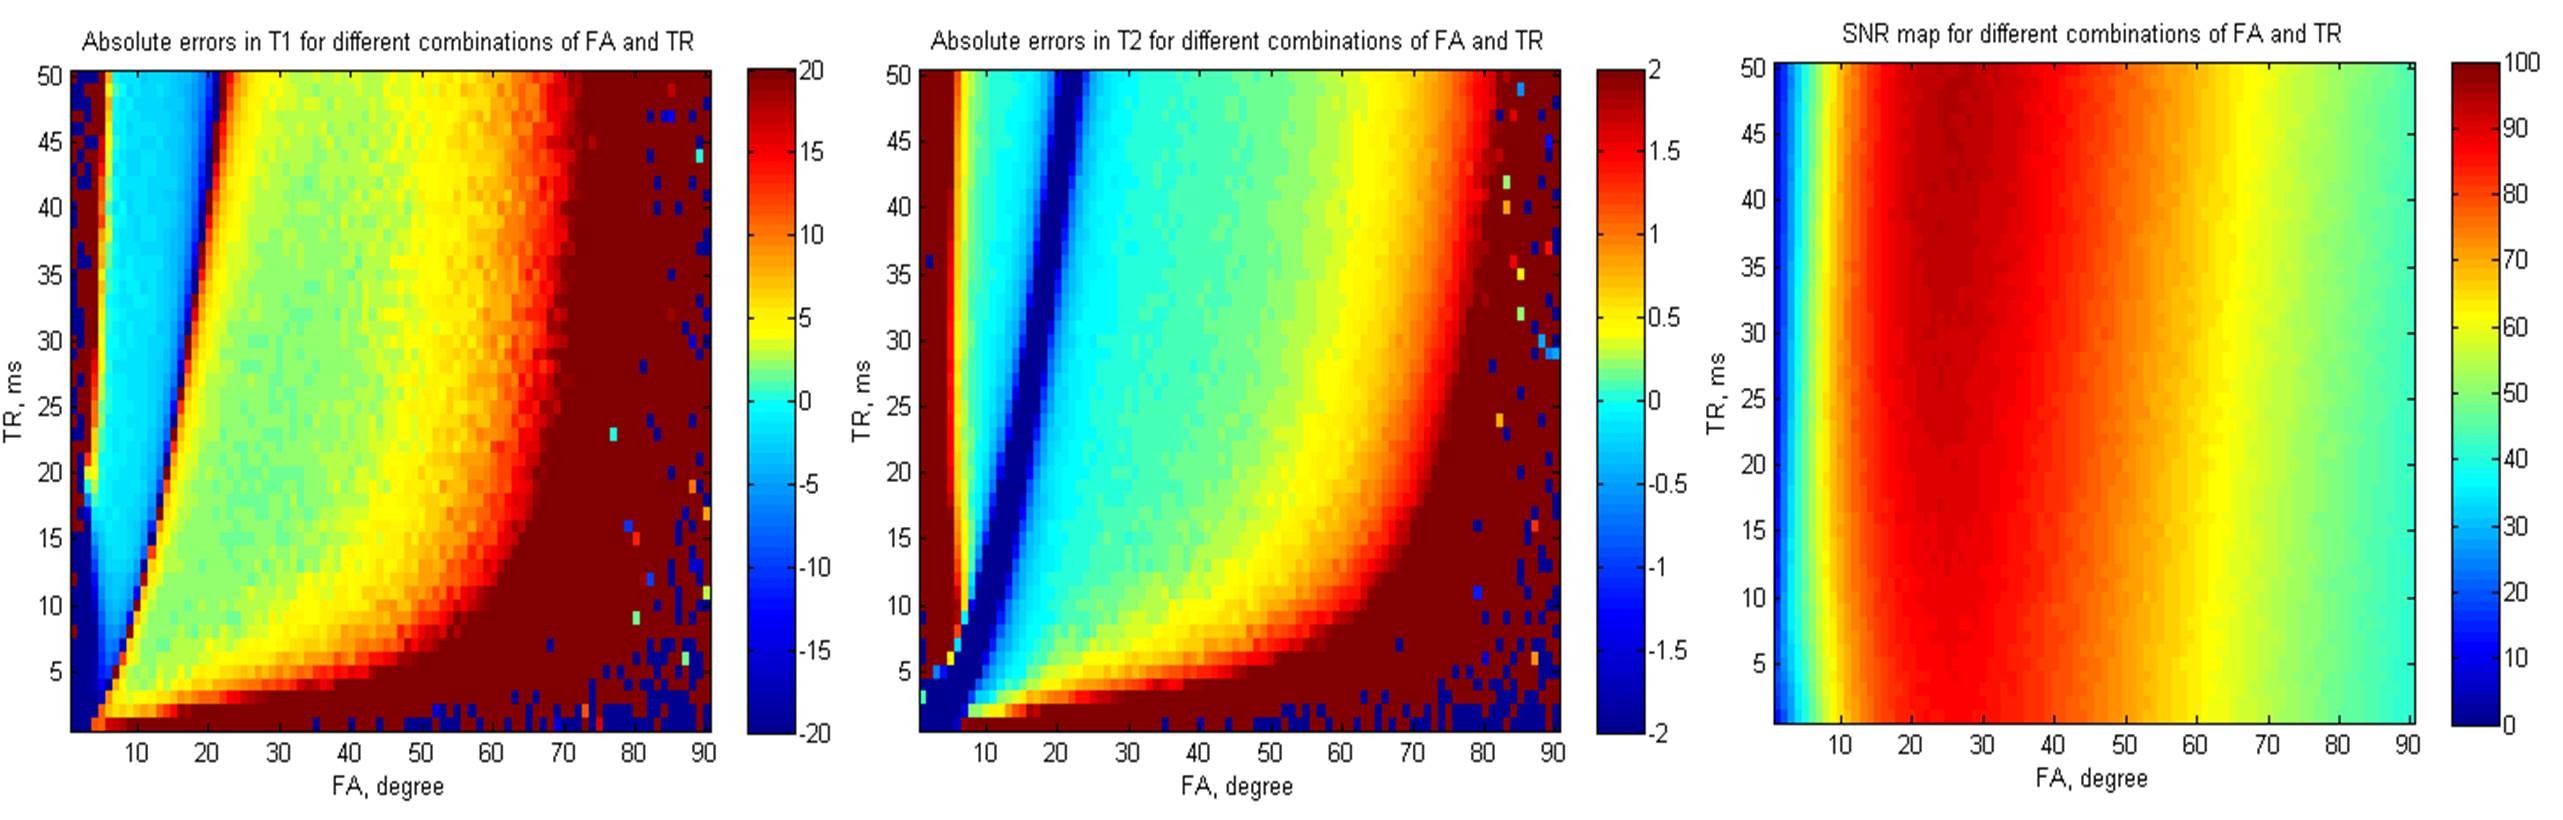
Figure 1 provides the absolute errors in T1, T2 and corresponding SNR values for different FA-TR combinations. The green area corresponds to “favorable combinations” of FA and TR, where the absolute errors in T1 and T2 are less than 5 ms (for T1) and 0,5 ms (for T2), which gives an accuracy of 1% .
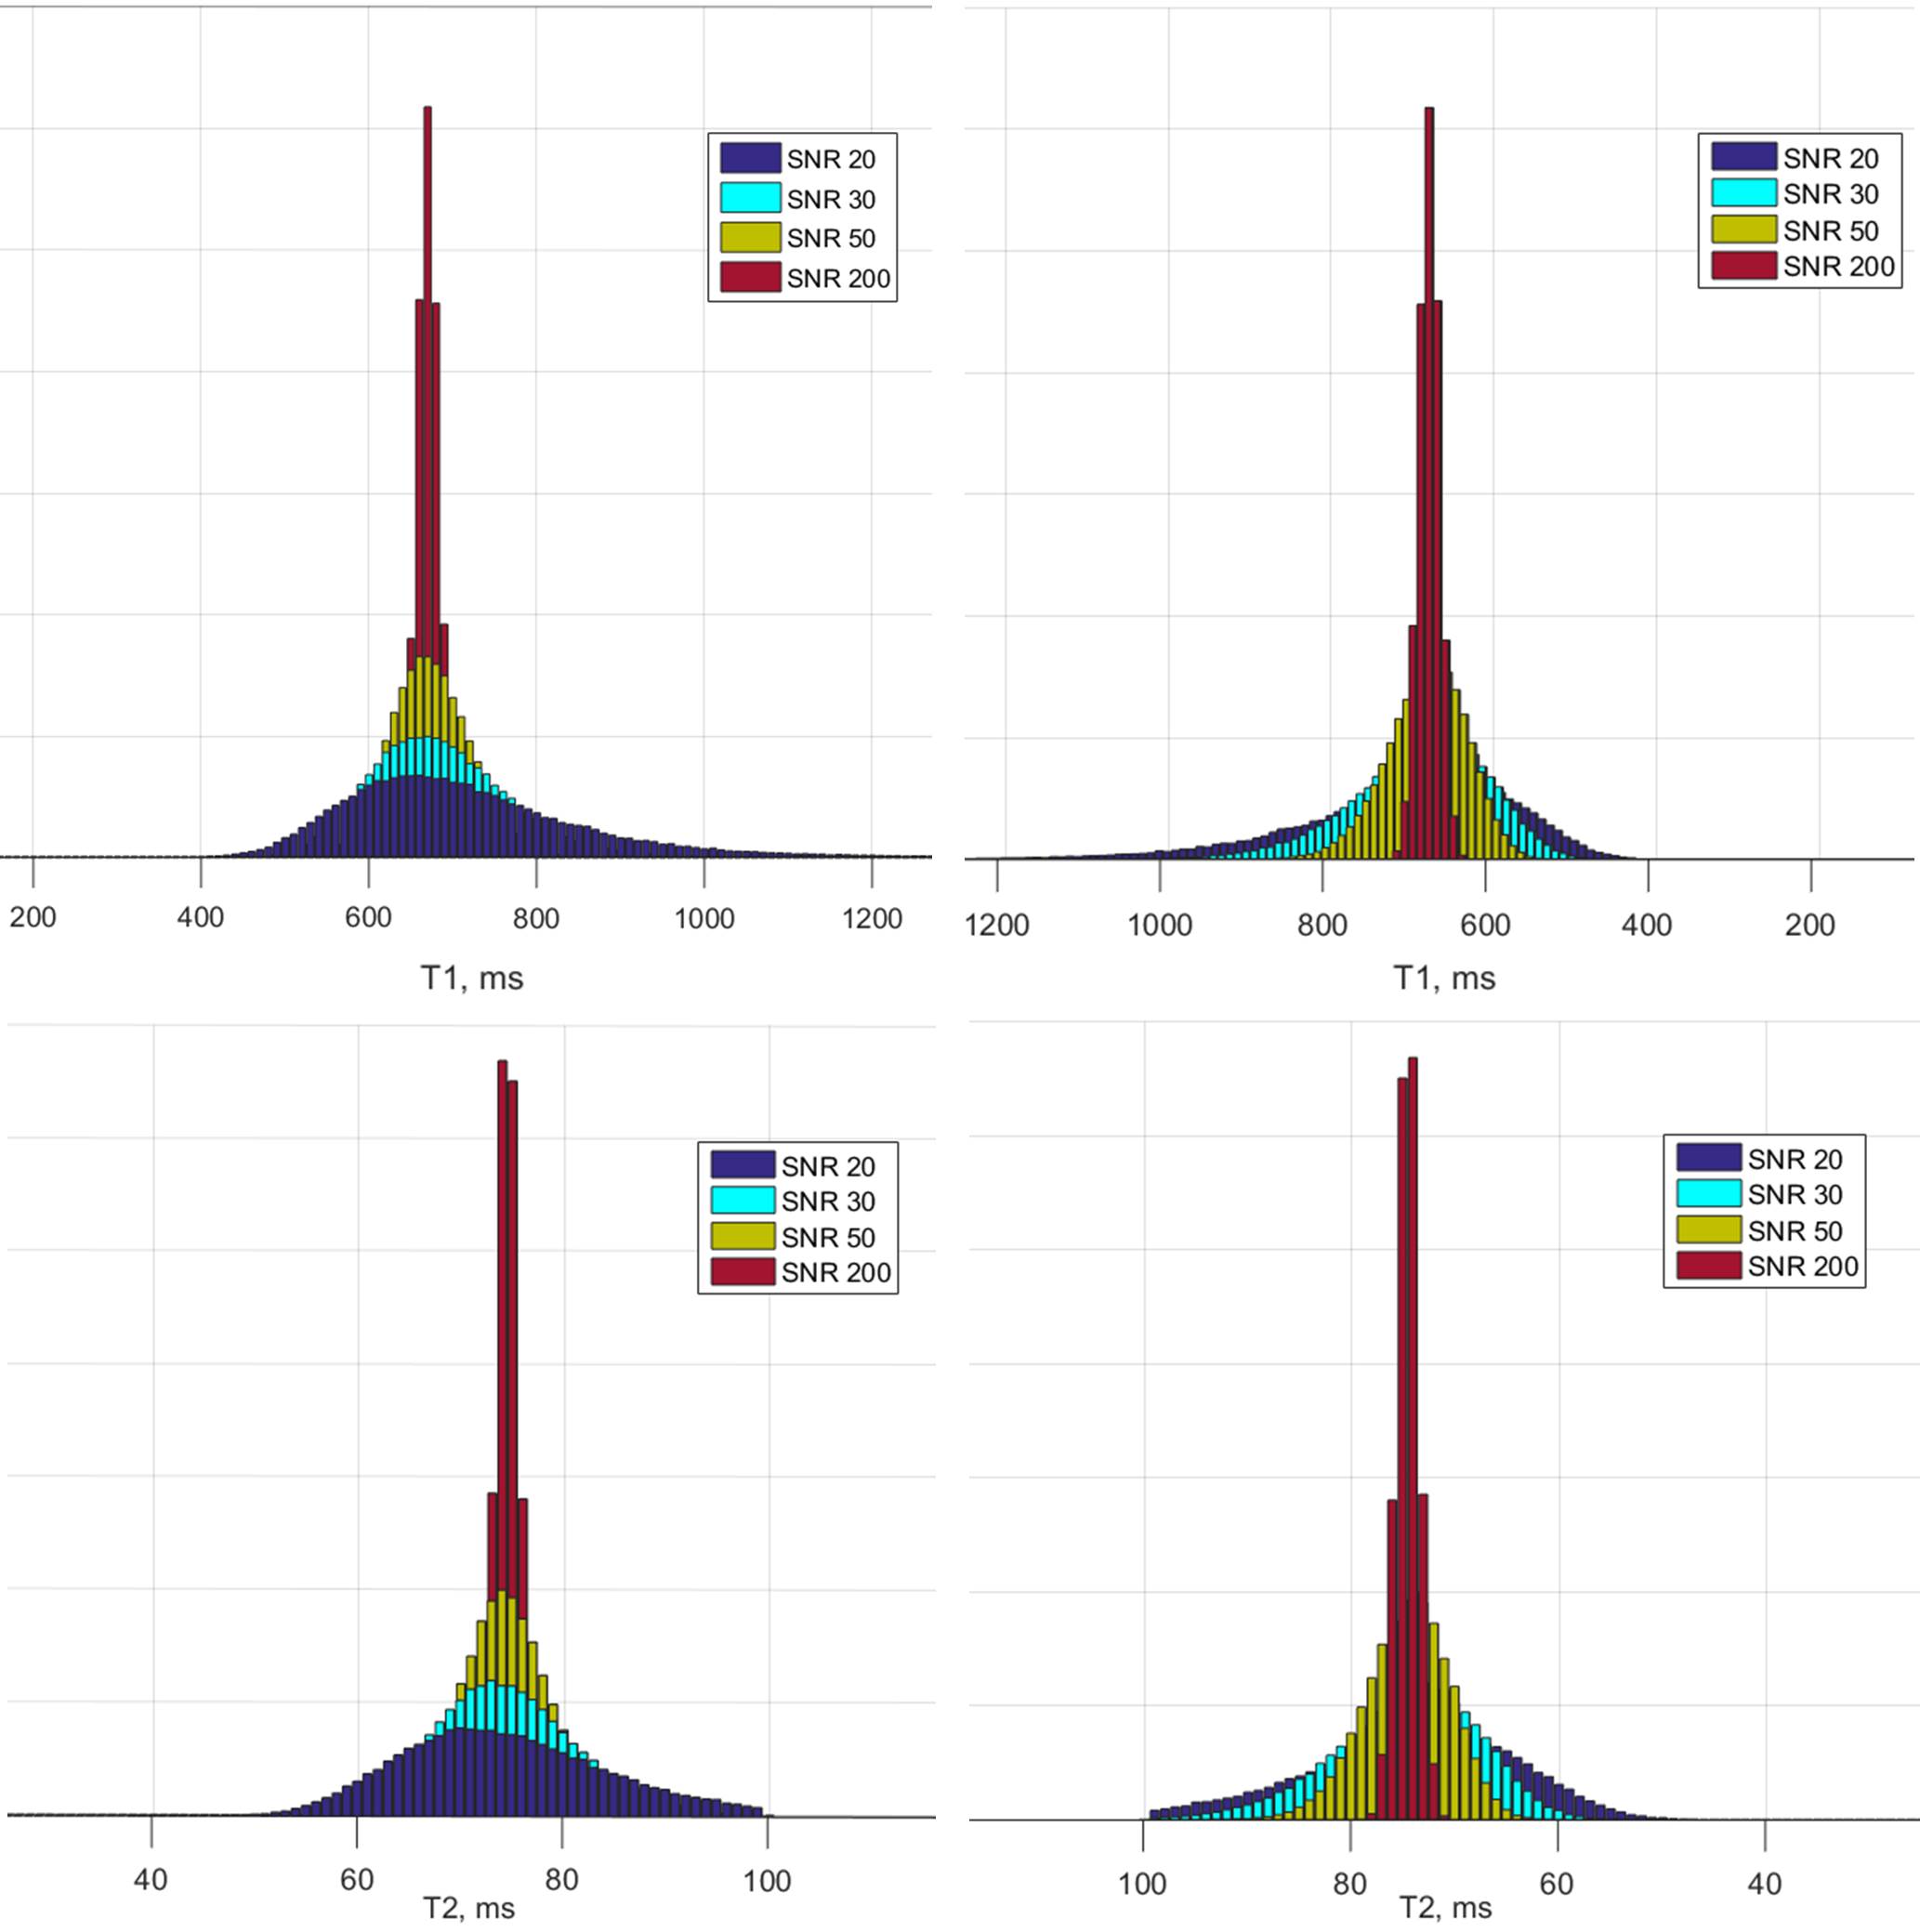
Figure 2 demonstrates the distribution of T1 and T2 estimates for different SNR in histograms for the optimal combination of FA and TR and the same initial parameter settings. The peaks become narrower and more symmetrical with increasing SNR, while a bias exists for low SNR.
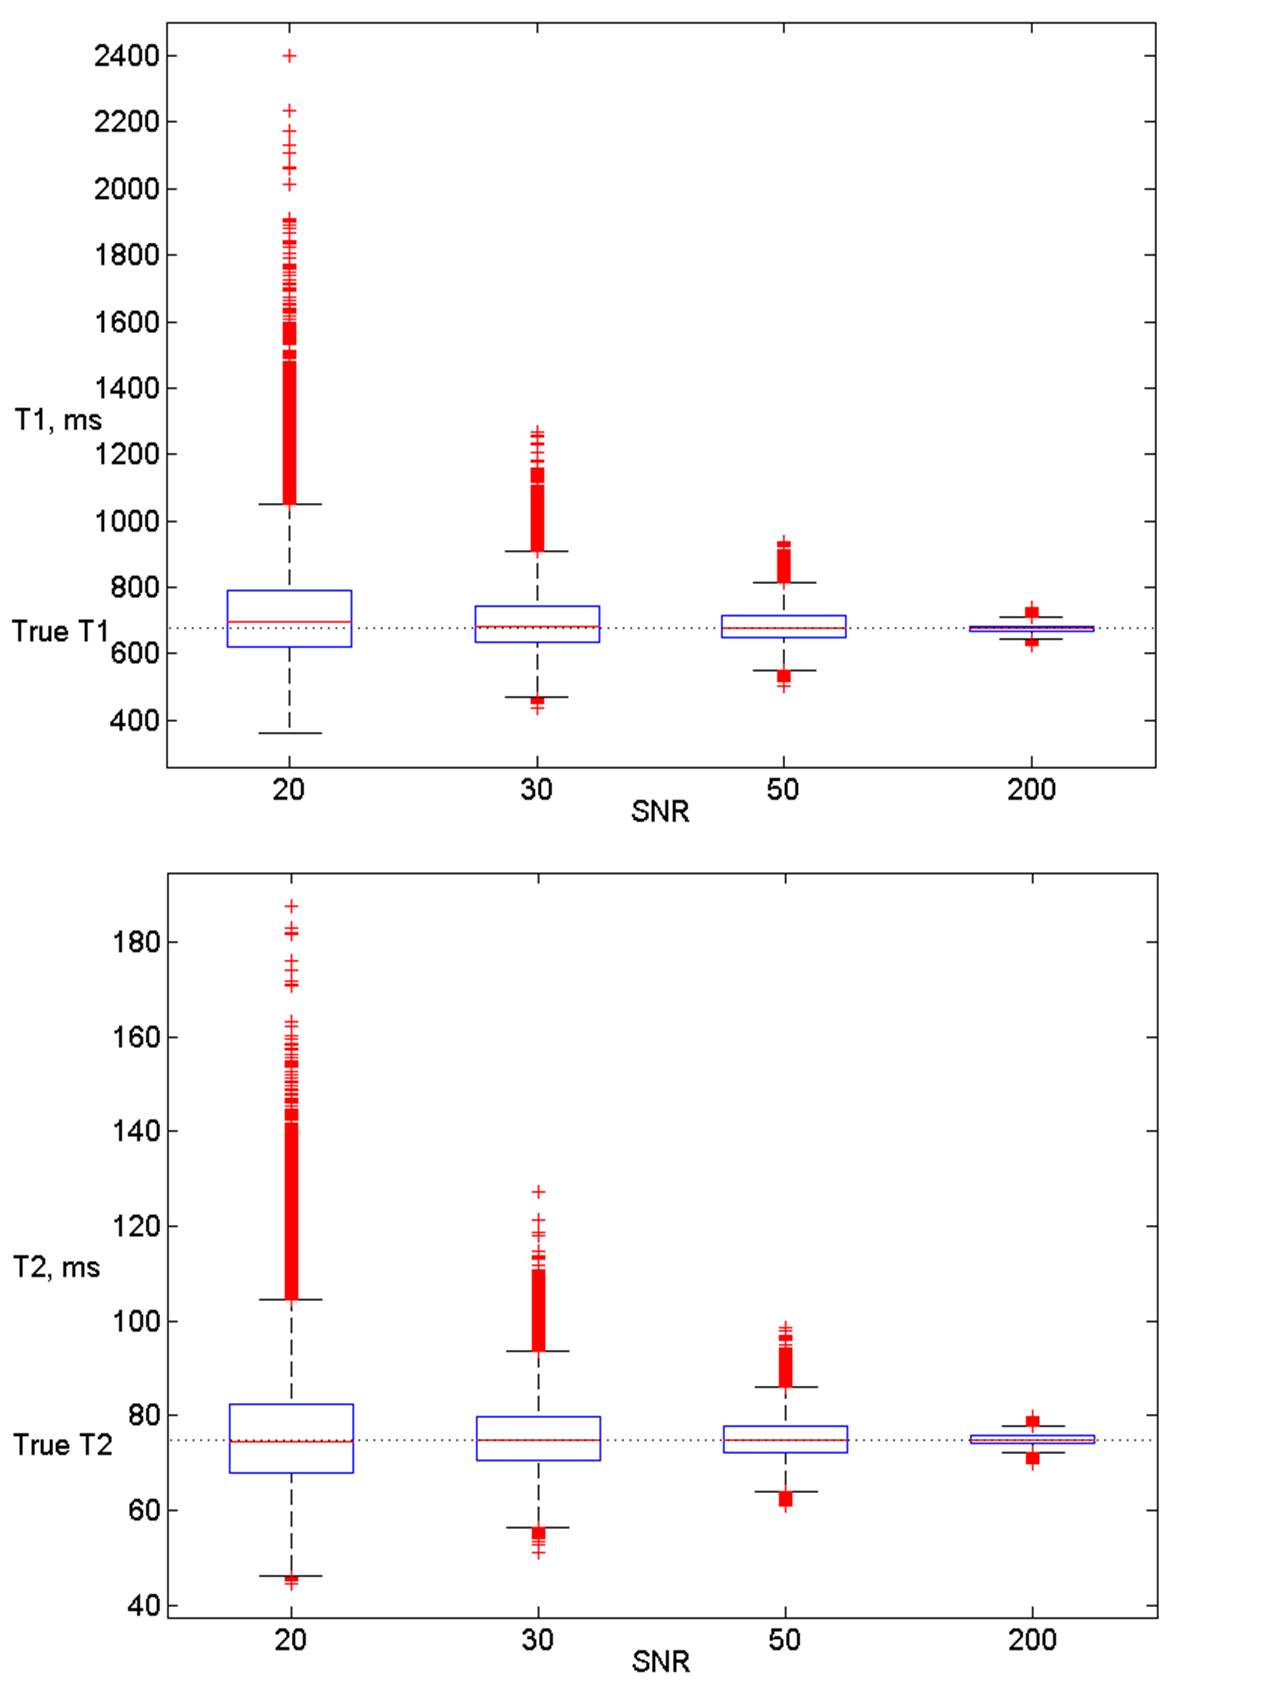
Figure 3 demonstrates the distribution of T1 and T2 estimates for different SNR. The interquartile range (IQR) becomes smaller with the SNR increasing and the median values approaches the true values of T1 and T2.
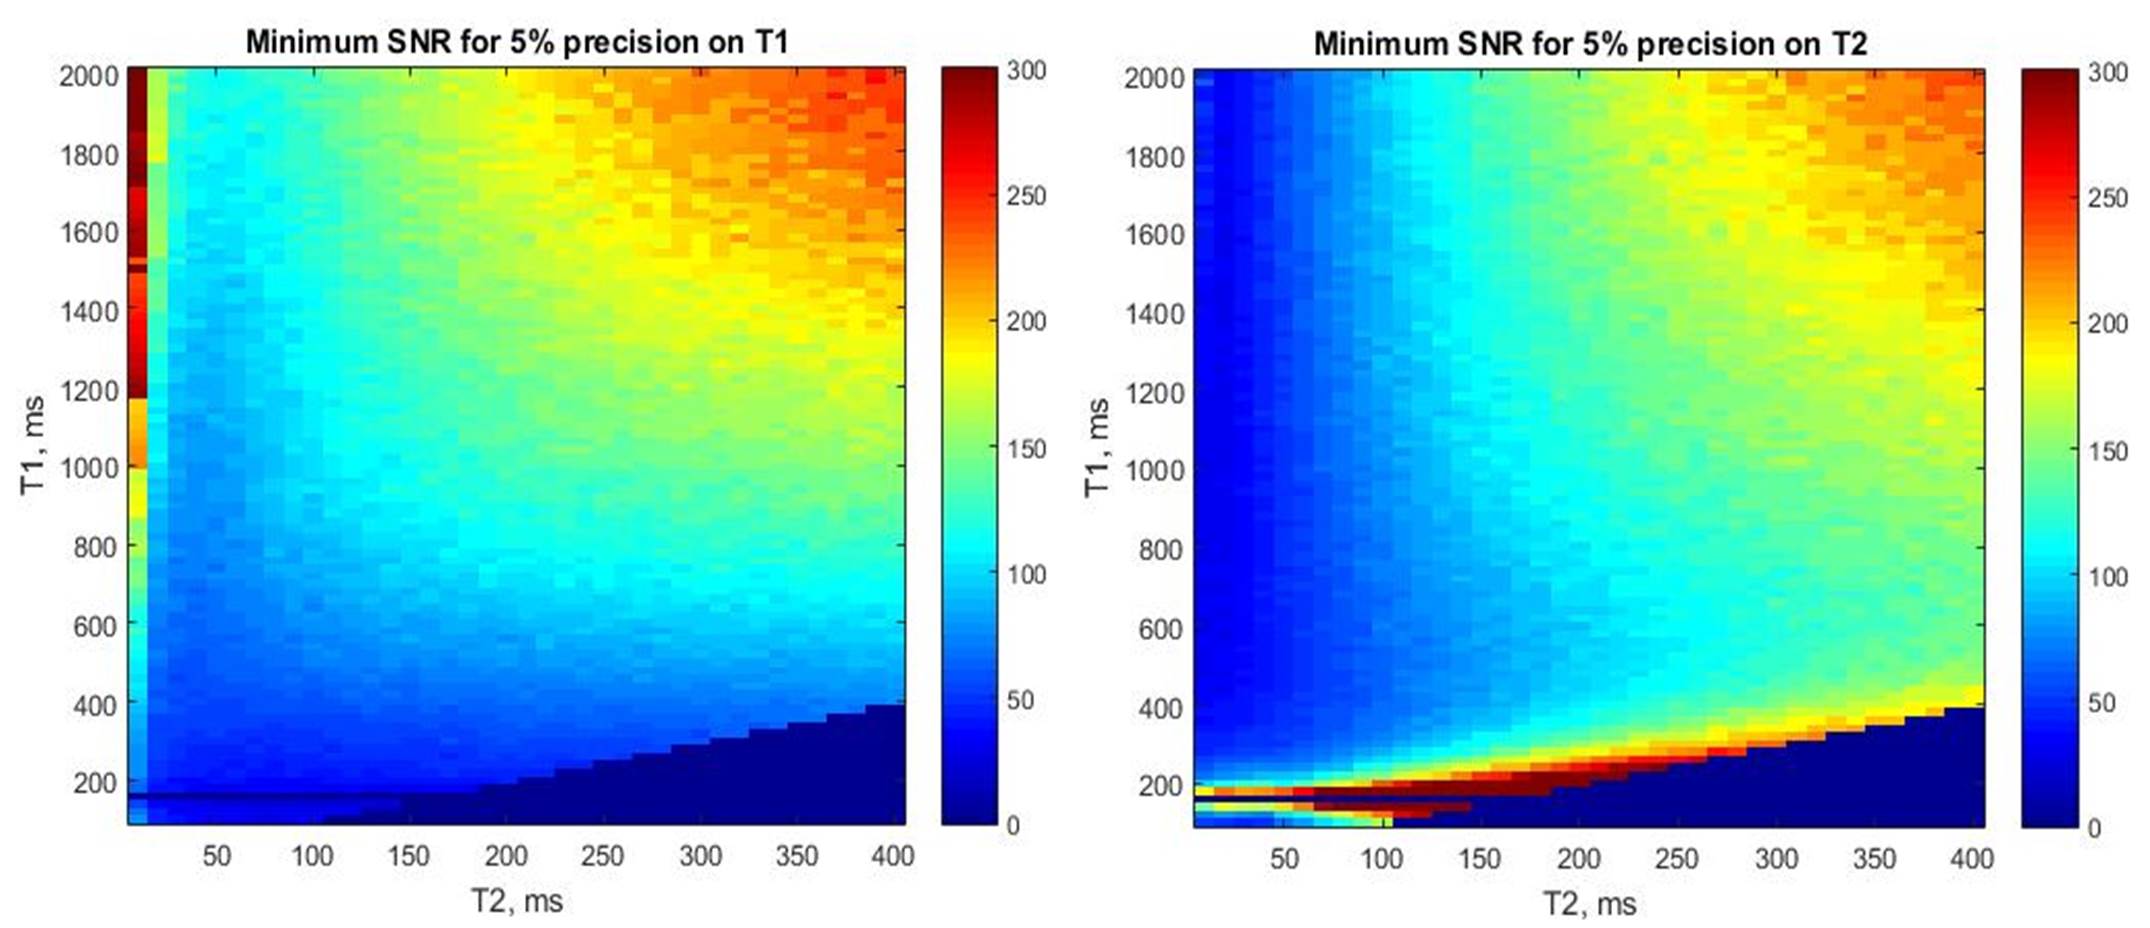
Figure 4 shows the minimum required SNR to achieve a 5% precision in T1 and T2 estimation. For white matter the minimum SNR is 75 and for gray matter it is 100.
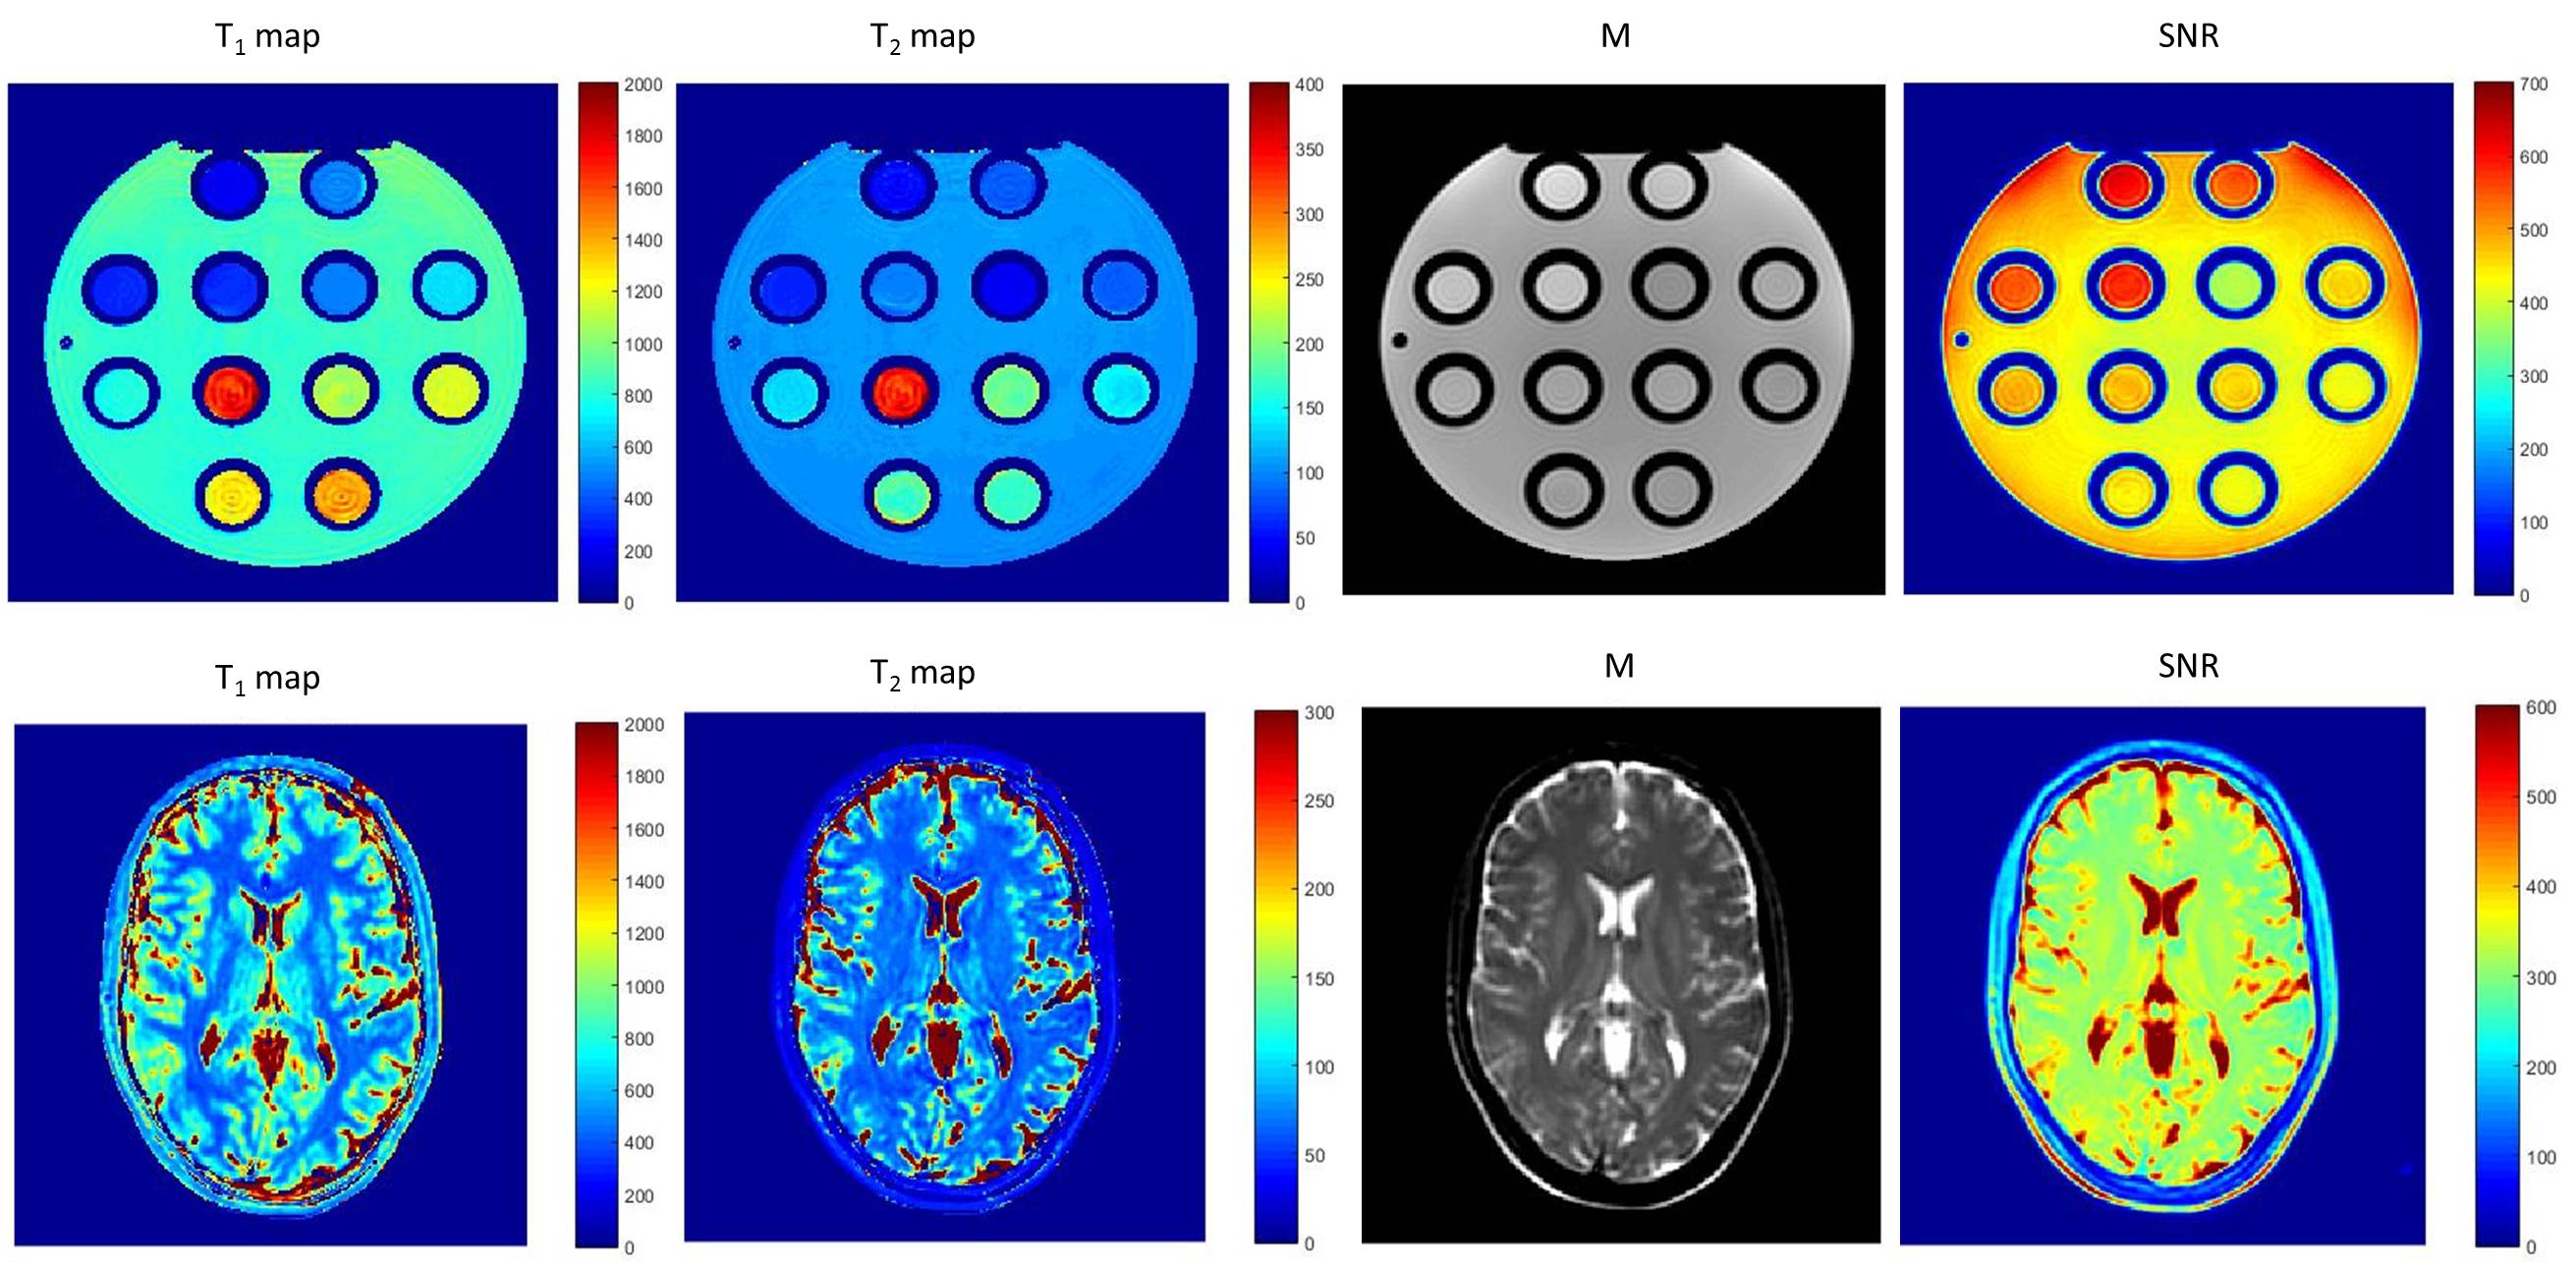
Figure 5 presents experimental results for the phantom and in vivo.
Discussion and Conclusion
We have demonstrated that optimizing FA and TR settings results in more accurate estimation of relaxation times T1 and T2. There is an “optimal spot” of TR and FA with a 1% accuracy in T1 and T2 estimates. Taking into account that the scan time increases with TR, we have identified the combination of TR 10 ms, FA 20˚ as an optimal combination. The minimum SNR, required to achieve the precision of 5% on T1 and T2 estimation using the optimal TR-FA combination for white matter was found to be 75 and 100 for gray matter, which is lower than what we typically obtained in the phantom (average SNR 450) and in vivo (average SNR 350) for a voxel size of 1.5x1.5x4 mm3. We therefore conclude that it is feasible to perform accurate and precise T1 and T2 mapping using the ellipse fitting approach. Our future work will include an investigation of the minimally required number of phase cycles and optimal RF phase increment settings under realistic circumstances, taking into account realistic off-resonance distributions.Acknowledgements
This research is supported by the Dutch Technology Foundation STW, grant 12813References
[1] Shcherbakova et.al. Proc 24th ISMRM, p. 0695 (2016); [2] Lauzon et al. Concepts Magn Reson 34A:133–143 (2009); [3] Xiang et.al. MRM 71:927-933 (2014); [4] Björk et.al. MRM 72:880–892 (2014)Figures