3949
3D motion quantification based on the temporal evolution of the noise covariance matrix of a receive array1Department of Radiotherapy, Center for Image Sciences, University Medical Center Utrecht, Utrecht, Netherlands, 2IMB, UMR 5251 CNRS/University of Bordeaux, Bordeaux, France
Synopsis
Motion quantification is essential for successful MR imaging and MRI guided radiotherapy of mobile organs. Currently, 3D MRI is too slow to quantify organ displacements and a motion model could alternatively be used for tracking and/or motion compensation. A motion model trained on MRI data and driven by the noise covariance matrix (NCM) of a receive array is proposed to quantify internal anatomy motion. Passive thermal noise measurements have a high temporal resolution (~10ms) and do not interfere with or rely on MR signal. Abdominal organ displacement can be accurately estimated in 3D, through the NCM of the receive array.
Purpose
Motion quantification is essential for successful MR imaging and MRI guided radiotherapy of mobile organs. Currently, 3D MRI is too slow to quantify organ displacements and a motion model driven by a surrogate signal could alternatively
be used for tracking and/or motion compensation. Recently, a 2D motion model trained on cine MRI data and driven by the noise covariance matrix (NCM) of a receive array was proposed
to quantify internal anatomy motion1. Passive thermal noise measurements have a high temporal resolution (~10ms) and do not interfere with or rely on MR signal. For either tracking or motion compensation, however, 3D displacement characterization is required. Hence the NCM based motion
model was extended from 2D to 3D. NCM element fluctuations correspond to temporal tissue displacements, spatially weighted by the (overlapping) receive coil electric fields. To illustrate the NCM correlates better to 3D motion than a conventional respiratory bellows, both were compared.
Methods
Three volunteer
experiments were performed on a clinical 1.5T MR scanner (Ingenia, Philips Healthcare, Best, NL). Signal was
acquired with a
28 channel torso
receive array, consisting of overlapping loop coils. Noise samples
were obtained from the MR signal-free part of each
read-out line. To ensure a sufficient amount of noise samples, the
FOV was extended in read-out direction without affecting TR or SNR. A 3D balanced gradient
recalled echo (GRE) was acquired with a 50ᵒ
flip angle, 0.8ms TE, 1.98ms TR, 3x3x3mm voxel size and 560x300x380mm FOV. Two sets (20
minutes apart) of eighty
sagittal 3D balanced GRE frames (0.93s
per frame) were recorded continuously per volunteer. One was used to build
the model (i.e. training) and the other to test the performance. The training included an inhaled and
exhaled breath hold, whereas the test set contained only free
breathing. Displacement fields were calculated by the optical flow algorithm2.
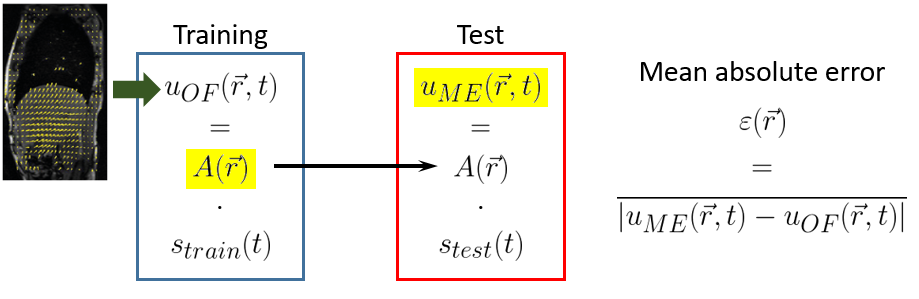
To build the linear motion model, the pixel-wise correspondence matrix $$$A(\vec{r})$$$ was calculated to link a surrogate $$$s(t)$$$ to the MR-derived 3D displacement field $$$u_{OF}(\vec{r},t)$$$ for the training set (see Figure 1). $$$A(\vec{r})$$$ was then applied to the test set surrogate signal. The respiratory bellows and NCM were tested as surrogate. For the NCM surrogate, principle component analysis along coil dimension was used to decrease data redundancy. To assess the performance of the motion model, the correlation and mean absolute error between the MR-derived and model estimated displacement fields were calculated for both the training and test set.
Results
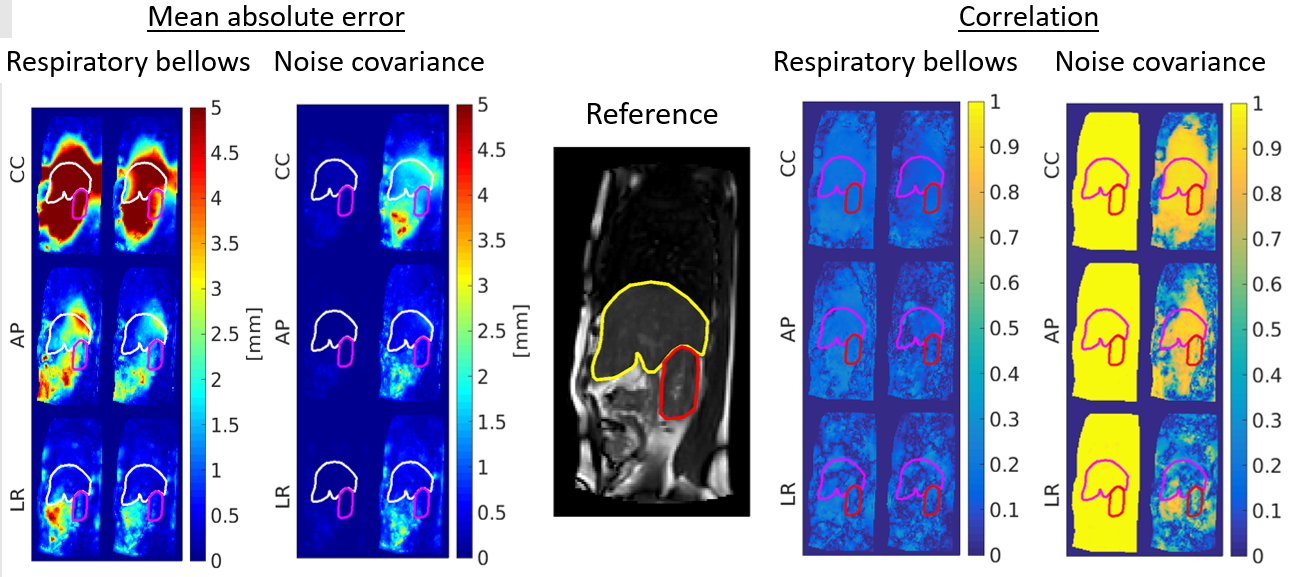
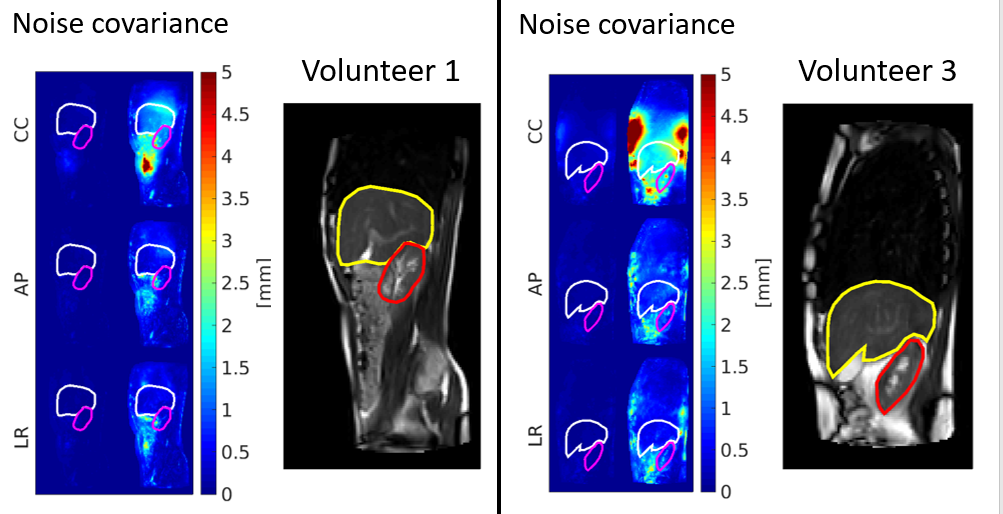
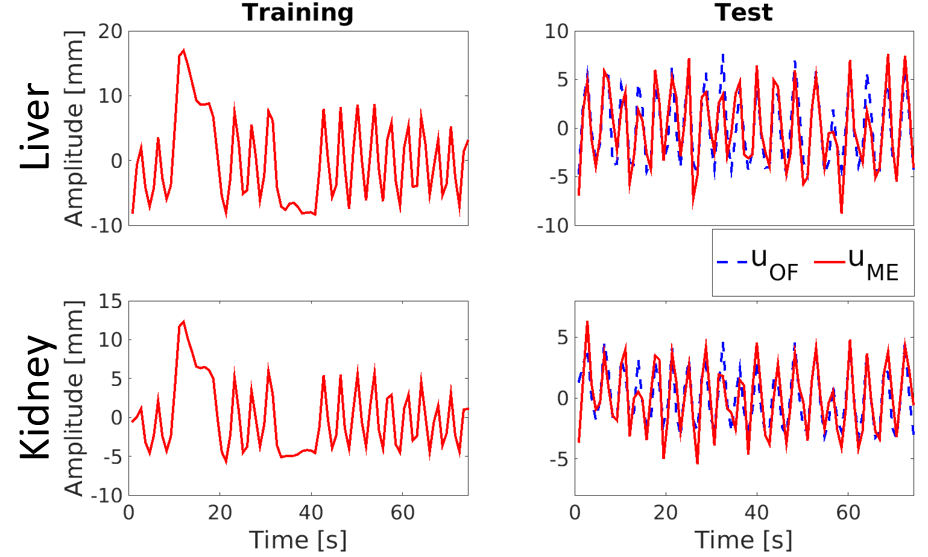
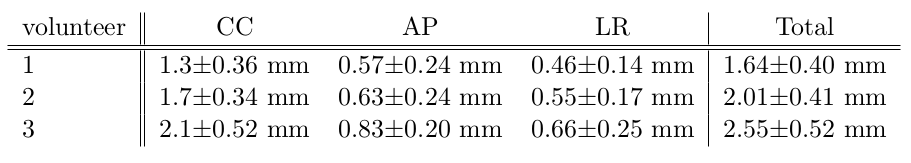
The correlation is higher for the NCM than respiratory bellow in all cases (see Figure 2). Consequently, the error is lower for the NCM. When ignoring the image artifact induced errors (see Figure 3), the intestines are the main error source in all three motion directions for all volunteers. The total error for all volunteers within the liver volume were $$$1.64\pm0.4$$$mm, $$$2.01\pm0.41$$$mm and $$$2.55\pm0.52$$$mm (see Table 1). The estimated (red) and calculated (blue dashed) displacements of a voxel in the liver and kidney match well for the training set (see Figure 4). In the test set, there are some discrepancies.
Discussion
The correspondence matrix was calculated over the training set, therefore the correlation should be maximal for this period. The low training correlation of the respiratory bellows, suggests it cannot describe 3D motion. The bellows is a measure for respiratory phase, whereas the NCM contains volumetric internal organ motion information3. Nevertheless, the correlation in left-right direction for NCM was lower than expected. The relatively low displacement amplitude (~2mm) in this direction, most likely causes this low correlation. In the NCM based model, the highest physiology induced errors were caused by the intestines for all volunteers. Since peristalsis is not fully encompassed within the training, a motion model cannot reliably describe and thus estimate it.
As previously shown4, the NCM could be prospectively calculated per read-out line (1.98ms) instead of per frame (930ms) to increase temporal resolution for motion tracking. Apart from the sampling settings, the noise is independent from the used MR sequence. Moreover, passive noise measurements do not interfere with or rely on MR signal. Thus after training the proposed motion model can be applied to any MR sequence (e.g. to perform motion compensation per read-out line).
Conclusion
The displacement of abdominal organs can be accurately estimated in 3D, through the NCM of the receive array. The NCM correlates to internal organ motion, whereas the respiratory bellows does not. Thus the respiratory bellows based motion model results in larger mean absolute errors. In the future, motion compensation in k-space and tracking for radiotherapy based on an NCM driven model will be investigated.
Acknowledgements
References
1. Andreychenko A., et al. Spatial motion model driven by the noise covariance matrix of a receive array, Proc. Intl. Soc. Mag. Reson. Med. 23 (2015) p 97
2. Zachiu C., et al. An improved optical flow tracking technique for real-time MR-guided beam therapies in moving organs. Physics in Medicine and Biology 60(23):9003-29 (2015) doi: 10.1088/0031-9155/60/23/9003
3. Andreychenko A., et al. Thermal noise variance of a receive radiofrequency coil as a respiratory motion sensor. Magn. Reson. Med. (2016) doi:10.1002/mrm.26108
4. Navest R.J.M., et al. Predictive Sensor for Real-Time Respiratory Motion Monitoring, Proc. Intl. Soc. Mag. Reson. Med. 23 (2015) p 814Figures