3938
Exploring the Sensitivity of Magnetic Resonance Fingerprinting to Different Types of Motion and Possible Correction Mechanisms1Bernard and Irene Schwartz Center for Biomedical Imaging, Department of Radiology, New York University School of Medicine, New York, NY, United States, 2Center for Advanced Imaging Innovation and Research (CAI2R), Department of Radiology, New York University School of Medicine, New York, NY, United States, 3The Sackler Institute of Graduate Biomedical Sciences, New York University School of Medicine, New York, NY, United States, 4Siemens Medical Solutions USA, Inc., Siemens Healthineers, New York, NY, United States
Synopsis
In this work, we experimentally explore the sensitivity of Magnetic Resonance Fingerprinting (MRF) to various types of motion at different time intervals during the scan. Our results show that the T1 values are least affected by motion, but the maps may be blurred if the motion occurs early in the scan. Also, motion in the middle of the scan leads to a systematic underestimation in T2. In addition, we show that simply removing the corrupted time-points from the data can restore quantitative parameter values to the correct range.
Purpose
Patient motion is one of the most common causes of artifacts in clinical magnetic resonance imaging (MRI). Initial experiments by Ma et al [1], suggested that Magnetic Resonance Fingerprinting (MRF) may be more motion robust than conventional MRI. In their experiment, the subject rotated his head by a large angle during the last 3 seconds of a 15-second-scan. Although ordinary motion patterns are more subtle, subjects could move at any time during the acquisition, not necessarily at the end. In this work, we experimentally explored the motion sensitivity of MRF to various types of motion at different time intervals during an MRF scan. Based on the resulting observations, we designed a basic motion correction approach for MRF.Methods
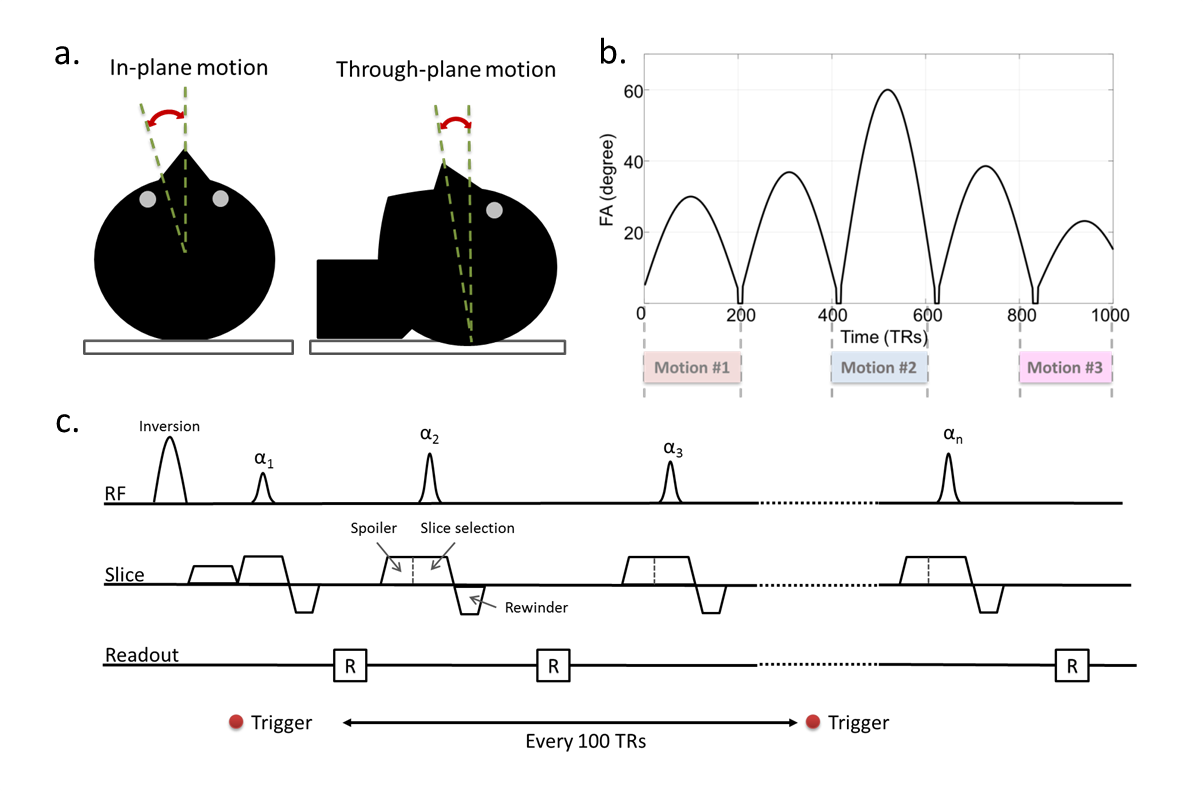
We imaged a transversal slice through the brain of a normal volunteer. The subject was instructed to perform three different types of motion: in-plane motion, through-plane motion and random combinations of in-plane and through-plane motion. Similar to actual clinical head scans, all movements were restricted to small angles by cushions placed around the subject’s head (Fig.1a). A total of 10 measurements were performed, one without motion and nine scans to cover all possible combinations of motion and time intervals (Fig.1b). The projector in the scanner room was used to instruct the subject about when and how to move during each scan.
A radial version of the FISP-MRF sequence [2] was used for each scan (RF time-bandwidth product of 2, 4ms pulse, five radial spokes/time frame, one spoke per shot). A trigger signal was incorporated into the sequence to time the projected instructions (Fig.1c). The MRF dictionary was created using the extended phase graph [3] formalism, and included the slice profile as detailed in [4].
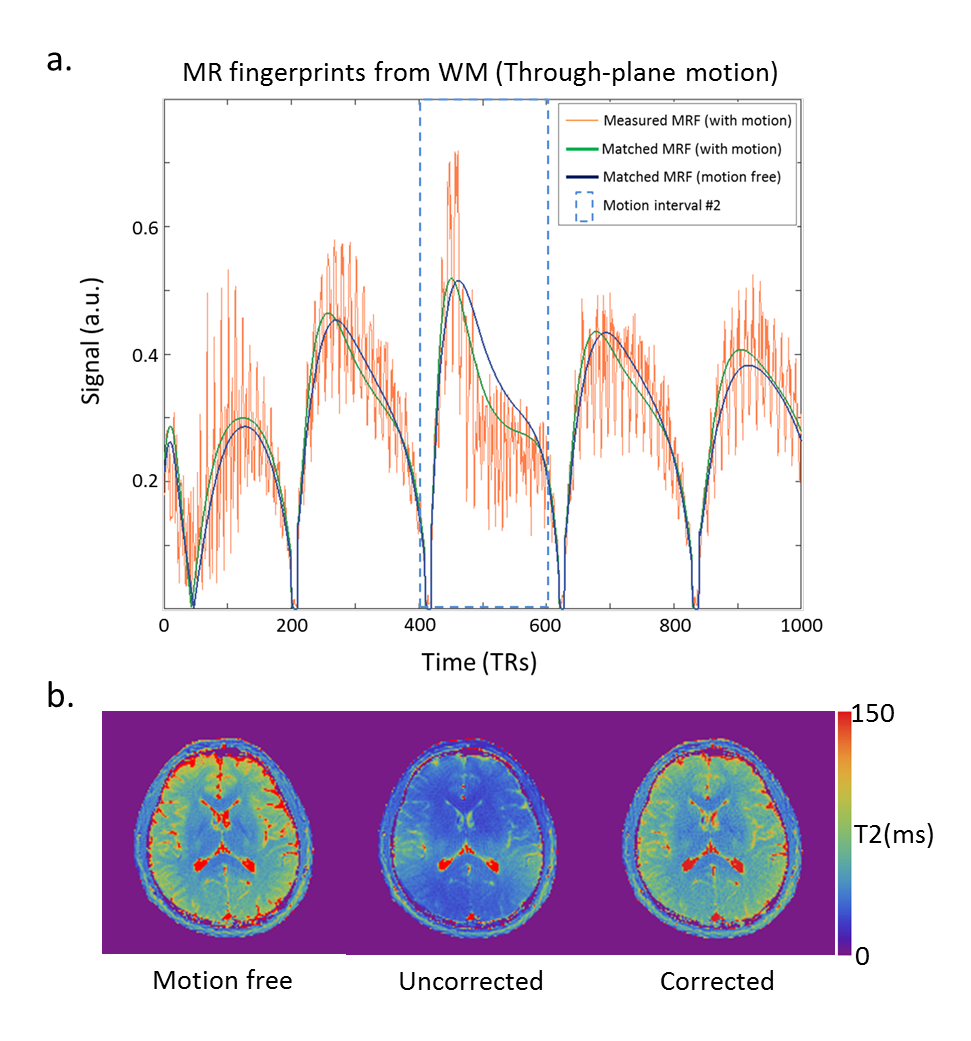
We also implemented a basic motion correction procedure that capitalizes on data redundancy by simply removing motion-corrupted data points from the fingerprints and the dictionary. After renormalization of the reduced dictionary, the data can be reconstructed in the traditional way.
All experiments were performed on a 3 T MAGNETOM Skyra (Siemens Healthineers, Erlangen, Germany) using the standard 20 channel head coil. The study was approved by our institutional review board.
Results & Discussion
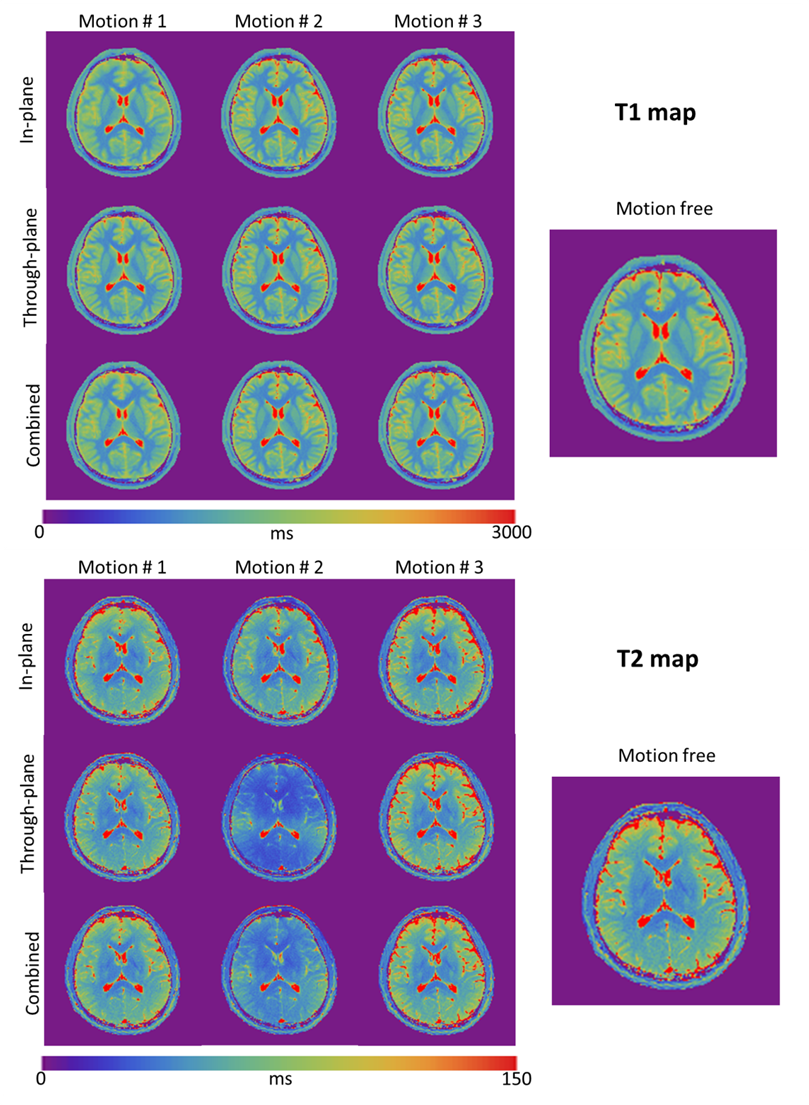
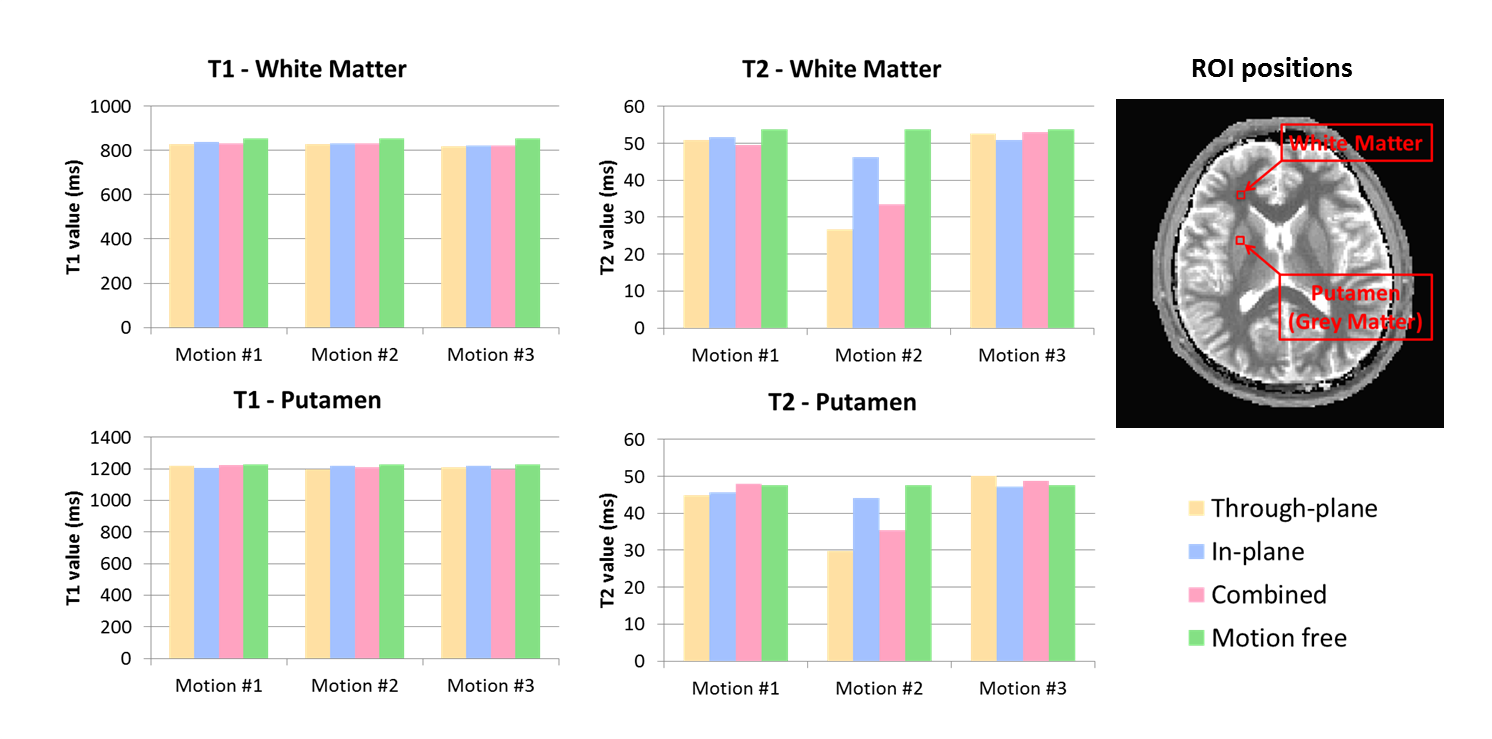
Figure 2 shows the T1 & T2 maps obtained during each scan. Despite of the motion, the morphological structures are well preserved in the MRF maps. However, T2 values showed a considerable deviation from the motion-free scan. To quantify the changes, we performed a region of interest (ROI) analysis for both T1 and T2 maps (Fig.3). T2 values were most affected when the motion occurred in the middle of the scan. In particular, through-plane motion had a stronger impact than in-plane rotations. This can be explained base on the sequence design, the in-plane gradients (radial readout) are balanced, while the through-plane gradients are unbalanced (the FISP design is gradient spoiled). When the subject moves in and out of the plane, the RF pulse excites a slightly different batch of spins and the gradient momentum observed by the spins is no longer constant in time, which generates a signal evolution that matches best with a shorter T2 fingerprint (Fig.4a). This shows that motion-corrupted data are not automatically rejected by the dictionary matching process. However, for the short motion intervals studied here, we found that by removing the corrupted data points in a pre-processing step, we could restore T2 values to the correct range (Fig.4b). To automate the process, motion could be detected based on radial self-navigation [5].
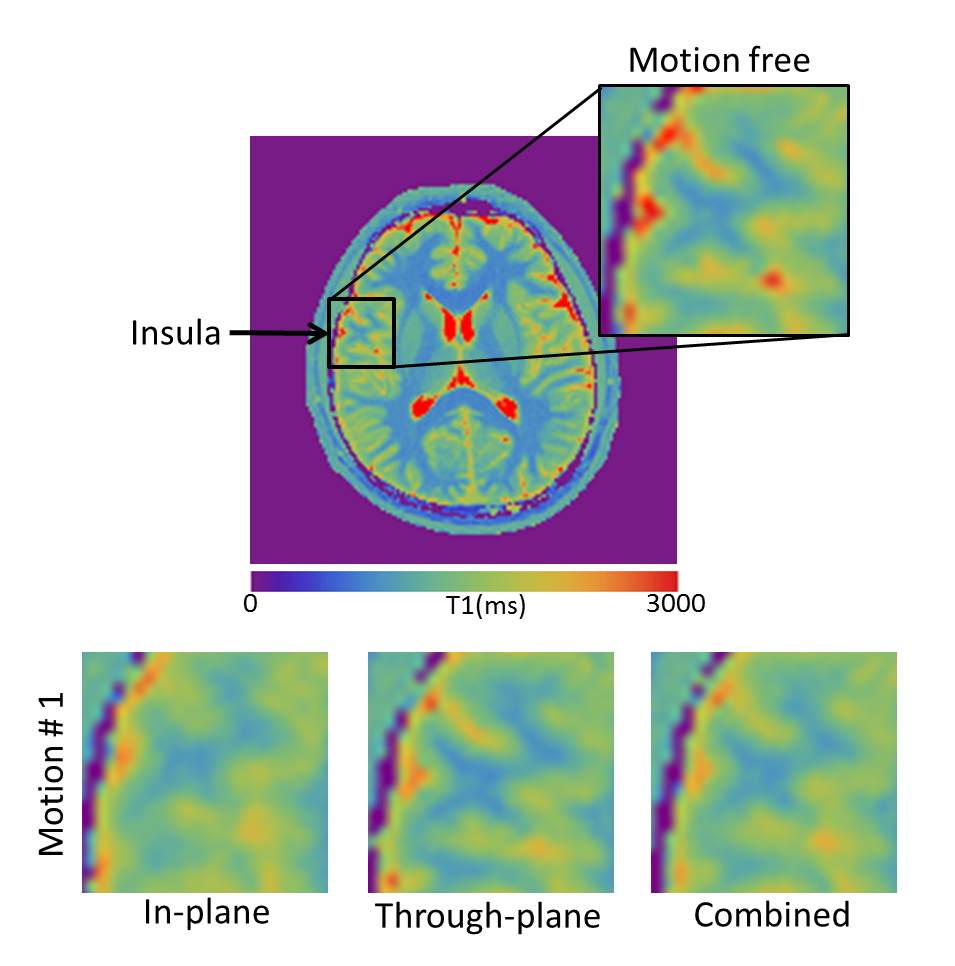
Although the ROI analysis showed that T1 values were not obviously affected by motion, some details in the T1-maps (such as the gray/white matter boundary in the insula in Fig. 5) showed evidence of blurring. Especially when the motion occurred in the first part of the scan, where T1 is most strongly encoded by the inversion pulse. Note that, we used a non-selective inversion pulse in our implementation. A selective inversion pulse could reduce the robustness.
Conclusion
Our experimental results show that the T1 values are least effected by motion, but T1 maps can be blurred if the motion occurs early in the scan. On the other hand, movement in the middle of the scan leads to a systematic underestimation in T2. We also showed that simply removing the corrupted time-points from the data before dictionary matching can restore the quantitative values. To further enhance the motion robustness of MRF it may be possible to incorporate the motion pattern into the dictionary, so that longer motion intervals could be tolerated, potentially deblurring the images and avoiding the need to reject data.Acknowledgements
This work was supported in part by NIH R21 EB020096 and NIH R01 AR070297 and was performed under the rubric of the Center for Advanced Imaging Innovation and Research (CAI2R, www.cai2r.net), a NIBIB Biomedical Technology Resource Center (NIH P41 EB017183).References
1. Ma, D., Gulani, V., Seiberlich, N., Liu, K., Sunshine, J. L., Duerk, J. L., & Griswold, M. A. (2013). Magnetic resonance fingerprinting. Nature, 495(7440), 187-192.
2. Jiang, Y., Ma, D., Seiberlich, N., Gulani, V., & Griswold, M. A. (2015). MR fingerprinting using fast imaging with steady state precession (FISP) with spiral readout. Magn Reson Med, 74(6), 1621-1631.
3. Weigel, M. (2014). Extended phase graphs: dephasing, RF pulses, and echoes - pure and simple. J. Magn. Reson. Imaging 41, 266–295.
4. Cloos, M. A., Knoll, F., Zhao, T., Block, K. T., Bruno, M., Wiggins, G. C., & Sodickson, D. K. (2016). Multiparametric imaging with heterogeneous radiofrequency fields. Nature Communications, 7.
5. Feng L., Axel L., Chandarana H., Block K. T., Sodickson D. K. & Otazo R. (2016). XD-GRASP: Golden-angle radial MRI with reconstruction of extra motion-state dimensions using compressed sensing (2016). Magn Reson Med, 75(2): 775-788.
Figures