3928
More than meets the eye: Quantitative evaluation of prospective motion correction at 7T1BMMR, Otto-von-Guericke-University, Magdeburg, Germany, 2German Center for Neurodegenerative Disease, Magdeburg, Germany, 3Center for Behavioral Brain Sciences, Magdeburg, Germany, 4Leibniz Institute for Neurobiology, Magdeburg, Germany
Synopsis
Prospective motion correction inherently does not provide uncorrected images. Thus, for image assessment usually motion corrected and uncorrected data from two different scans – therefore with different motion patterns – are qualitatively compared. In this study, prospectively corrected data from a highly trained cohort is retrospectively decorrected to enable a quantitative assessment with image-based and segmentation-based metrics. The results indicate that for the observed small-scale, involuntary subject motion quantitative rather than qualitative assessment is necessary to estimate the image degradation.
Introduction
At high magnetic field strengths, increased signal-to-noise ratios (SNR) enable high resolution MRI1, resulting in smaller voxel size and prolonged scans, thus, even involuntary subject motion can introduce image degradation – the so called biological resolution limit2. This barrier can be overcome by prospective motion correction (PMC)2,3. Since PMC inherently is not producing an uncorrected data set (only corrected images available) and subject motion varies from scan to scan, quantitative evaluation of PMC is challenging. In this study, we used a motion decorrection algorithm4 to undo PMC retrospectively and assess quantitatively the effect involuntary, small-scale subject motion has on high resolution imaging.Methods
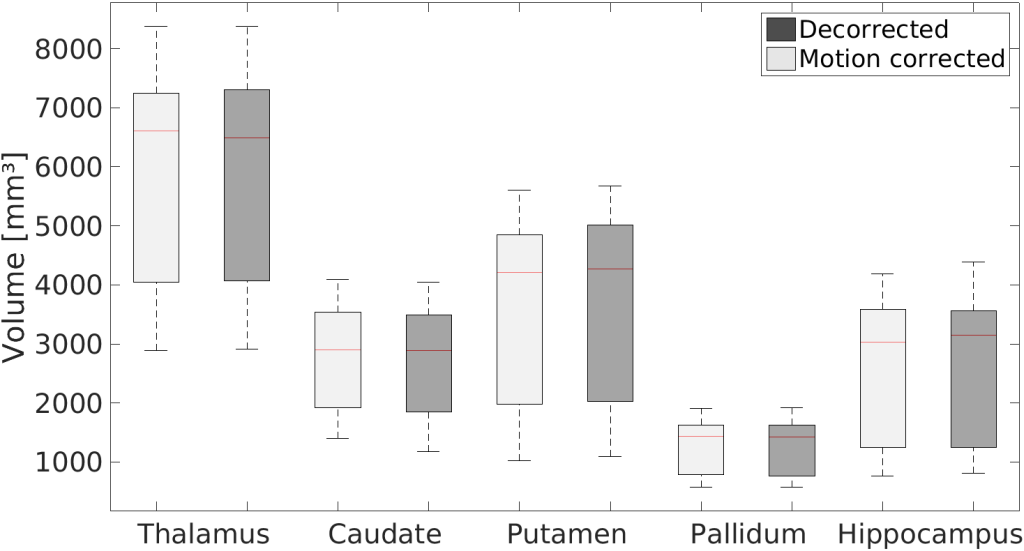
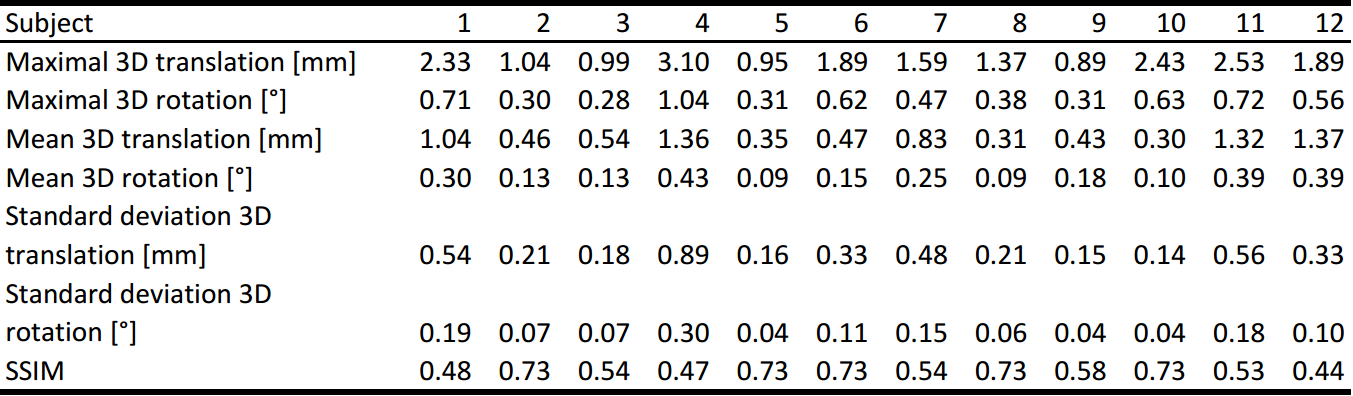
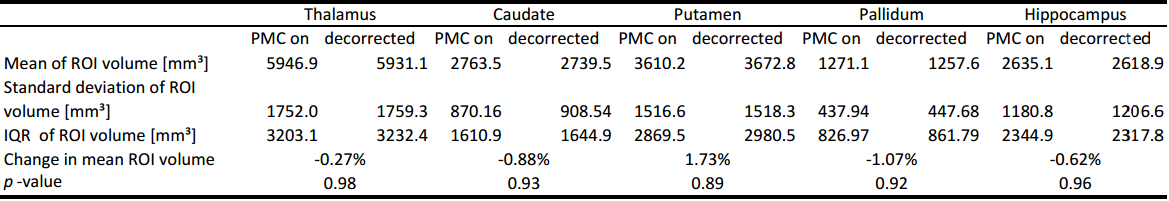
Twelve healthy and highly experienced subjects (6 females, after written consent) were scanned with a 32-channel head coil (Nova Medical, Wilmington, USA) at 7T (Siemens, Erlangen, Germany) and instructed to remain still. A 3D MPRAGE sequence with PMC (correction per k-space line) was set up as follows: 224x224x156.8mm FOV (sagittal orientation); 0.7mm isotropic voxel size; TR/TI/TE= 2500/1050/3.06ms; 5 degrees flip angle; 130 Hz per pixel bandwidth; TR-FOCI inversion recovery pulse5; 7/8 phase partial Fourier, 11:40 scan duration. To decorrect the images, the algorithm by Zahneisen et al.4 was applied and the resulting sum-of-square combined images were analyzed as following: motion quantification per subject; structural similarity index (SSIM)6 to assess differences between PMC and decorrected images per subject; calculation of average edge strength (AES)7 for PMC and decorrected images; computation of the bilateral volume for the thalamus, caudate, putamen, pallidum, and hippocampus with corrected and decorrected data. Statistical significance was evaluated using two sample t-tests. FSL FIRST was used for the regions-of-interest (ROI) segmentation and MATLAB 2015b was used for motion decorrection as well as data analysis.Results
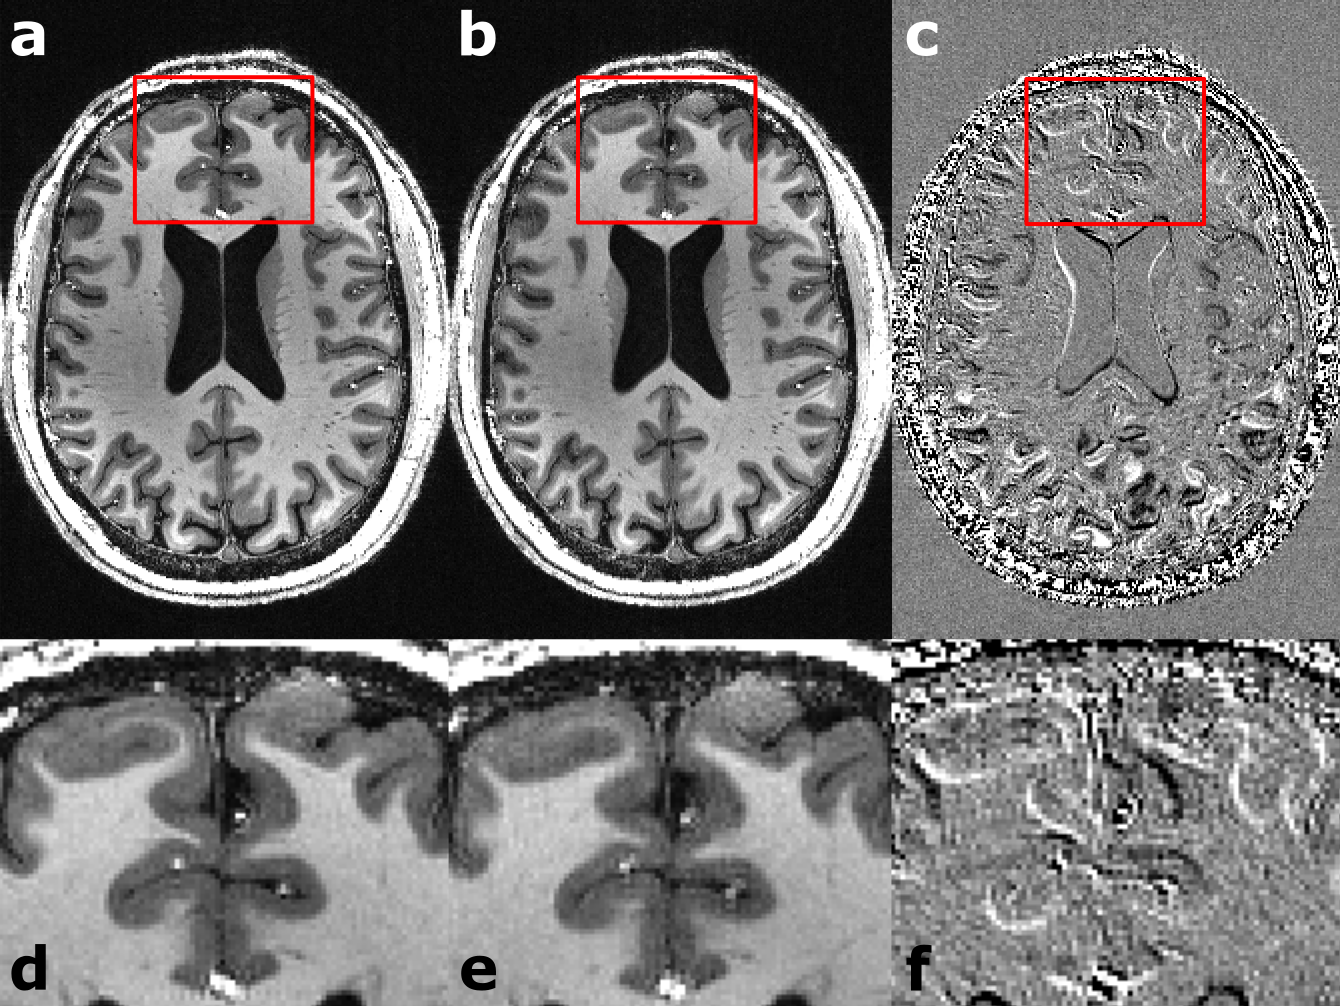
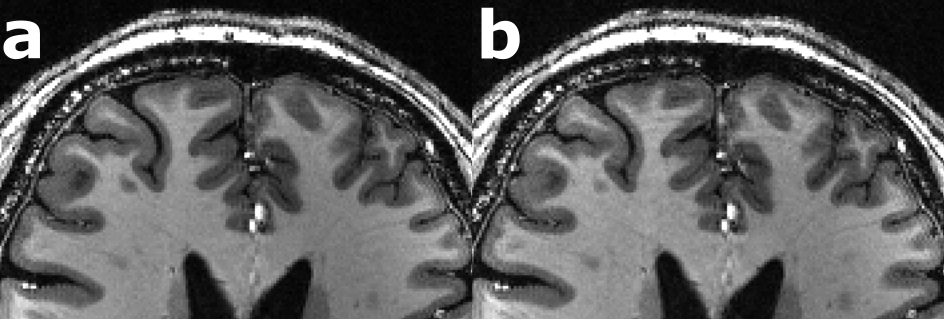
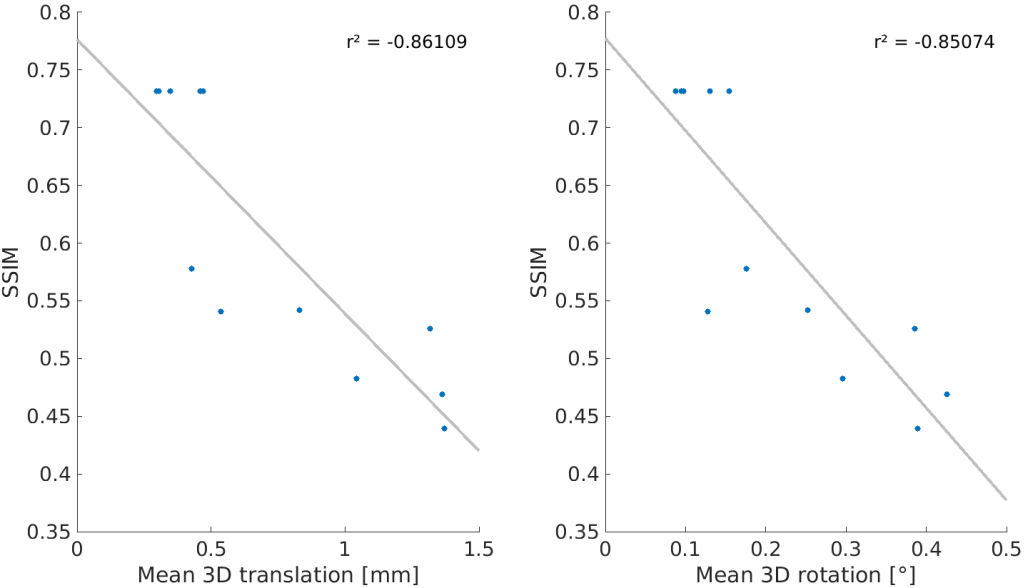
For each subject the motion is quantified in Tab. 1. Overall, the observed motion in this experienced cohort was small. The mean 3D translation was always smaller than two times the voxel edge length (0.7mm). Exemplary, corrected and decorrected images are compared in Fig. 1 and 2, showing subtle differences: blurring of the gray-white matter boundary (Fig. 1) and ringing like motion artifacts (Fig. 2). The SSIM between PMC on and decorrected images is also listed in Tab. 1. Fig. 3. shows that the mean 3D translation and rotation correlate highly with SSIM. The group-wise AES decreased non-significantly from 26015 a.u. for corrected to 25567 a.u. for decorrected images (p = 0.89). The ROI segmentation results in Tab. 2 and Fig. 4 show non-significant differences between corrected and decorrected data. Decorrecting motion tends to increase the interquartile-range (IQR) and the standard deviation while decreasing the mean of the segmented ROI volume.Discussions
In this study, prospectively motion corrected images (ground truth) were compared to their retrospectively decorrected counterpart. Decorrection– therefore reintroducing subject motion – decreased the image sharpness (AES analysis), altered the voxel intensity as well as head orientation in correlation with the observed mean subject motion (SSIM comparison), and changed the segmentation outcome (FSL FIRST). Even though the presented differences for all quantitative metrics were non-significant, corrected and decorrected images are qualitatively almost indistinguishable (see Fig. 1), because the highly experienced cohort moved little (e.g. some subjects moved on average less than the voxel edge length). Hence, a fully qualitative reader rating would fail to assess image degradation due to motion in this study. Predictably, less experienced cohorts will move more or higher resolutions will be more susceptible to motion, thus, qualitative and quantitative analysis will show greater differences. Presumably, blurring due to decorrected motion increased the uncertainty of segmentation algorithms. Furthermore, in longitudinal studies changes of volumetric biomarkers8-10 could originate from pathologies or – if not corrected – involuntary motion. As shown in this study, pure qualitative image assessment is not reliable to detect image degradation caused by small-scale, involuntary motion. Thus, motion correction could provide higher segmentation reproducibility besides high effective resolution as well as improved image quality, and decorrection is a valuable tool to verify the effect of PMC. In this study, no image post-processing (e.g. bias field correction) was performed prior to the analysis to prevent image alteration not related to subject motion. In the future, further ROIs, different segmentation algorithms (e.g. Free Surfer) and additional metrics should be investigated. Ultimately an automated, quantitative image assessment could verify the value of PMC in a larger study without acquiring an additional, uncorrected scan (use decorrection instead).Acknowledgements
We would like to thank Benjamin Zahneisen and Thomas Ernst for providing the decorrection algorithm. This work was supported by the NIH, grant number 1R01-DA021146, and by the Initial Training Network, HiMR, funded by the FP7 Marie Curie Actions of the European Commission, grant number FP7-PEOPLE-2012-ITN-316716.References
1. Ladd ME. High-field-strength magnetic resonance: potential and limits. Topics in magnetic resonance imaging TMRI. 2007;18(2):139–152.
2. Stucht D, Danishad KA, Schulze P, Godenschweger F, Zaitsev M, Speck O. Highest Resolution In Vivo Human Brain MRI Using Prospective Motion Correction. PloS one. 2015;10(7):e0133921.
3. Maclaren J, Armstrong, Brian S R, Barrows RT et al. Measurement and correction of microscopic head motion during magnetic resonance imaging of the brain. PloS one. 2012;7(11):e48088.
4. Zahneisen B, Keating B, Singh A, Herbst M, and Ernst T. Reverse retrospective motion correction. Magnetic resonance in medicine. 2015;75(6):2341-2349.
5. Hurley AC, Al-Radaideh A, Bai L, Aickelin U, Coxon R, Glover P, and Gowland PA. Tailored RF pulse for magnetization inversion at ultrahigh field. Magnetic resonance in medicine, 2010;63(1):51-58.
6. Wang Z, Bovik AC, Sheikh HR, and Simoncelli EP. Image quality assessment: from error visibility to structural similarity. IEEE transactions on image processing. 2004:13(4):600-612.
7. Aksoy M, Forman C, Straka M, Çukur T, Hornegger J, Bammer R. Hybrid prospective and retrospective head motion correction to mitigate cross-calibration errors. Magnetic resonance in medicine. 2012;67(5):1237-1251.
8. Brouwer RM, Mandl RC, Schnack HG, van Soelen IL, van Baal GC, Peper JS, Kahn RS, Boomsma DI, and Pol HH. White matter development in early puberty: a longitudinal volumetric and diffusion tensor imaging twin study. PLoS one. 2012;7(4):e32316.
9. Whitford TJ, Grieve SM, Farrow TF, Gomes L, Brennan J, Harris AW, Gordon E, Williams LM. Volumetric white matter abnormalities in first-episode schizophrenia: a longitudinal, tensor-based morphometry study. American Journal of Psychiatry. 2007;164(7):1082-1089.
10. Lange N, Travers BG, Bigler ED, Prigge MB, Froehlich AL, Nielsen JA, Cariello AN, Zielinski BA, Anderson JS, Fletcher PT, Alexander AA, Lainhart JE. Longitudinal volumetric brain changes in autism spectrum disorder ages 6–35 years. Autism Research. 2015;8(1):82-93.
Figures