3922
Assessing changes in MRI measurands incurred in a scanner upgrade: Is my study comprised?1Physical Measurement Laboratory, National Insitute of Standards and Technology, Boulder, CO, United States, 2Bates College, Lewiston, ME, United States
Synopsis
Scanner upgrades due to software and hardware changes are an inevitable part of MR research and, without quality assurance protocols, can jeopardize studies. We used two standardized phantoms to evaluate change in T1 relaxation time and ADC measurements on a system that underwent an ‘everything but the magnet’ upgrade. Post-upgrade, the ADC measurements are comparable or better than the pre-upgrade measurements, while T1 measurements (VFA and IR) are affected by the upgrade. Upgrades can have unintended consequences, and we recommend the development of standardized quality assurance protocols that test not only contrast, but also quantitative measurements to identify variations and enable corrections.
Purpose
Scanner upgrades due to software and hardware changes are an inevitable part of MR research. For longitudinal work, upgrades can introduce measurement differences in the data from before and after the upgrade, jeopardizing complex and expensive studies. Without proper quality assurance protocols using standardized and traceable imaging phantoms, it would be difficult to determine if the upgrade has affected the data collection. To understand potential effects of a scanner upgrade, we use a suite of standardized phantoms to evaluate change in T1 relaxation time and apparent diffusion coefficient (ADC) measurements on a system that underwent an ‘everything but the magnet’ upgrade.Methods
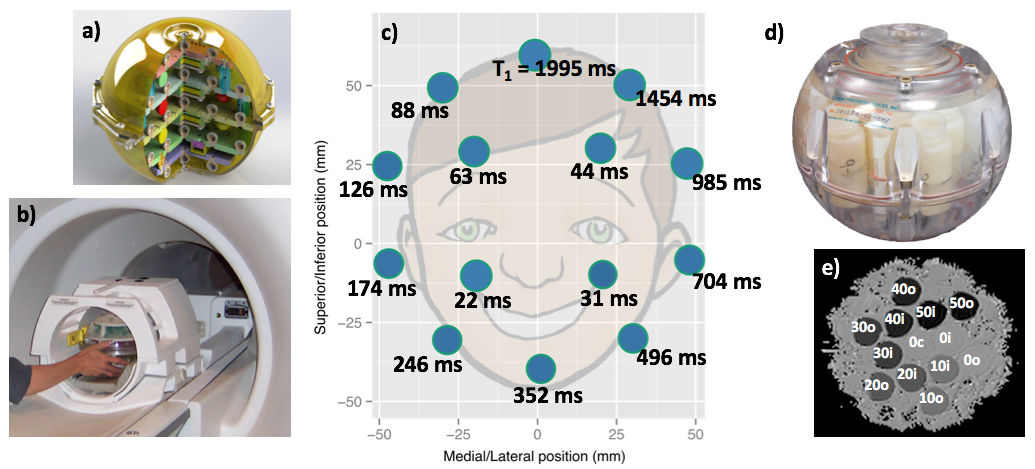
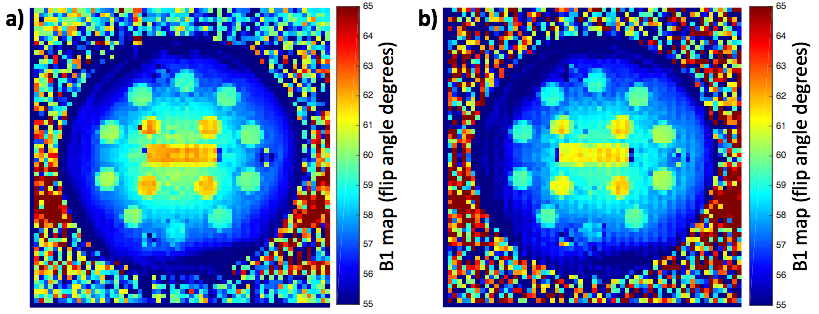
One ISMRM/NIST system phantom1,2 (Fig. 1a-c) and one QIBA/NCI/NIST diffusion phantom3 (Fig. 1d-e) were scanned on a 3 T MRI scanner over three consecutive days before and after the system was upgraded. The hardware and software components were upgraded, leaving only the superconducting magnet unchanged. T1 relaxation times were measured for each of the 14 T1 samples in the system phantom using both variable flip angle (VFA) and inversion recovery (IR). Temperature of the bulk water in the system phantom was measured before and after scanning. Details regarding the system phantom and T1 data acquisition protocol are available online: https://collaborate.nist.gov/mriphantoms/bin/view/MriPhantoms/RecommendedImagingProtocols. B1 maps were collected on the upgraded system using the method of Wang et al. for a prescribed flip angle of 60 degrees.4 Using four pixels from the center of each contrast sphere, we calculated the coefficient of variation (CV) to compare results from the head and body coils. The Apparent Diffusion Coefficient (ADC) was measured using the diffusion phantom, temperature-stabilized with an ice water bath, imaged in the coronal, axial and sagittal planes. ADC was measured using DW EPI with b-values 0, 500, 900, 2000 x10-6 s/mm2. Averages and standard deviations of the T1 and ADC measurement are reported. Spin-echo ADC MRI values measured on the NIST 1.5 T MRI system using b-values 0, 200, 600, 1000, 1450, 1900 x10-6 s/mm2 at 0 °C are reported. T1 and ADC data were analyzed by three of the authors on custom software (Phantom Viewer, developed at NIST).Results
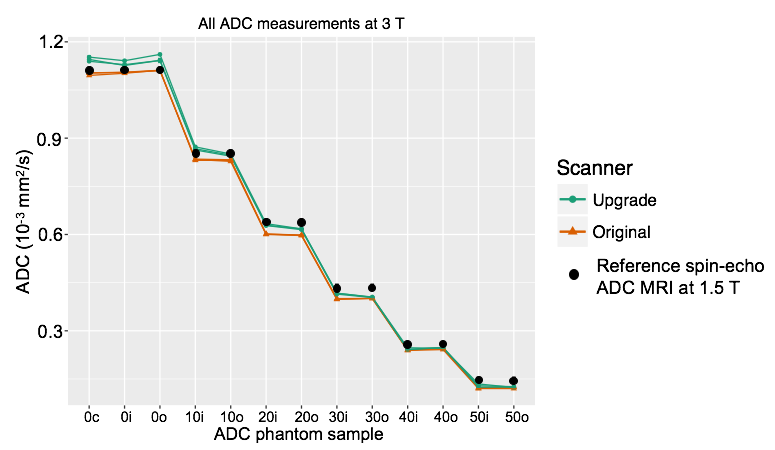
At each system phantom scan session, temperature increased by 0.7 °C on average before upgrade (start 20.7 °C, end 21.4 °C) and 0.3 °C on average after upgrade (start 20.7 °C, end 21.0 °C). Following upgrade, VFA overestimates the T1 compared to pre-upgrade (Fig. 2). T1 measurement by IR has greatly increased variation compared to pre-upgrade and may show some spatial dependence (Fig. 2). To assess the origin of the errors, we repeated the measurements using the body coil for receive rather than the provided head coil. Especially for the IR method, the body coil receive results are much closer to the expected NMR measured values (Fig. 3). The head coil receive B1 map (CV = 0.035) has more variation within contrast spheres than the body coil receive B1 map (CV = 3.5 x 10⁻⁵) (Fig. 4). The body coil receive B1 map does have an asymmetric B1 profile. All measurements, T1 and ADC, pre- and post-upgrade show excellent repeatability over three days (Figs. 2,5). ADC measurements post-upgrade are comparable to pre-upgrade at low polyvinylpyrrolidone (PVP) concentrations (Fig. 5). At high PVP concentrations, post-upgrade ADC measurements improve (are closer to the spin-echo ADC MRI value measured using b-values 0, 200, 600, 1000, 1450, 1900 x10-6 s/mm2 at 0 °C) (Fig. 5).Discussion
We demonstrate that upgrades can have unintended consequences. In this case, the focus of the upgrade was improved anisotropic diffusion measurements, not improved T1 relaxation time measurement. Post-upgrade, the ADC measurements are comparable or better than the pre-upgrade measurements. T1 measurement by VFA and IR methods are altered after the upgrade. It is possible the head coil receive is at fault: initial testing using the body coil to receive shows marked improvement in IR measurement. Also, the body coil receive B1 map is more homogeneous than the head coil receive B1 map. Additional testing is underway, including repeatability testing on the body coil and comparison of head coils.Conclusion
We recommend the development of standardized quality assurance protocols that test not only contrast, but also quantitative measurements to identify variations resulting from changes in hardware and software that occur as a consequence of scanner upgrades.Acknowledgements
We thank High Precision Devices for the photos of the system and diffusion phantoms in Figure 1. We thank the staff at the undisclosed imaging center.References
1. Russek SE, Boss MA, Jackson EF, et al. Characterization of NIST/ISMRM MRI System Phantom. Proceedings of the 20th meeting of the ISMRM, Melbourne, Australia, 2012.
2. Keenan KE, Stupic KF, Boss MA, et al. Multi-site, multi-vendor comparison of T1 measurement using ISMRM/NIST system phantom. Proceedings of the 24th meeting of the ISMRM, Singapore, 2016. #3290.
3. Boss MA et al. Multicenter Study of Reproducibility of Wide Range of ADC at 0 °C. RSNA 2015 Annual Meeting, SSE23-05.
4. Wang J, Qiu M, Constable RT. In Vivo Method for Correcting Transmit/Receive Nonuniformities with Phased Array Coils. MRM 2005; 53:666-674.
Figures