3919
Computer Analysis of Linear-Array Resolution Insert1NIST, Boulder, CO, United States, 2University of Colorado, Boulder, CO, United States
Synopsis
Linear-array resolution inserts are considered for evaluations of MRI scanner performance in terms of spatial accuracy. The linear design allows for simple computer analysis of MR images, which can be used for a quick and quantitative comparison of MRI systems.
Purpose
Spatial resolution is an important parameter in MRI, which can determine if small features are observed or overlooked by radiologists. High contrast spatial resolution tests can provide a method to quantitatively evaluate the performance of MRI machines. Analysis of MR images of resolution inserts can demonstrate how accurately a given scanner reports spacing, sizing and angular relations. Both the American College of Radiology (ACR) and ISMRM/NIST system phantoms include the ACR high contrast spatial resolution insert to test the resolution limits of the MRI system. Current ACR guidance states “one visually determines the number of individual small bright spots”1. Rather than relying on the human eye, we propose using line scans and the modulation transfer function (MTF) to quantitatively assess resolution, beginning with linear-array resolution inserts.Methods
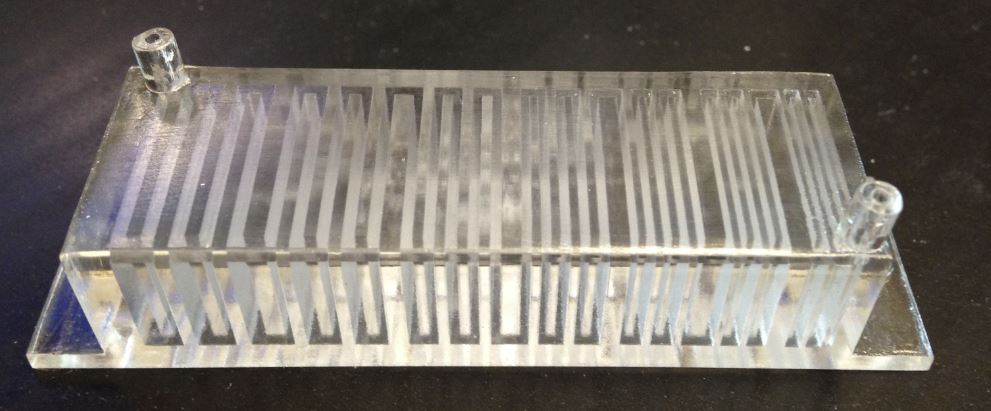
The proposed resolution insert is an adaption of the ACR model, which is a square pattern of circles rotated at different angles. The modified linear-array version involves a set of straight parallel troughs of varying thickness with widths ranging from 0.4 mm to 1.0 mm. To achieve the precision required for such small and delicate internal structures, the insert was printed through high-precision Stereolithography.
The internal voids were then filled with a 3.2 mM copper sulfate (CuSO4) solution to create a high-contrast image. To reduce the prevalence of bubbles in the internal chamber, a vacuum system was used to draw fluid into the insert. This process was not completely successful as there are a number of bubbles present. However, it did prove to be our most promising method and could result in minimal air pocket formation with some minor modifications to the insert design.
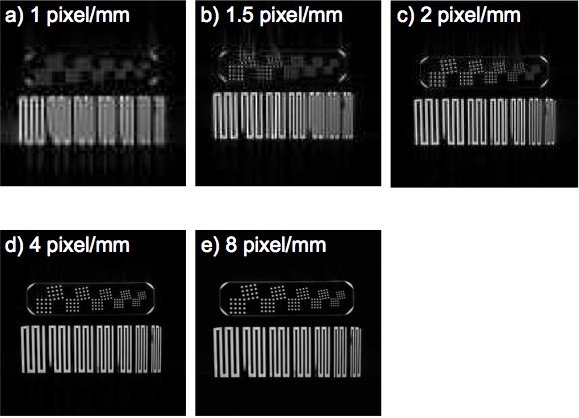
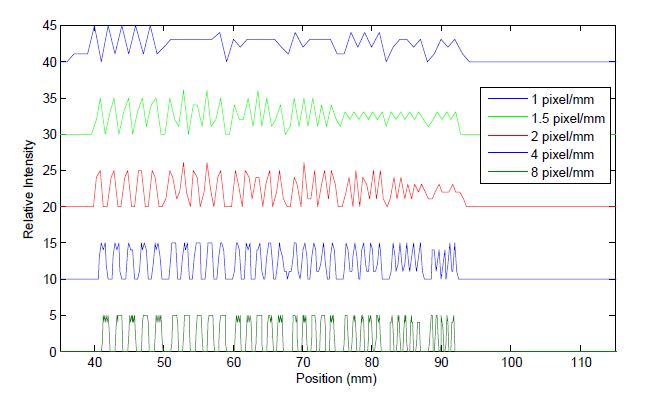
A spin echo scan was then done on both the line-array and the ACR insert in a 3 T small-bore MRI system at resolutions of 1.0, 1.5, 2.0, 4.0 and 8.0 pixels/mm and time settings of TR=500ms and TE=34.7ms. We performed a single line scan of each image to compare the intensity patterns of the linear-array insert at different image resolutions.
Results
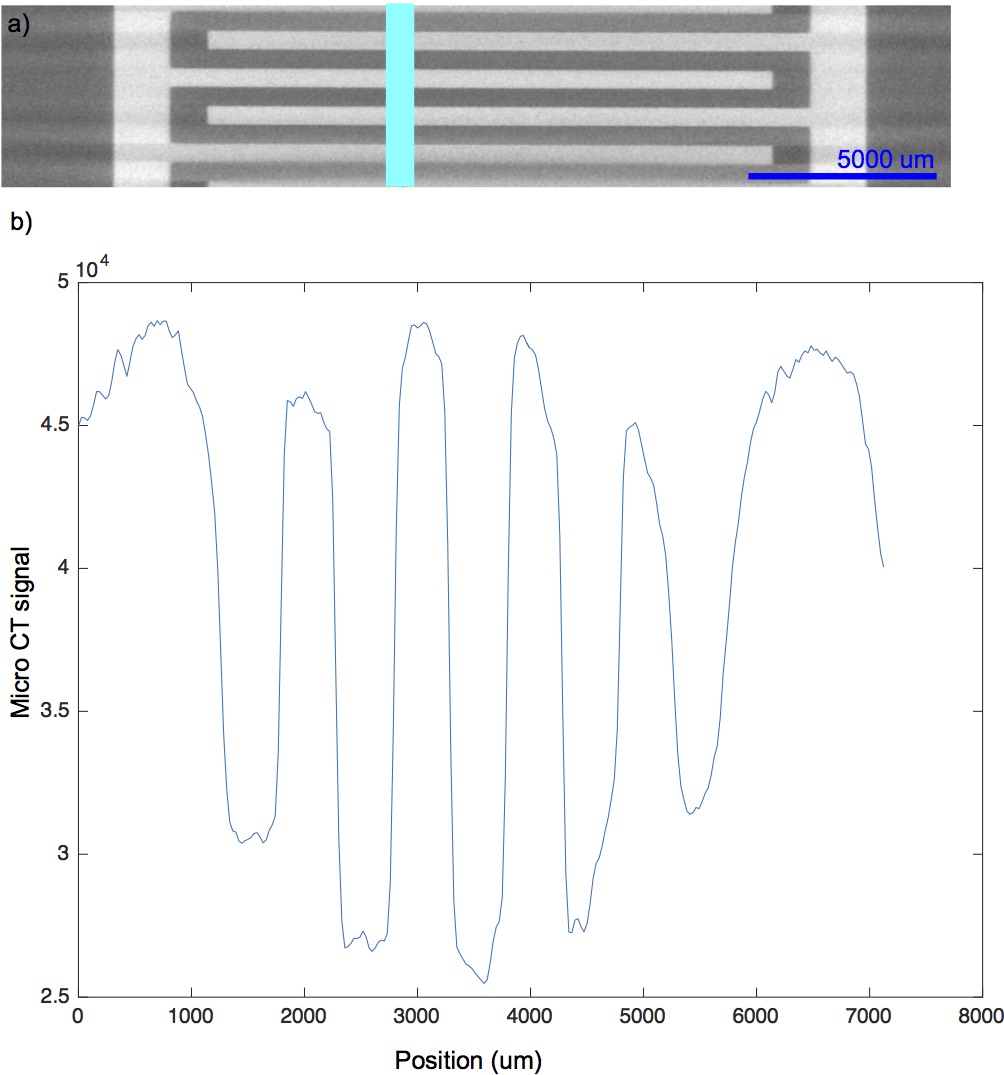
The 3D printed linear-array resolution insert has +/- 0.003 print accuracy, as reported by the manufacturer. A microCT scan (Figure 1) of the insert was done to verify that the line pattern spacing matched expected values. On the line set designed to have a width of 0.5 mm, the scan reported a 0.489 mm spacing average, which is outside the tolerance range, indicating that the insert itself was not printed to acceptable standards. This would impact final measurements of image spacing and should be accounted for when determining MRI accuracy.
Both the ACR and linear-array resolution inserts perform as high-contrast spatial resolution inserts for MR imaging (Figure 2). Line scans through the center of the linear-array inserts (Figure 3) demonstrate relative variations in intensity at different resolutions, offset to improve readability.
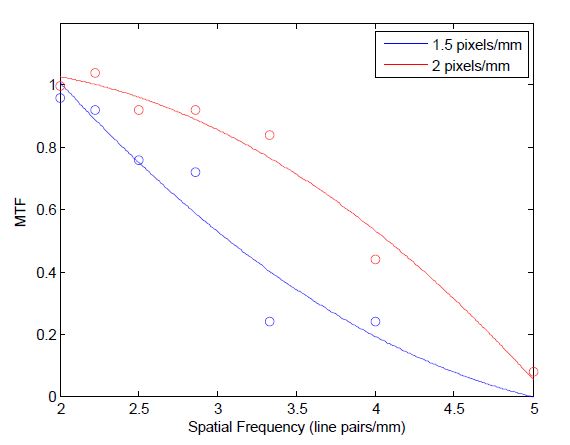
A 50% modulation transfer function (MTF) analysis2 was performed on the 1.5 and 2 pixel/mm resolution line scan (Figure 4). The approximate resolutions derived at 50% MFT were 3.08 and 4.10 lines/mm for the respective line scans.
Discussion
At the highest resolution (8 pixels/mm) the width of the lines in the pattern becomes apparent and can be measured with accuracy. At lower resolutions (<2 pixels/mm), there were not sufficient pixels across the width of each line to measure distance, and the resulting MTF analysis had to take noise modulations in to consideration.
The insert design was modified and printed (Figure 5), but not implemented for these tests. Improvements included creating a single fill path and extruded fill ports in order to aid in filling and reduce bubble formation. The linear-array insert design is still limited in that it cannot measure angular accuracy. We are in the process of developing and testing a similarly simple circular patterned insert which could accomplish angular analysis.
Conclusion
The linear nature of this design allows for a simple line scan of images, yielding clear and definitive data on the spacing between troughs. We are able to automate analysis of the spatial resolution, using the modulation transfer function (MTF). The linear-array and circular inserts combined with automated analysis will enable simple, comparable tests of MRI scanner and sequence resolution.Acknowledgements
The authors wish to thank the Summer Undergraduate Research Fellowship program (SURF) at NIST.References
1. Price, R., et al., (2015). Magnetic Resonance Imaging: Quality Control Manual.
2. M. C. Steckner, D. J. Drost and F. S. Prato, Med Phys 21 (3), 483-489 (1994).
Figures