3913
Application of Magnetic Resonance Fingerprinting to evaluate degradation of Magnetic Resonance Imaging systemImam Ahmed Shaik1, Rajeshree Malage1, and Sairam Geethanath1
1Medical Imaging Research Centre (MIRC), Dayanada Sagar Institutions, Bangalore, India
Synopsis
Detection of artefact and its automated correction is an active area of MRI research. The aim of this study is to evaluate MR system/sub-system degradation and detection of root cause for image quality degradation using Magnetic Resonance Fingerprinting (MRF). The method is demonstrated on Terranova, an earth’s field MR imager as part of the preliminary studies. The 3 major coils: polarizer, gradient and Audio Frequency (AF) coils were considered for degradation evaluation. A dictionary similar to MRF with 64 entries for different ranges of inputs was generated. It is shown that based on dictionary a decision can be made about the status of the system.
Introduction
Reliability on the quality of image depends on
system performance and noticed eventually through artefacts in most cases1.
These artefacts may affect clinical decision making. Artefacts could be
typically due to system imperfections or subject-caused. Multiple techniques
have been developed to analyse system performance for image quality 2, 3.
Most of these methods employ image processing (phantom-based) or signalling
techniques to perform Quality Analysis (QA) 2, 3. Detection of
artefact and its automated correction is an active area of MRI research.
However, the cause of artefact/image quality degradation through these methods
is challenging. The aim of this study is to evaluate MR system/sub-system
degradation and detection of root cause for image quality degradation using
Magnetic Resonance Fingerprinting (MRF) 4. The overall goal of this
work is to supplement MR engineers and reduce down-time of the
scanners. The technique is demonstrated
on Terranova, an earth’s field MR imager (Magritek
Inc., Germany) as part of the preliminary studies. Methods
In this study, the 3 major coils: polarizer, gradient and Audio Frequency (AF) were considered for degradation evaluation. Polarization current, gradient duration and AF pulse duration of the Pulsed Gradient Spin Echo (PGSE) sequence shown in figure 1(a) were used as variable inputs and the ratio of spectrum amplitude to line width were measured as the response. PGSE sequence was chosen due to its ability to modulate the 3 coils. A dictionary similar to MRF with 64 entries for different ranges of inputs was generated. The combinations of input ranges are shown in figure 1(b). These ranges correspond to normal, degrading and abnormal conditions of the sub-systems. Currents to the coils were turned off in order to mimic system failure and hence were considered as zero input during dictionary generation for abnormal conditions. Dimensionality reduction was performed by using PCA (Principal Component Analysis). Three centroid points normal, degrading and abnormal were found using k-means clustering from dictionary data. The corresponding flow chart is shown in figure 2. Acquisition parameters along with amplitude to linewidth ratio were employed to evaluate the Euclidian distance of the current data point with the centroids. The status of the system (normal, degrading or failure mode) was decided based on the Euclidean distance of the current data point and the centroid. A User Interface was designed to repeatedly check the performance of the system as shown in Figure 3. This UI was built for PGSE sequence and employed to evaluate all the three coils in one scan. For the abnormal cases reported, the system current or the duration of pulse was deliberately turned off/minimized.Results
Figure 4(a-c) shows the output of k-means
clustering for the three coils. It can be observed that each of these coils
have three different centroids and hence can be evaluated independently as
well. The PGSE sequence can therefore be tailored to focus on one or more
subsystems and run as a QA sequence. Table 1 shows the test cases performed for
different coil conditions using PGSE sequence. Different combinations of inputs
were provided so that all three cases could be tested. As an example, for input
values of 4, 1.1 and 1 corresponding to Polarization Current, B1 pulse duration
and gradient pulse duration respectively. In this case, system was in the
abnormal state as amplitude to line width was significantly smaller than was
expected. Similarly, the experiment was repeated for different combinations of
inputs and the results obtained are given in Table 1. It can be noted that the
metric has a gradual decrease rather than an abrupt change and hence system
degradation could be targeted. This is
relevant as most issues are noted when subsystems move to the abnormal state.
Conclusion & Discussion
A system degradation evaluation method based on MRF was demonstrated for the first time. The results on the simple Terranova architecture validate the approach. This approach combines the image processing and input signalling approaches typically used to determine system performance or diagnose system failure. This method could be expanded and can be applied to multiple other subsystems as well. Future work involves design of one sequence using MRF which will evaluate major components of MRI. It could also be trained to suggest root cause of the system degradation/failure incorporating dictionary learning techniques. In future, this work will be extended to sophisticated clinical scanners for system/subsystem degradation evaluation.Acknowledgements
This work was supported by Department of Science and Technology (DST). DST/TSG/NTS/2013/100 and Vision Group on Science and Technology (VGST), Govt. of Karnataka, Karnataka Fund for strengthening infrastructure (K-FIST), GRD#333/2015. We would like acknowledge Mr.Ravi Bharadwaj from Wipro GE Healthcare Bangalore India, for his valuable inputs on industrial relevance of this project.References
[1]. American Association of Physicists in Medicine. Acceptance Testing and Quality Assurance Procedures for Magnetic Resonance Imaging [AAPM]: Facilities Report of MR Subcommittee Task Group I; December2010 [2]. Ihalainen T, Sipila O, Savolainen S. MRI quality control: six imagers studied using eleven unified image quality parameters. Eur Radiol. 2004;14(10):1859–1865. [PubMed] [3]. Mascaro L, Strocchi S, Colombo P, Del Corona M, Baldassarri AM. Definition criteria for a magnetic resonance quality assurance program: multicenter study. Radiol Med (Torino) 1999;97(5):389–397. [PubMed] [4]. Dan Ma, Vikas Gulani, Nicole Seiberlich, Kecheng Liu, Jeffrey L. Sunshine, Jeffrey L. Duerk & Mark A. Griswold. Magnetic resonance fingerprinting.Doi:10.1038/nature11971.Figures
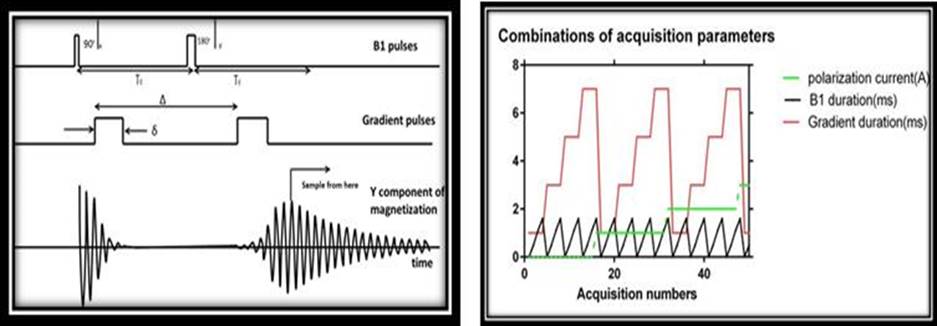
Figure 1 (a) PGSE Experiment, (b)
combination of acquisition parameters
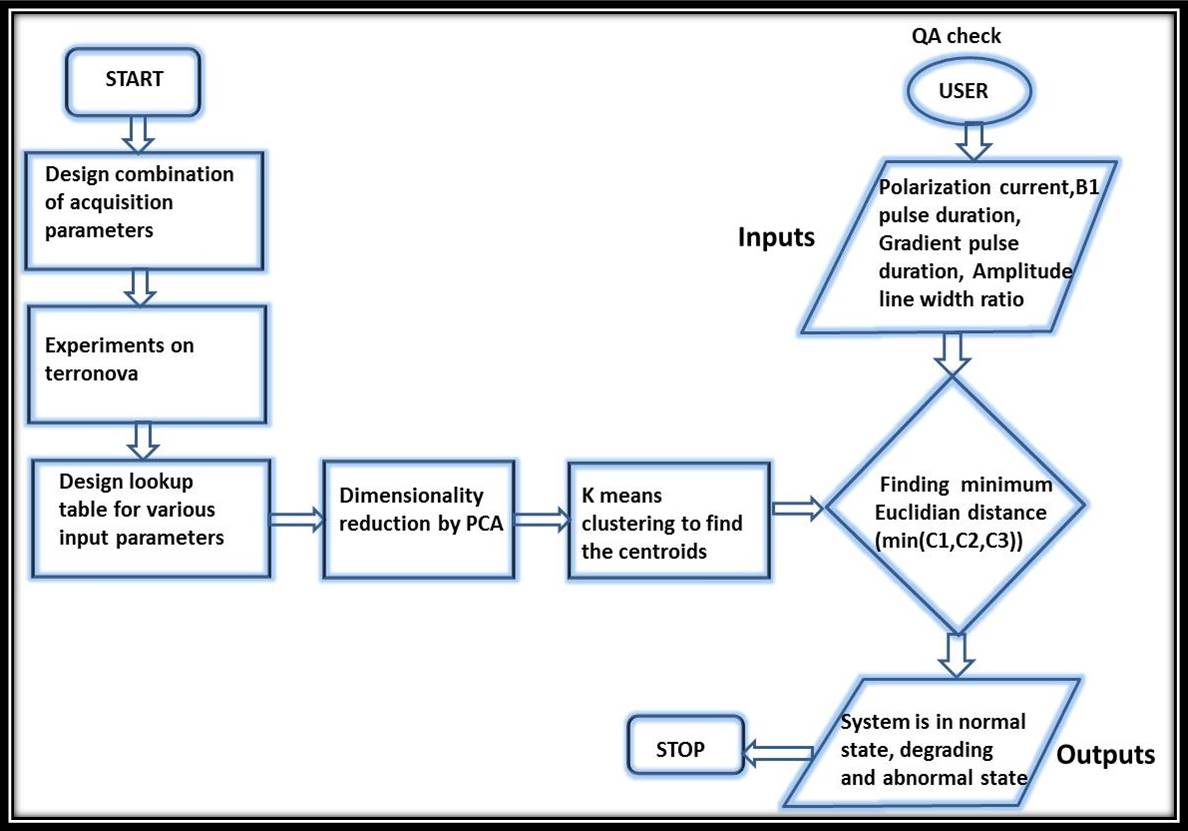
Figure 2. Flow chart to
evaluate the system performance includes the steps involved in determining the
status of the MR system
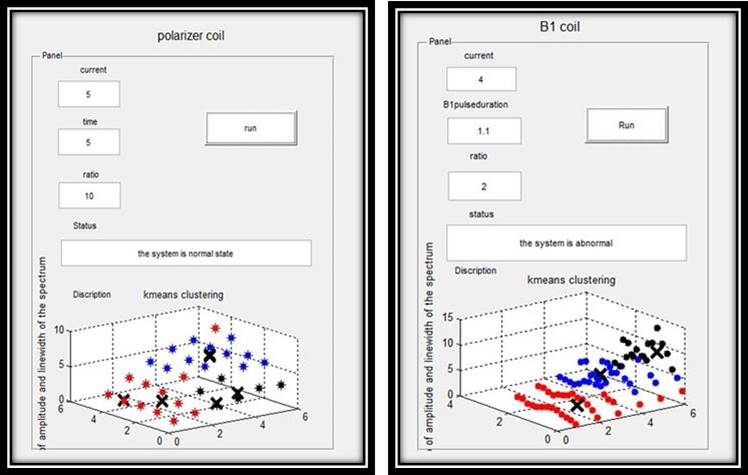
Figure 3. Predicting the status of the EFNMR system depending on
the range of input the status of the MR system can be determined normal,
degrading or abnormal
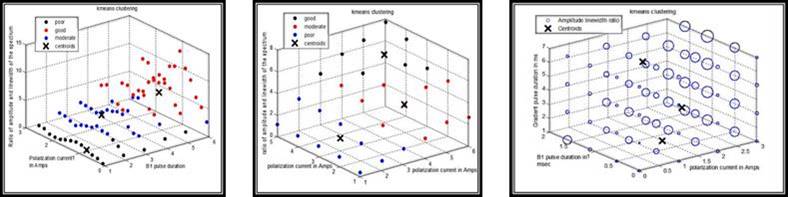
Figure 4. K means
clustering results for (a).B1 coil, (b). Polarizer coil and (c).Gradient coil

Table 1.Test case results for variable inputs of Polarization
current, B1 pulse duration, Gradient pulse duration and system performance is
determined