3908
Robust B1 Mapping with Phase-sensitive Orthogonal Excitation RF Pulses1Radiology, Washington University in St. Louis, St. Louis, MO, United States
Synopsis
Accurate B1 measurement is important in many MR related applications. In this study, we proposed and optimized a phase-sensitive approach for B1 mapping that relies on a multi-gradient-echo sequence with two successive orthogonal RF pulses used for signal excitation. We also proposed optimized methods for combining multi-channel data, allowing for optimal parameters’ estimation. The method was validated on phantoms and tested on human participants. By applying this method on SMART (Simultaneous Multi-Angular Relaxometry of Tissue) MRI, we reaffirmed the importance of the B1 correction for quantifying biological tissues relaxation and magnetization transfer parameters.
Purpose
To introduce a phase-based B1 mapping method that can be used to get fast, accurate B1 mapping using multi-channel phased-array coil.Methods
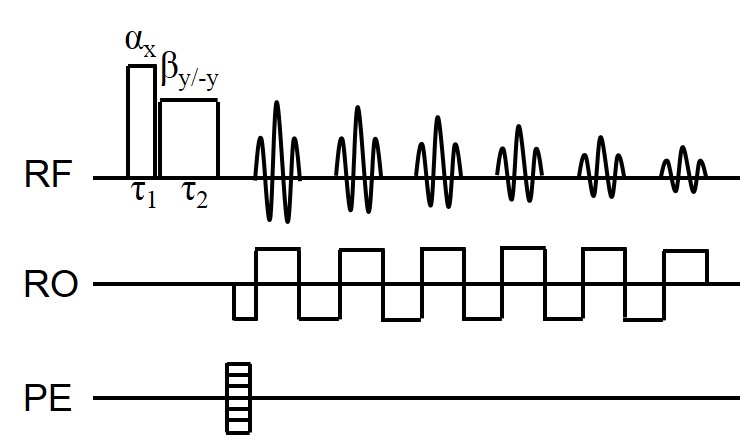
A modified 3D multi-gradient-echo sequence was used as depicted in Fig.1. Two scans were collected, one with $$$(\alpha,\beta)$$$ and the other with $$$(\alpha,-\beta)$$$ RF pulses. For the specific case $$$\alpha=\beta$$$, $$$\tau_{\alpha}=\tau_{\beta}$$$, the quantity $$$\Delta\phi$$$ corresponding to the difference of the phases for two pairs of the RF pulses $$$(\alpha,\alpha)$$$ and $$$(\alpha,-\alpha)$$$ can be calculated by solving the Bloch equations
$$\Delta\phi=arctan[\frac{2\Omega^{2}(p^{2}+\alpha^{2}cos\Omega)}{\alpha^{2}(1-cos\Omega)(\alpha^{2}+(p^{2}+\Omega^{2})cos\Omega)}]$$
where $$$p=\Delta\omega\cdot\tau$$$ is the product of frequency shift $$$(\Delta\omega)$$$ and RF pulse duration $$$(\tau)$$$, $$$\Omega=(\alpha^{2}+p^{2})^{2}$$$. However, the phase of MR signal also depends on different instrumental factors and is specific for each channel n in a phased-array coil:
$$\phi_{meas,n}=\phi(\alpha,\beta)+\phi_{0,n}$$
where $$$\phi_{0,n}$$$ is the initial phase characteristic for each channel. To remove the phase $$$\phi_{0,n}$$$ and increases the signal-to-noise ratio (SNR) in the $$$\Delta\phi$$$ image, data from different channels and different scans were combined for each voxel according to:
$$\Delta\phi=arg[\frac{1}{M}\cdot\sum_{n=1}^N\sum_{m=1}^M\lambda_{m}\cdot{S_m^{(1)}}(TE_{n})\cdot{S_m^{(2)*}}(TE_{n})]$$
where the sum is over all channels (M) and all echoes (N). The superscripts (1) and (2) represent the first and second scans, respectively. Data from different channels were also combined for each voxel in a single data set $$$S(TE)$$$ as proposed previously1. Frequency $$$(\Delta\omega)$$$ map was calculated by fitting the signal phase to a linear function of echo time. The measured flip angles were calculated by solving the first equation on the voxel-by-voxel basis.
The human studies were approved by local IRB and participants signed the consent form. All experiments were performed on a 3T SIEMENS scanner. Three scans were acquired on: 1) a small spherical phantom (radius=1.5cm) using a 15 channel knee coil and image resolution of $$$1\times1\times1mm^{3}$$$; 2) a large spherical phantom (radius=9cm) using the body coil of the scanner and image resolution of $$$2\times2\times2mm^{3}$$$; 3) a healthy volunteer using a 32 channel head coil and image resolution of $$$2\times2\times2mm^{3}$$$. In all scans, the body coil was used as a transmitter. We used $$$\alpha=\beta=90^{\circ}$$$, $$$\tau_{\alpha}=\tau_{\beta}=400\mu sec$$$, 6 echoes, $$$TE_{1}=2ms$$$, $$$\Delta TE=4ms$$$, and $$$TR=32ms$$$. By using GRAPPA2, each scan on the healthy volunteer required 1min 40sec. In human experiment we also used the fat-suppression RF pulse preceding the phase sensitive RF excitation pulses to minimize effects resulting from the presence of voxels with coexisting fat and water compartments. To demonstrate the B1 effect on R1 mapping, we also collected SMART (Simultaneous Multi-Angular Relaxometry of Tissue) MRI3 data with multiple flip angles of $$$5^{\circ}$$$, $$$10^{\circ}$$$, $$$20^{\circ}$$$, $$$40^{\circ}$$$ and $$$60^{\circ}$$$. By using a high resolution of $$$1\times1\times1mm^{3}$$$, TR=18ms and GRAPPA, the total acquisition time of the SMART sequence was 17min 30sec.
Results
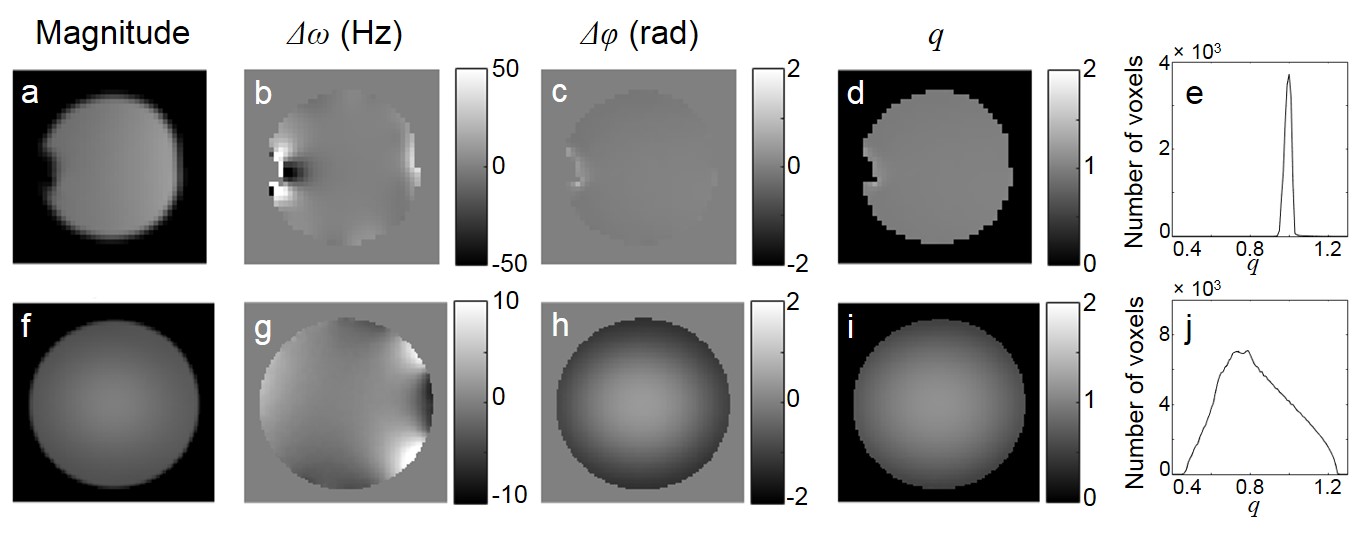
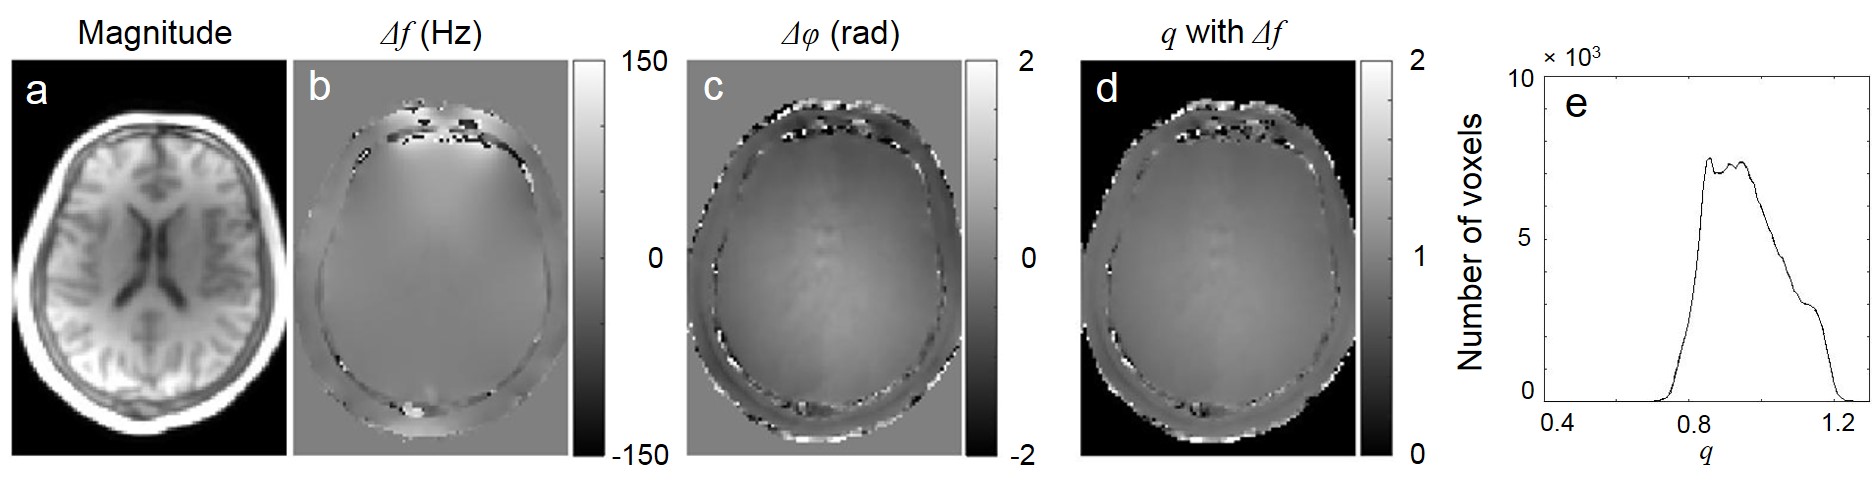
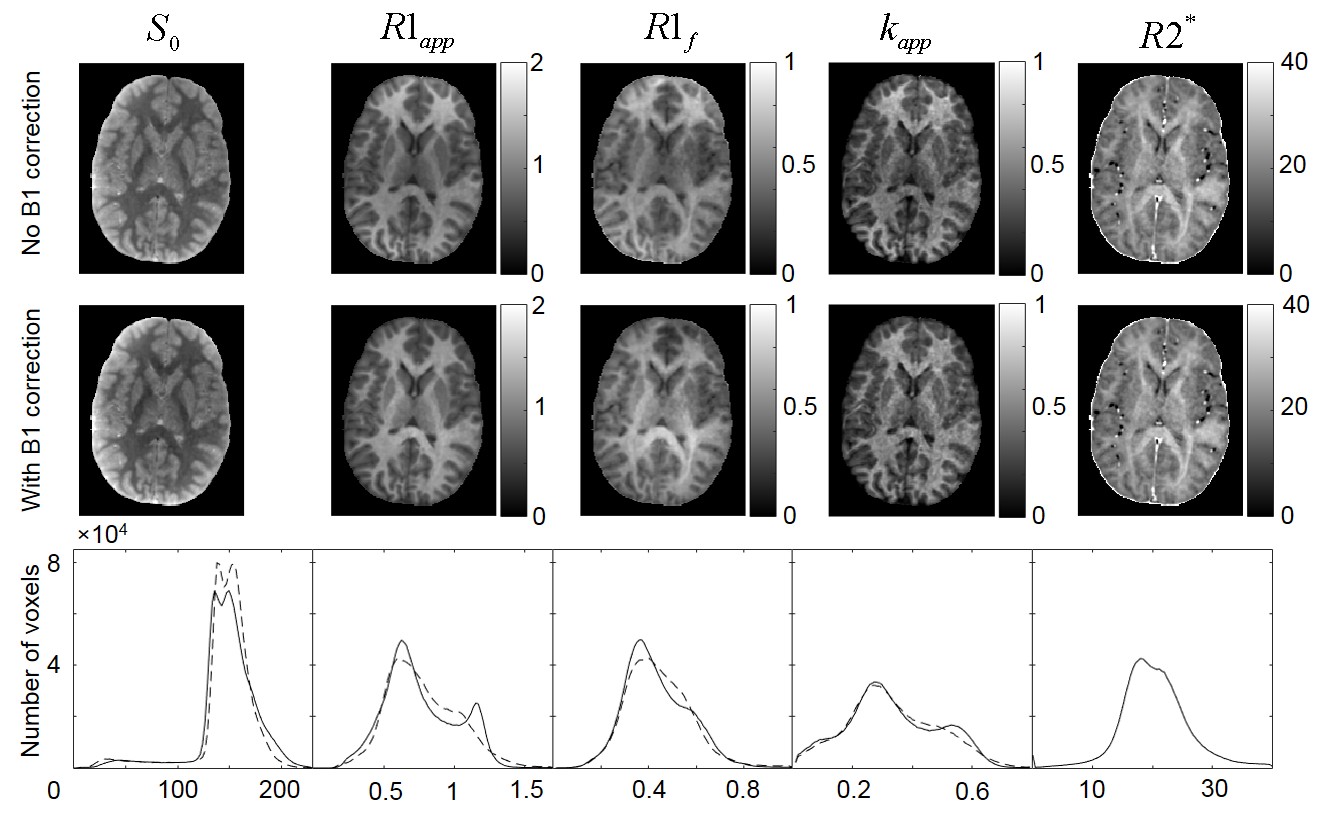
Phantom and human results are presented in Fig.2 and Fig.3, respectively. The maps of the SMART parameters calculated with and without B1 correction are shown in Fig.4.Discussion
Recently, MR signal phase-based methods4-6 have been proposed to measure B1 field. In this study, we proposed a B1 mapping technique that is based on using two orthogonal excitation RF pulses and a GRE sequence with multiple gradient echoes. Such RF pulses generate an MR signal with the phase depending on the RF pulse amplitude, hence a flip angle. The gradient echo train of the GRE sequence allows mapping the local frequency shifts of the MR signal. Combining the phase and frequency measurements with the theoretical expression that we have derived for the MR signal phase, makes it possible to calculate the local B1 field strength. Since the MR signal phase depends on instrumental factors and is diverse across different RF channels in the phased-array coil, we developed optimized methods for combining multi-channel data, allowing for optimal parameters’ estimation. The method was tested on phantoms and a human participant. The result obtained on a small (radius 1.5cm) phantom positioned in the center of the magnet demonstrated the accuracy of our approach – the measured flip angle (see histogram in Fig. 2e) had only a minor dispersion across the small phantom and was practically identical to the result obtained by the standard SIEMENS RF transmitter calibration procedure7-9. As we see in Fig.4, the B1 correction of the flip angles changes the average values of the SMART parameters (up to 10%) and also improves the WM/GM contrast in most maps of relaxation parameters.Conclusion
In this study, we proposed and validated a phase-based mapping method that can be used to get fast, accurate B1 mapping using multi-channel phased-array coil. We demonstrated the accuracy and feasibility of this method on phantoms of different sizes and on a healthy volunteer.Acknowledgements
No acknowledgement found.References
1. Luo J, Jagadeesan BD, Cross AH, Yablonskiy DA. Gradient echo plural contrast imaging--signal model and derived contrasts: T2*, T1, phase, SWI, T1f, FST2*and T2*-SWI. NeuroImage. Apr 2 2012;60(2):1073-1082.
2. Griswold MA, Jakob PM, Heidemann RM, et al. Generalized autocalibrating partially parallel acquisitions (GRAPPA). Magnetic resonance in medicine : official journal of the Society of Magnetic Resonance in Medicine / Society of Magnetic Resonance in Medicine. Jun 2002;47(6):1202-1210.
3. Sukstanskii AL, Wen J, Cross AH, Yablonskiy DA. Simultaneous multi-angular relaxometry of tissue with MRI (SMART MRI): Theoretical background and proof of concept. Magnetic resonance in medicine : official journal of the Society of Magnetic Resonance in Medicine / Society of Magnetic Resonance in Medicine. Mar 15 2016.
4. Morrell GR. A phase-sensitive method of flip angle mapping. Magn Reson Med. Oct 2008;60(4):889-894.
5. Chang YLV. Rapid B1 mapping using orthogonal, equal-amplitude radio-frequency pulses. Magn Reson Med. Mar 2012;67(3):718-723.
6. Sacolick LI, Wiesinger F, Hancu I, Vogel MW. B1 mapping by Bloch-Siegert shift. Magn Reson Med. May 2010;63(5):1315-1322.
7. Perman WH, Bernstein MA, Sandstrom JC. A method for correctly setting the rf flip angle. Magn Reson Med. Jan 1989;9(1):16-24.
8. Carlson JW, Kramer DM. Rapid radiofrequency calibration in MRI. Magn Reson Med. Sep 1990;15(3):438-445.
9. Feiweier T, Heubes P, Speckner T. Method and magnetic resonance system for adjustment of the field strength of rf pulses: Google Patents; 2007.
Figures