3907
On the deviation of actual isocenter slice position in magnetic resonance imagingJulian Emmerich1, Sina Straub1, and Frederik Bernd Laun1,2
1Medical Physics in Radiology, German Cancer Research Center (DKFZ), Heidelberg, Germany, 2Institute of Radiology, University Hospital Erlangen, Erlangen, Germany
Synopsis
Due to imperfect laser positioning, actual isocenter slicepositions can deviate from manufacturer indication. Using MRI as tool for dose planning in MR guided radiation therapy, the geometric correct position of MR-slices is an essential quality parameter that can affect dose calculation and definition of the planning target volume (PTV). To evaluate the magnitude of the deviation of the actual slice position from the true isocenter of the scanner, a phantom study was performed. Scanner-dependent deviations in isocenter slice position occurred in the range of 1 mm - 5 mm.
Purpose
Using MRI as tool for dose planning in MR-guided radiation therapy, the correct geometric position of MR-slices is an essential quality parameter, especially when using integrated MR/radiation therapy devices1. It can affect dose calculation and definition of the planning target volume (PTV)2. To evaluate the magnitude of the deviation of the actual slice position from the manufacturer indication, a phantom study was performed. The phantom was designed such that it can be measured “online”, i.e. in parallel with the patient data acquisition.Methods
A phantom consisting of a pair of two crossed isosceles right-angled triangles on both sides (Fig. 1) was used to measure the difference between the slice positions defined by the vendor-provided laser positioning system and the slice position defined by the magnetic field gradients. If the MR-slice is located in the middle-plane of the phantom, both triangles will appear with the same length in the MR-image. If the slice is shifted, the triangles on both sides (‘right’ and ‘left’) will appear shortened/extended by the length $$$\Delta l$$$. The deviation $$$\Delta z$$$ of the slice position of a transversal slice can be measured as $$$\Delta z = \Delta l$$$. This device is similar to the test object used in the phantom of the American College of Radiology3, but the phantom was designed such that it can be measured in parallel with the patient. To this end, the phantom was integrated in a plastic box that could be integrated in the shuttle table used in a recent MR-guidance study2. The box was filled with tab water. Measurements were performed at four different MR-Scanners (SIEMENS Symphony fit 1.5T, Aera 1.5T, Prisma 3T, Biograph mMR 3T). Over a period of four weeks, the following sequences were tested at each scanner three times a week: TSE (turbo-spin-echo), FLASH (Fast-Low-Angle-Shot), TRUFI (true fast imaging with steady-state free precession) and VIBE (volumetric interpolated breath-hold examination). Automated data analysis was performed with Matlab (The MathWorks, Inc., Natick, MA, USA).Results
The time-curves of the deviation of the slice position are shown in Fig. 2. There is only a rather small inter-day variation in the data. Only for the SIEMENS Prisma, there is a larger drop in slice position after the third measurement (green lines in Fig. 2, A-D), which occurred after a recalibration of the system by a service technician. The scanner isocenter was recalibrated using a spherical phantom and a build-in software tool on the MR-scanner. The differences in slice position between the used sequences are smaller than 1 mm and change only within the standard deviation (except for the Prisma). Mean values of the slice position are given in Table 1. In Fig. 3, the deviation in slice position is plotted pairwise for all sequences and all four scanners in scatter plots. There is a significant correlation between the measurement results for the different sequences (all correlation coefficients are larger than 0.98 with p < 0.001). The red lines in Fig. 3 indicate a linear fit with slope p1 and intercept p2 (cf. Tab. 2). In the inter-scanner comparison, there are large differences between the different scanners of about 6 mm - 8 mm.Discussion
The dependence of the deviation of the scanner system is much stronger than the dependence on the sequence indicating that the main underlying reason for the deviation can be attributed to a scanner specific uncertainties. Due to the weakly mounted laser positioning systems of the scanners, the laserbeams can be misplaced by several millimeters by touching the casing of the scanner. This can lead to a mispositioning of the patients if the casing is displaced accidently. Slice positioning errors could be minimized by using a stationary laser positioning system as used in conventional radiation therapy or by more reliable calibration procedures4.Conclusions
Deviations of more than 6 mm occurred in the inter-scanner comparison of four scanners. Especially when using MR images for radiation treatment planning, this might not be negligible. With the used setup, consistent absolute image position cannot be ensured between different imaging sessions. When critical spatial parameters need to be derived from MR images, e.g. for MR-guided radiation therapy, better positioning systems and more precise calibration methods would be valuable.Acknowledgements
No acknowledgement found.References
1. Lagendijk, et al. (2008). MRI/linac integration. Radiotherapy and Oncology, 86(1), 25-29.2. Bostel, T. et al. Radiation Oncology (London, England) 9 (2014): 12. PMC. Web. 6 Nov. 2016.
3. Clarke, G. D. (2004). University of Texas Southwestern Medical Center at Dallas.
4. Brahme, A., Nyman, P., and Skatt, B. (2008). Medical Physics, 35(5), 1670-1681.
Figures

Fig.1: Phantom used to determine the actual slice
position consisting of a pair of two crossed
isosceles right-angled triangles on each side. The phantom is integrated in a
container filled with tab water.
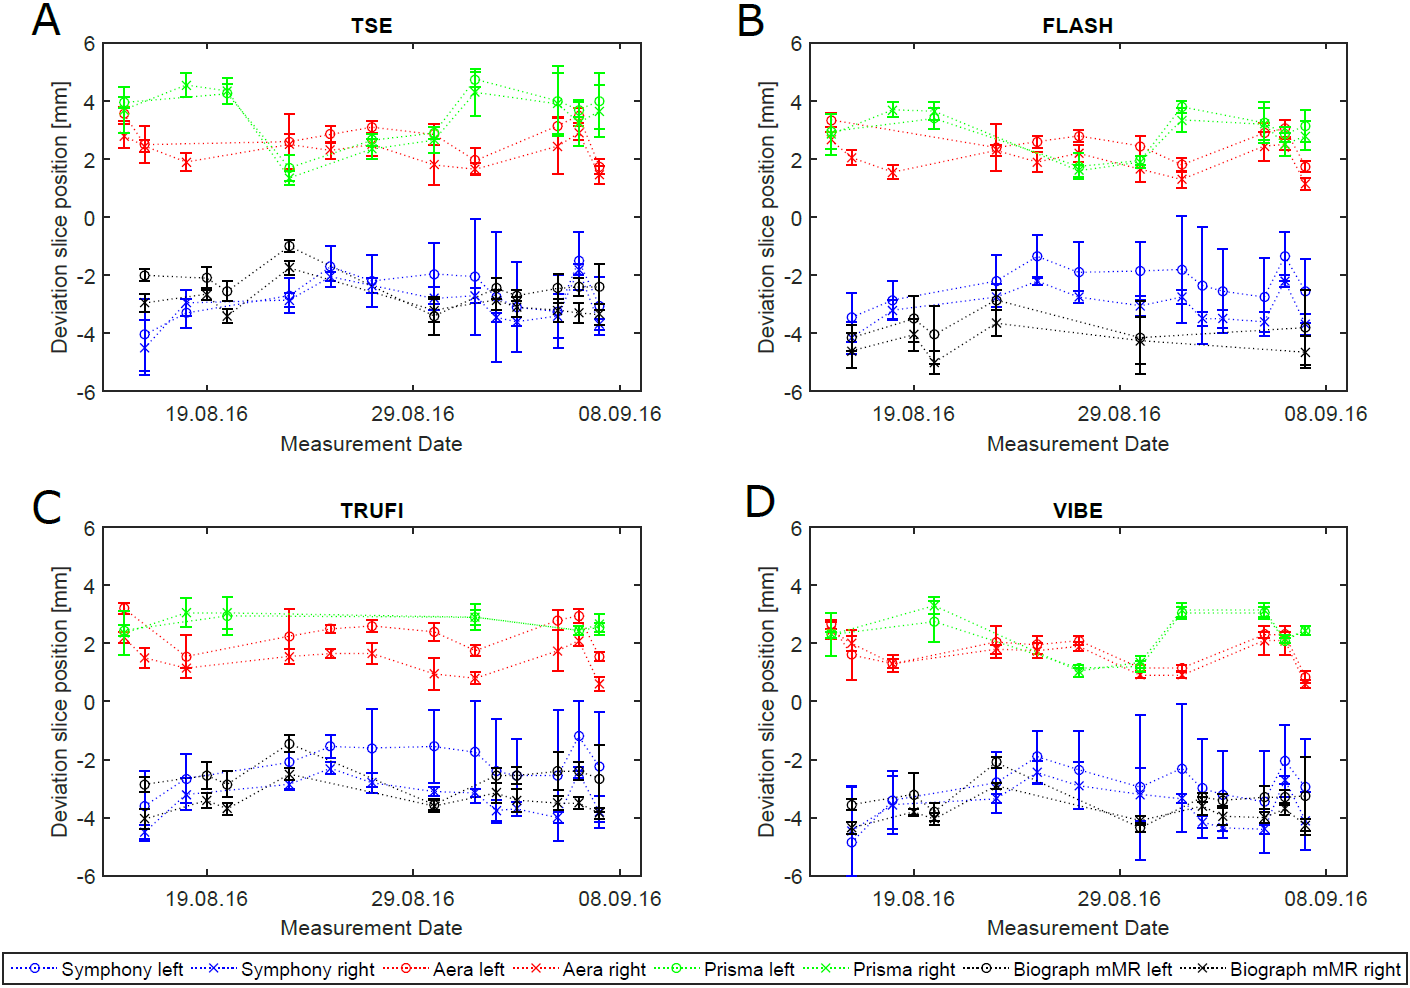
Fig. 2: Measured deviations in slice position for the
different sequences TSE, FLASH, TRUFI and VIBE (A-D). The two measurements on
the right and left side of the phantom are marked with ‘right’ and ‘left’. In C,
several measurements at the Prisma fit are missing due to a strong influence of
susceptibility artifacts which made automated evaluation impossible.
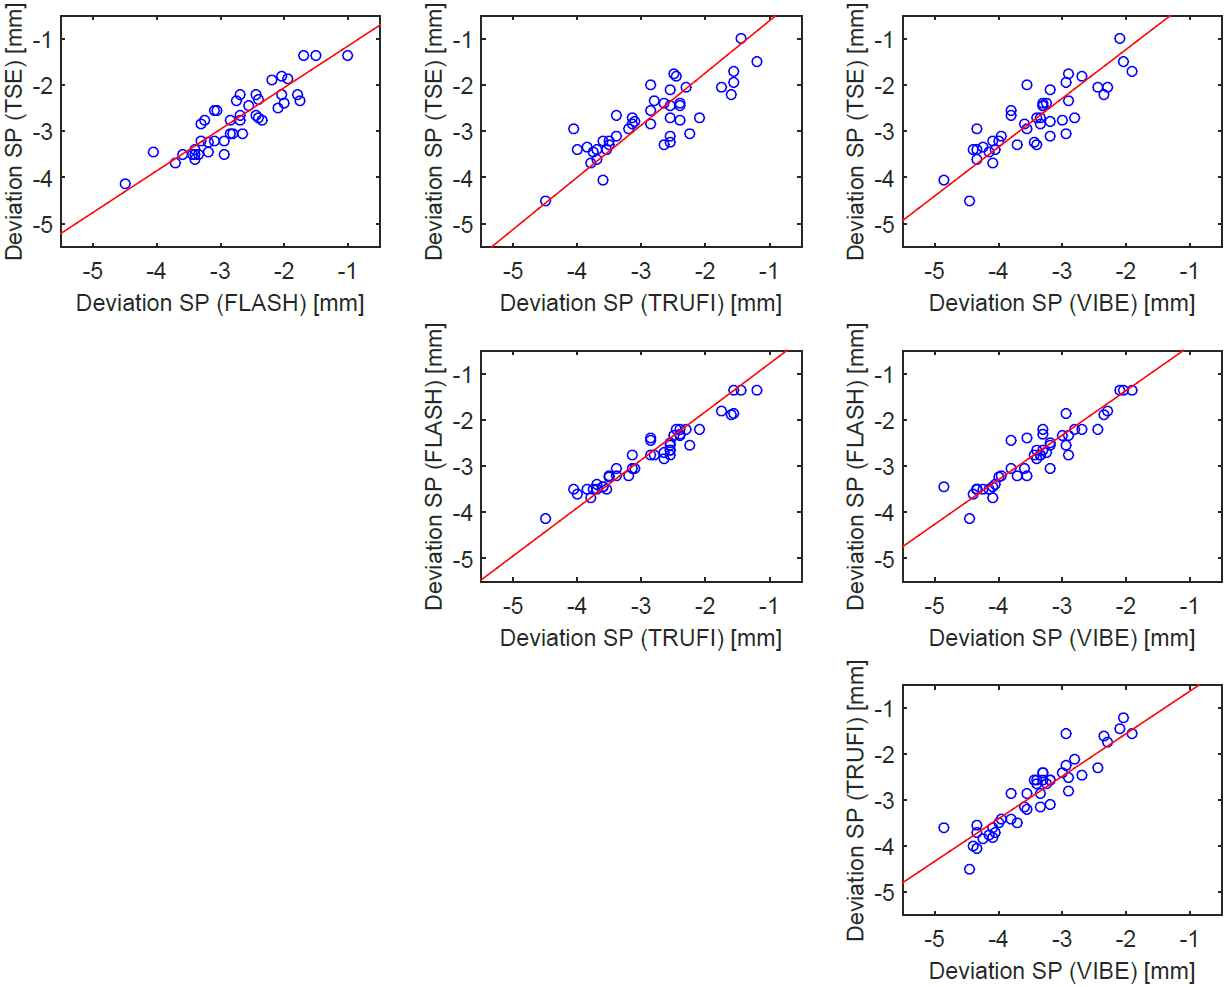
Fig. 3: Scatter plots of the deviation in slice
position (SP) for the used sequences (TSE, FLASH, VIBE and TRUFI). Deviations
are plotted pairwise for all sequences. A linear regression was performed for
each subplot (red lines). Fit results are shown in Tab. 2.
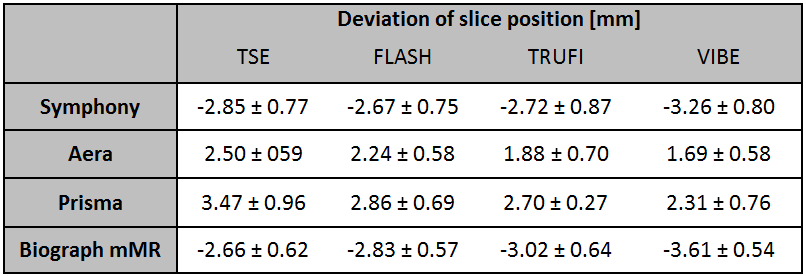
Tab. 1: Mean values of the deviation of slice position from the
data in Fig 2. Standard deviations indicate the variance among different
examination days.
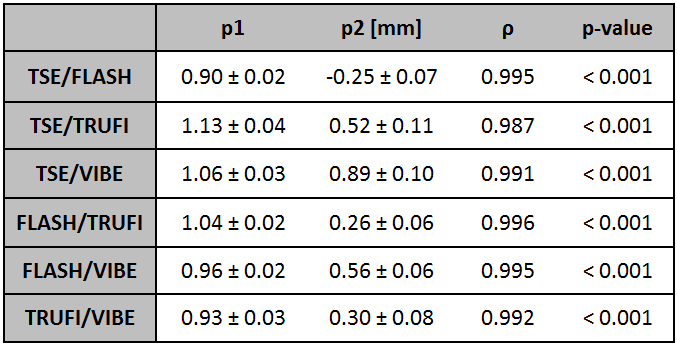
Tab. 2: Correlation coefficients and the results of a linear
fit from the data in Fig. 3.