3898
SPM-BASED SEGMENTATION OF AIR IN THE HUMAN HEAD FOR IMPROVED PET ATTENUATION CORRECTION IN SIMULTANEOUS PET/MR1Monash Biomedical Imaging, Monash University, Melbourne, Australia, 2Department of Biophysics, University of Rzeszow, Rzeszow, Poland, 3Department of Electrical and Computer Systems Engineering, Monash University, Melbourne, Australia, 4Monash Institute of Cognitive and Clinical Neurosciences and School of Psychological Sciences, Monash University, Melbourne, Australia, 5Australian Research Council Centre of Excellence for Integrative Brain Function, Monash University, Melbourne, Australia, 6Monash Imaging, Monash Health, Melbourne, Australia, 7Institute of Neuroscience and Medicine, Forschungszentrum Jülich GmbH, Jülich, Germany
Synopsis
Dual-echo UTE MR sequences are widely used to estimate PET attenuation coefficients in simultaneous PET/MR imaging. However, due to susceptibility artefacts, air cavities in the head together with brain tissues and bones, can be misclassified, especially around air-tissue interface regions. In this work, we propose an SPM-based air and background segmentation method to improve the PET attenuation correction for simultaneous PET/MR imaging of the human brain. We compare air segmentation methods for more accurate air classification using an in-vivo MR-PET dataset and demonstrate improved PET image reconstruction accuracy.
INTRODUCTION
Simultaneous PET/MR scanners enable acquisition
of concurrent PET and MR image datasets and highly novel investigations of the brain. However,
one major issue with simultaneous PET/MR is the challenge of obtaining accurate
linear attenuation coefficients (LAC) maps (μmap) for quantitative PET imaging. One
of the state-of-the-art methods is to use a dual-echo UTE (dUTE) MR sequence to
estimate T2 values of bones in the human head, with the T2 maps then converted
to attenuation coefficients1. However, UTE based methods are
prone to susceptibility artefacts, and this makes separation of air cavities, soft
tissue and bones a challenging task1. In this study, we propose a method
for air classification with improved accuracy and using an in-vivo dataset, we show
that the method provides more accurate PET image reconstruction. METHODS
Materials: One healthy subject (29y) was scanned using a 3T PET/MR scanner (Biograph mMR, Siemens Healthcare GmbH). The study was approved by the Monash University Human Research Ethics Committee. A dUTE sequence (TE1=0.07ms, TE2=2.46ms, TR=11.94ms) was acquired for μmaps generation. PET list-mode data were acquired with 18F-FDG tracer.
μmaps calculation: An air mask was obtained with the first echo UTE volume segmented using SPM12 toolbox (Statistical Parametric Mapping, Wellcome Trust Centre for Neuroimaging). Segmentation was processed using probabilistic tissues templates provided in SPM and voxel-based morphometry2. Bias normalisation was performed prior to the segmentation and four Gaussians were used to model the intensity distribution of the air. All voxels in the air probabilistic map above 0.1 were identified as air.
Bone and soft tissue masks were produced based on T2 values of the brain, where bones and soft tissue LACs were set to 0.151 cm-1 and 0.096 cm-1, respectively3. The raw μmap obtained was further filtered with a Gaussian mask of 4 mm in full width of at half maximum (FWHM) to obtain the final μmap (μmapSPM).
The SPM-based method was compared with the following MR-based μmaps based on different approaches to obtain the air mask:
1. Reference (μmapref) – manually segmented UTE1 image for three tissue types: bone (LAC=0.151 cm-1), soft tissue (0.096 cm-1) and air (0 cm-1) with segmentation performed under the supervision of a clinical radiologist.
2. Histogram-based (μmaphist) – external and internal air masks estimated based on thresholding histograms in UTE images3.
3. Region growing-based (μmapregion) – air masks obtained using region growing methods (external air) and thresholding (air cavities)4.
All of the methods used the same T2 approach to obtain bone and soft tissue attenuation values3.
Reconstruction: The PET data were reconstructed using the Siemens Biograph mMR system with the following parameters: ordinary Poisson ordered-subsets expectation maximization algorithm (24 subsets, 3 iterations) and point spread function correction. The reconstructed PET data were smoothed using a 3-D 5mm Gaussian filter. The μmapref PET (PETref) image is taken as a reference, and normalized error maps were used for the comparison amongst methods, given as: E=100%*(PETX-PETref)/PETref, where PETX is the PET image obtained using one of the above μmaps.
RESULTS
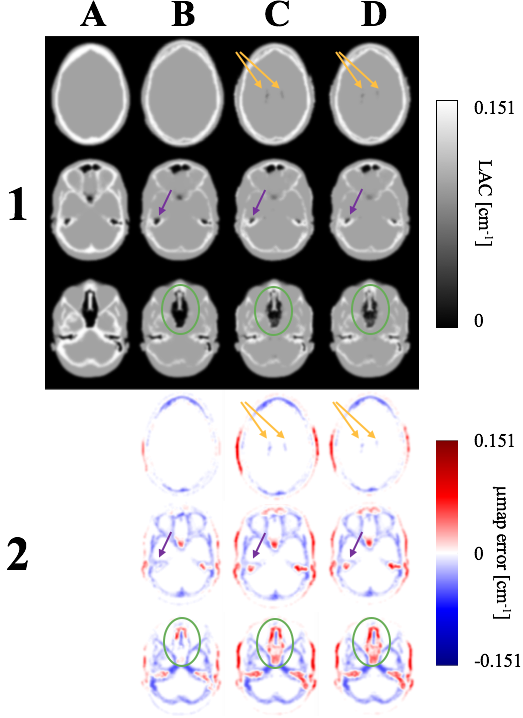
μmaps: As shown in Figure 1, the proposed μmapSPM shows more accurate classification of air cavities inside the brain than both μmaphist and μmapregion. In particular, the proposed method shows improved segmentation in nasal cavities, temporal bones, and regions outside the head. It is also noted that μmapSPM shows an accurate classification of ventricular CSF (Figure 1). The μmapSPM shows larger errors in spinal CSF, and about the teeth, compared to other techniques.
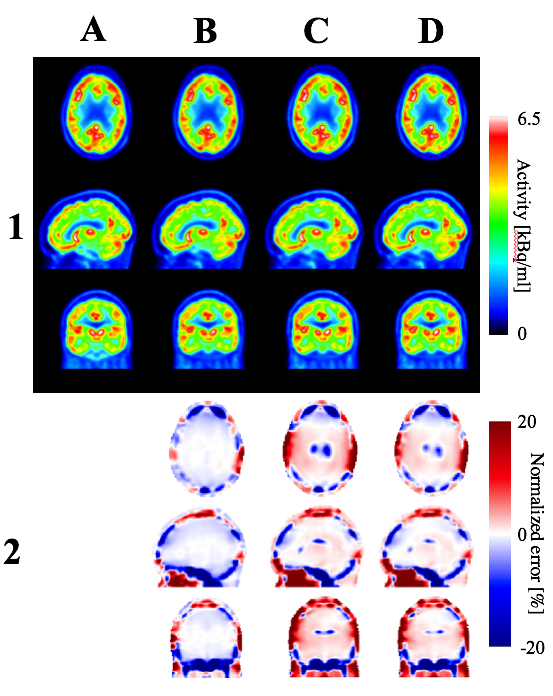
Reconstructed images: Reconstructed PET data and normalized error maps are presented in Figure 2. We found significant improvements throughout the whole brain using the proposed method compared to other techniques. Smaller errors and more uniform normalized error distribution were observed using μmapSPM (Figure 2). The largest differences between methods were observed in nasal cavities, ventricles and temporal lobes, and the proposed method showed significant improvements in those regions.
DISCUSSION AND CONCLUSSIONS:
We investigated the
impact of the accurate MR-based air segmentation process on reconstructed PET
data. The proposed SPM12-based air and background segmentation method shows
significantly improved air classification about the temporal bones, nasal
cavities, and other extracranial regions, that resulted in more accurate PET
data reconstruction throughout the whole brain. The most significant improvement
was observed in the ventricles and temporal lobes. However, the cerebellar
regions showed less accurate uptake for PETSPM. This may be caused
by the absence of the neck region from the template in the current SPM toolbox.
Our next step is to further improve the segmentation results in the neck area
by improving the template coverage.Acknowledgements
We acknowledge Thomas Close, Jason Bradley, Alexandra Carey, Shenpeng Li and Richard McIntyre for their help in facilitating this research.References
1 Izquierdo-Garcia, D. & Catana, C. MR Imaging-Guided Attenuation Correction of PET Data in PET/MR Imaging. PET Clin 11, 129-149, doi:10.1016/j.cpet.2015.10.002 (2016).
2 Ashburner, J. & Friston, K. J. Unified segmentation. Neuroimage 26, 839-851, doi:10.1016/j.neuroimage.2005.02.018 (2005).
3 Cabello, J. et al. MR-based attenuation correction using ultrashort-echo-time pulse sequences in dementia patients. J Nucl Med 56, 423-429, doi:10.2967/jnumed.114.146308 (2015).
4 Keereman, V. et al. MRI-based attenuation correction for PET/MRI using ultrashort echo time sequences. J Nucl Med 51, 812-818, doi:10.2967/jnumed.109.065425 (2010).
Figures