3896
Fast Magnetic Resonance Fingerprinting of Mouse Brain Using a Spiral Trajectory1Department of Biomedical Engineering, Case Western Reserve University, Cleveland, OH, United States, 2Department of Radiology, Case Western Reserve University, Cleveland, OH, United States, 3Department of Pediatrics, Case Western Reserve University, Cleveland, OH, United States, 4Department of Physiology and Biophysics, Case Western Reserve University, Cleveland, OH, United States
Synopsis
In this study we developed spiral-based MRF sequences for fast T1 and T2 mapping of mouse brain at 7T. A variable density spiral trajectory that fully sampled the inner 10×10 k-space with 4 interleaves enabled up to 6-fold acceleration for both MRF-bSSFP and MRF-FISP sequences, corresponding to a 3-min scan to acquire 1024 time frames for simultaneous T1 and T2 mapping.
Introduction
MRF using non-Cartesian readout has demonstrated accurate T1 and T2 mapping with highly undersampled data on clinical scanners (1). However, the requirement of high spatial resolution and hardware constraints may limit the undersampling capacity of MRF for preclinical imaging of mice. The increased susceptibility changes also presents challenges for accurate parameter estimation at high field. Previous study using a FISP-base MRF sequence with Cartesian readout showed T1 and T2 mapping free of banding artifact but with reduced T2 sensitivity (2). In the current study, we examined the accuracy, artifacts, and under-sampling capacity of FISP- and bSSFP-based MRF sequences using a spiral trajectory.Methods
MRF Methods: Two MRF sequences, MRF-bSSFP and MRF-FISP, were developed and evaluated (Fig. 1a) Fingerprint acquisition comprised of 1024 time frames acquired with variable flip angle and repetition time in 11.24 s (Fig. 1b). The readout used a zeroth-moment compensated variable density spiral trajectory that fully sampled the entire k-space and the inner 10×10 k-space with 48 and 4 interleaves, respectively (Fig. 1c). Maximal gradient and slew rate were limited to 100 mT/m and 1000 T/m/s, respectively. Dictionaries with T1 varying from 135 to 4055 ms and T2 varying from 5.5 to 368 ms were generated from the simulation of the Block equation. MRF-bSSFP dictionary also included off-resonance frequencies varying from -80 to +80 Hz. The normalized dictionary entry that generated the maximal inner product with the normalized signal was chosen as the match. T1 and T2 maps were then derived from the matched entries. Off-resonance map was also derived from fingerprint matching using the MRF-bSSFP sequence.
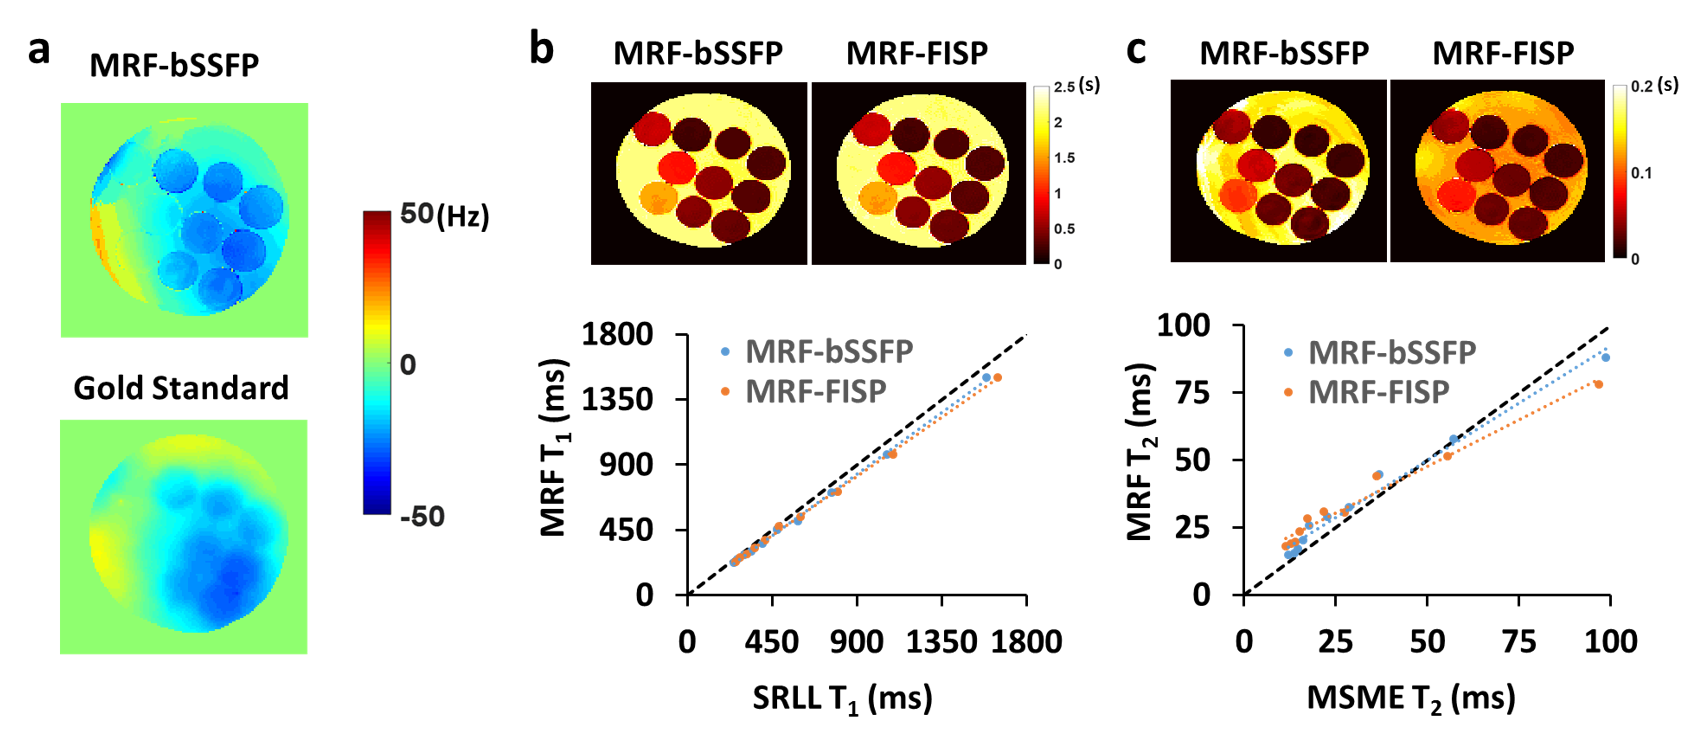
MRI Experiments: All studies were performed on a Bruker 7T scanner. In vitro study was performed on a 10-compartment phantom with manganese concentration varying from 50 to 500 µM. Fully sampled data were also acquired from mouse brains in vivo. Both in vitro and in vivo acquisition used a 7.5˚ rotation of the spiral trajectory from one time frame to the next. Undersampling factors of 2, 3, 4, 6, 8, 12, 16, 24, and 48 were evaluated retrospectively. All images were acquired with 3×3 cm2 FOV and 128×128 matrix size, yielding an in-plane resolution of 0.23x0.23 mm2. Slice thickness was 1.5 mm. T1 maps acquired with the saturation recovery look-locker (SRLL) sequence and T2 maps acquired with the multi-slice multi-echo (MSME) sequence were used as the gold standards. Field maps were also acquired and regularized using the method proposed by Funai et al (3).
Results
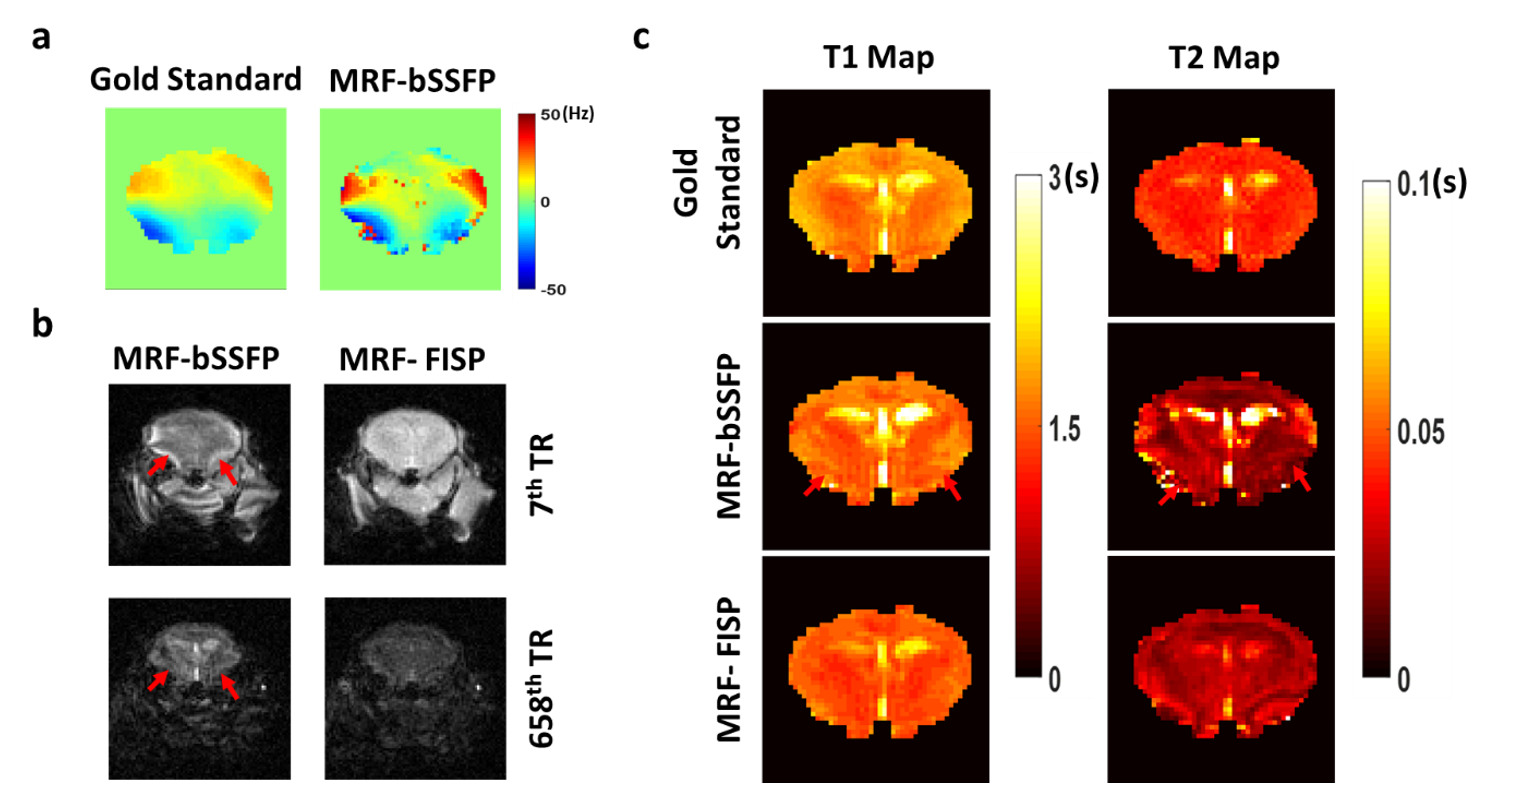
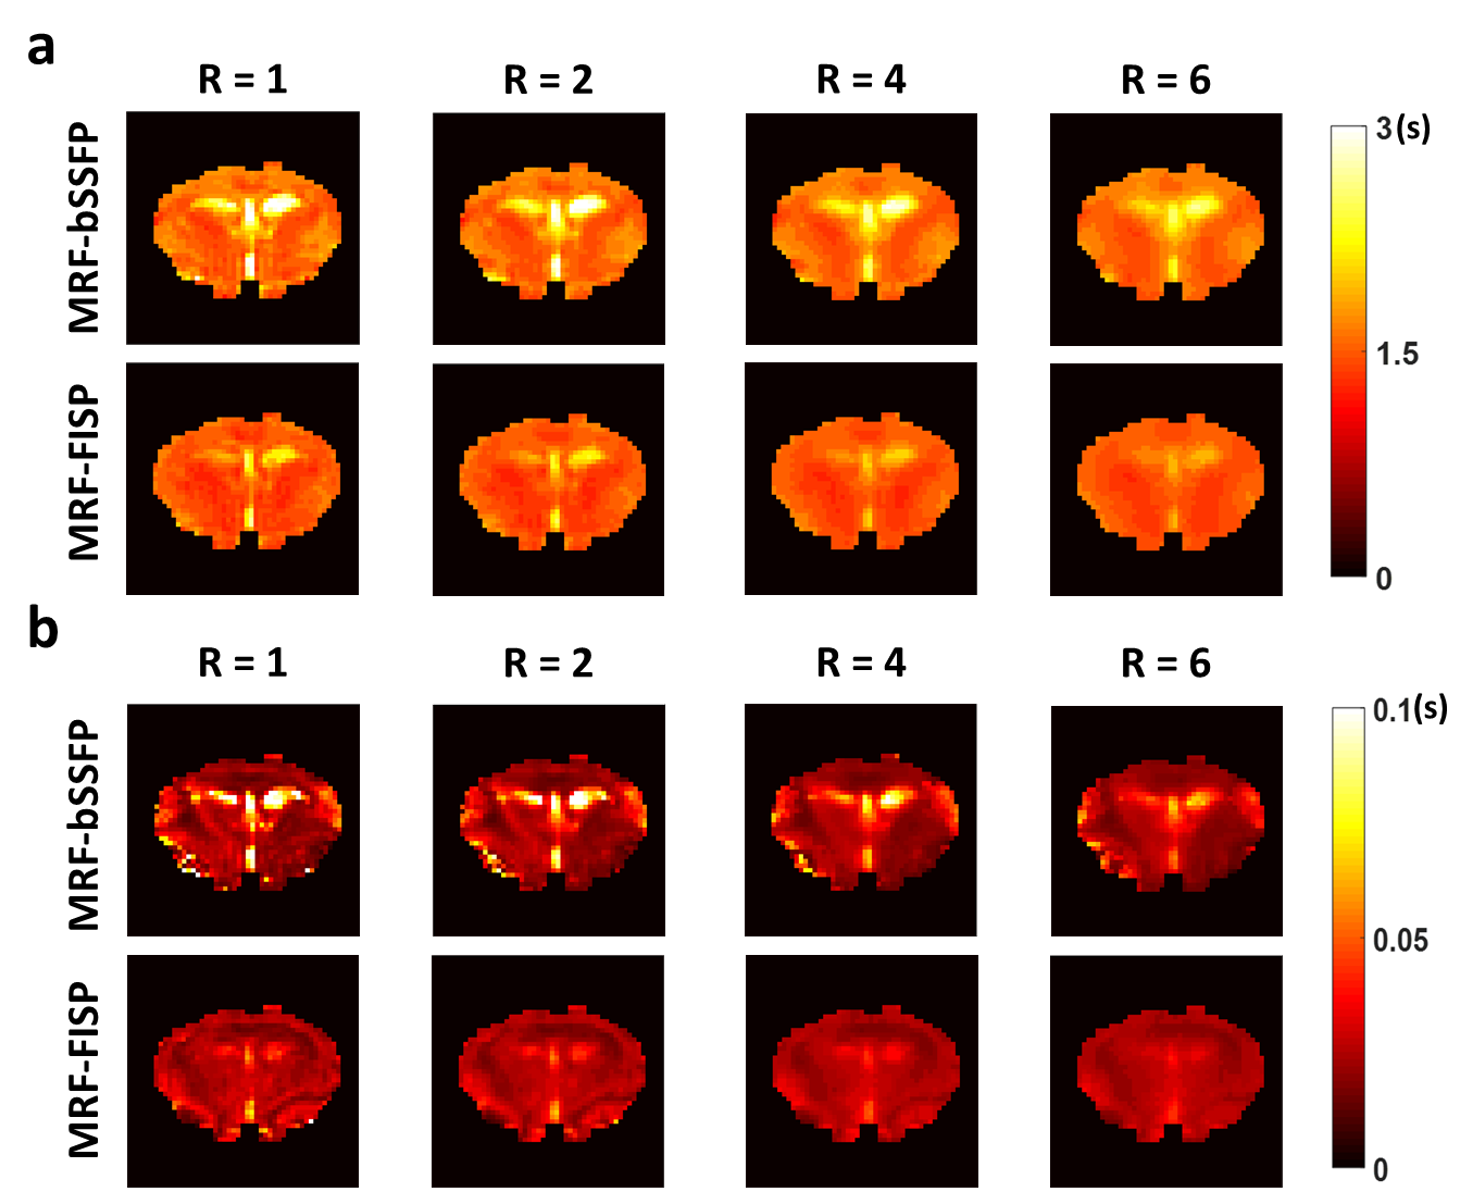
With a field variation within ±40 Hz (Fig. 2a), no obvious banding artifact was observed in T1 and T2 maps generated from MRF-bSSFP data (Fig. 2b&c). T1 estimation by both MRF-bSSFP and MRF-FISP sequences showed strong agreement with the gold standard (Fig. 2b). For T2 estimation MRF-bSSFP showed better agreement with the gold standard, while MRF-FISP underestimated long T2 values by 20% (Fig. 2c). MRF-measured T1 and T2 values in all 10 compartments were similar for up to 6-fold undersampling (Fig. 3a-d). Further undersampling resulted in incorrect parameter estimation, especially in compartments with short T1 or T2 values. T1 and T2 maps generated from data with 6-fold undersampling (Fig. 3e) showed good agreement with those generated from fully sampled data (Fig. 2b&c). However, undersampling gave rise to blurring of the reconstructed T1 and T2 maps. In vivo results from a mouse brain are shown in Fig. 4. Despite significant field variation, MRF-derived T1 and T2 maps showed good anatomical agreement with the gold standards, although banding artifacts were observable in the maps generated from MRF-bSSFP data. Both MRF-bSSFP and MRF-FISP showed underestimation of the T1 and T2 values, possibly caused by B1 miscalibration. Large field offset also contributed to the estimation errors. Fig. 5 compares the effects of undersampling on the reconstructed T1 and T2 maps. Maps generated with an undersampling factor of 2 and 4 showed strong agreement with the fully sampled data. With an undersampling factor of 6, significant blurring of the reconstructed maps were observed. Due to hardware limitations, the trajectory used in the current study sampled the center k-space less densely than that used by Ma et al (1), leading to a less optimal PSF and reduced undersampling capacity.Discussion and Conclusion
We evaluated the accuracy, artifacts, and under-sampling capacity of two MRF sequences using a spiral trajectory. Our results suggest that spiral-based MRF has the potential for fast and simultaneous T1 and T2 mapping in small animals. With further optimization of the sampling trajectory, it is possible to acquire both T1 and T2 maps within 3 min.Acknowledgements
No acknowledgement found.References
1. Ma D, Gulani V, Seiberlich N, Liu K, Sunshine JL, Duerk JL, Griswold MA. Magnetic resonance fingerprinting. Nature 2013;495:187-192.
2. Gao Y, Chen Y, Ma D, Jiang Y, Herrmann KA, Vincent JA, Dell KM, Drumm ML, Brady-Kalnay SM, Griswold MA, Flask CA, Lu L. Preclinical magnetic resonance fingerprinting (MRF) at 7 T: effective quantitative imaging for rodent disease models. NMR Biomed. 2015;28:384–394.
3. Funai AK, Fessler JA, Yeo DTB, Olafsson VT, Noll DC. Regularized fieldmap estimation in MRI. IEEE Trans Med Img 2008;27:1484-1494.
Figures