3895
In Vivo T1 and T2 Mapping using Single-Shot EPI Fingerprinting1Radiology, Oregon Health and Science University, Portland, OR, United States, 2Advanced Imaging Research Center, Oregon Health and Science University, Portland, OR, United States, 3Siemens Healthcare, Portland, OR, United States
Synopsis
MR fingerprinting (MRF) studies have been performed using heavily undersampled spiral acquisitions, which constantly rotate and use uncorrelated aliasing to fit quantitative T1 and T2 maps. On top of the usual spiral sensitivity to off-resonance, the undersampling used in MRF requires a slowly varying signal evolution to “see through” the aliasing artifacts. Echo-planar imaging (EPI) would avoid these aliasing issues while still having a short measurement time due to a single-shot acquisition and parallel imaging acceleration. In this study, a single-shot EPI sequence is combined with fingerprinting techniques to obtain T1 and T2 maps similar to those from spiral fingerprinting.
Purpose
Magnetic resonance fingerprinting (MRF) allows for quantitative mapping of multiple parameters in a potentially shorter time than conventional methods. Previous studies have focused on T1 and T2 relaxation times[1,2], relying solely on flip angle and repetition time changes. However, all studies have been performed using heavily undersampled spiral acquisitions which constantly rotate and use uncorrelated aliasing to properly fit the quantitative T1 and T2 relaxation values. On top of the usual spiral sensitivity to off-resonance artifacts, the aggressive undersampling used in MRF requires a slowly varying signal evolution to “see through” the aliasing artifacts. Echo-planar imaging (EPI) would avoid these aliasing issues while still having a short measurement time due to a single-shot acquisition and parallel imaging acceleration. A previous study has examined use of a hybrid EPI/bSSFP sequence for MRF[3], but with a small EPI factor of 4, and was focused only on ultra-low magnetic fields (6.5mT) and not at the conditions required for routine imaging. We investigated single-shot EPI for the use of T1 and T2 fingerprinting in vivo at 3T.Methods
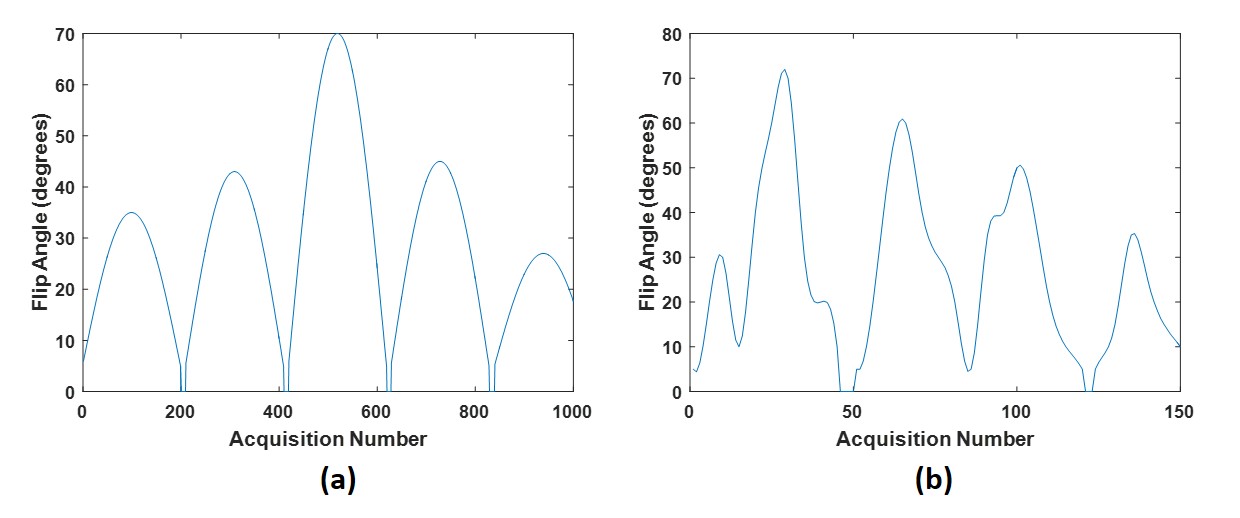
One healthy volunteer (male, 32) was recruited under an IRB approved protocol. An axial slice was scanned with standard T1 and T2 mapping sequences, a spiral MRF sequence, and an EPI MRF sequence on a 3T Prisma (Siemens) using body coil transmit and 64-channel head coil receive. The spiral sequence consists of an undersampled variable density spiral with FISP contrast, ~24x undersampled at the center of k-space and 48x undersampled at the edges. The undersampled spiral arm was acquired for 1000 TR periods, with the flip angle values shown in Figure 1a. Additional parameters include FOV=30cm, 256 matrix, TE/TR=3/15ms, acquisition time = 15s. Spiral images were reconstructed using a 2D Nonuniform Fourier Transform and coils were combined using adaptive combination[4].
The 2D single-shot EPI sequence was acquired with TE/TR=15/52ms, GRAPPA 3, partial Fourier = 7/8, no fat sat, 128 matrix, (1.6mm)2 in-plane resolution, 3.6 and 5mm slice thickness. A single fully sampled EPI image was acquired 100 times (5.2s), with the flip angle train shown in Figure 1b. Dictionary values for both fingerprinting sequences were generated using an extended phase graph (EPG) simulation with T1 values from 0-3000ms in 30ms increments, T2 from 0-200 in 2ms increments. The T1 and T2 values were fit by taking the largest dot product at each pixel between the measured signal and all entries of the dictionary.
Conventional quantitative T1 images were acquired with multiple flip angle 3D GRE (6 flip angles 5-27°). Conventional quantitative T2 images were acquired with a multi-echo spin-echo sequence (15 TEs 16.6-132.8ms). Conventional quantitative T2* images were acquired with a multi-echo gradient-echo sequence with (8 TEs 2.5-50ms). The conventional T1 map was fit using the Siemens software, while the T2 and T2* maps were fit with a monoexponential two-parameter fit in Matlab (Mathworks).
Results
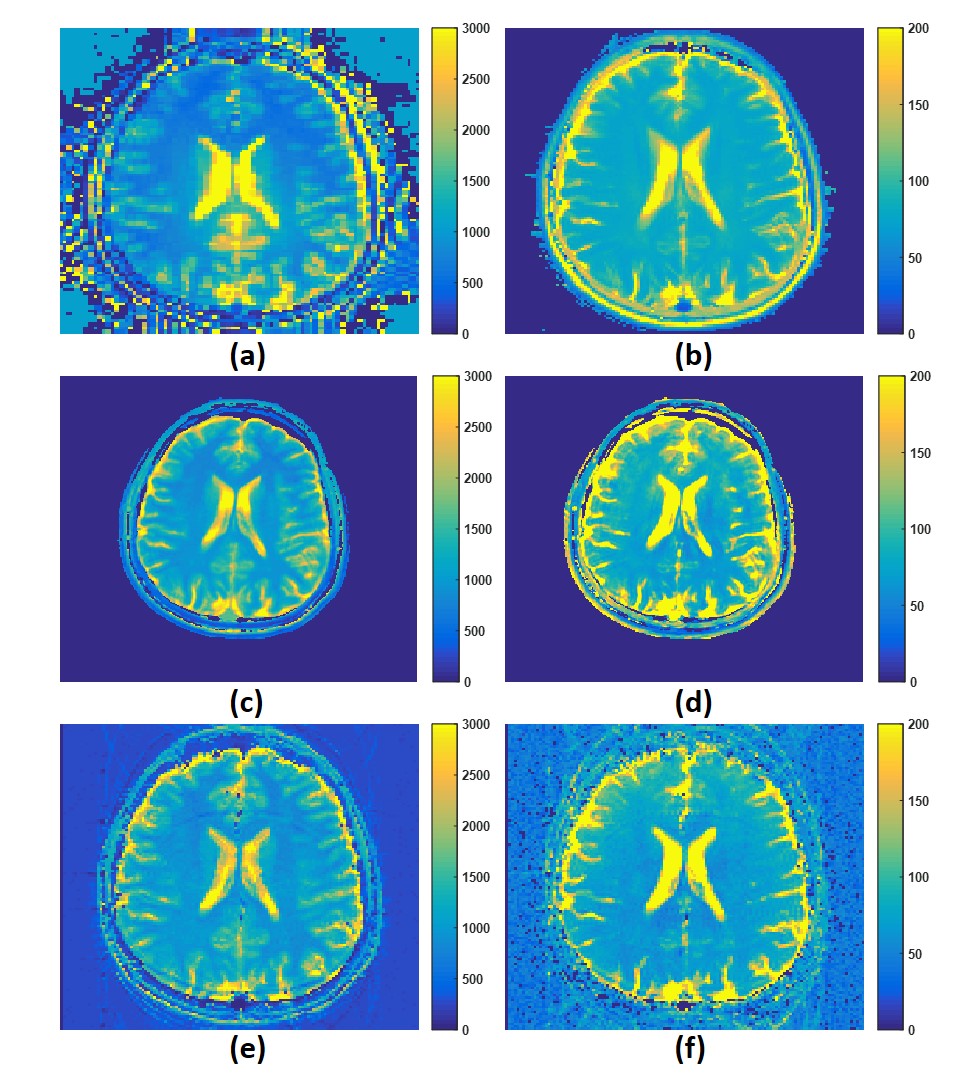
T1 and T2 quantitative maps obtained from conventional techniques, spiral MRF, and the proposed EPI MRF methods are shown in Figure 2.Discussion
The results in Figure 2 demonstrate good spatial and quantitative agreement between conventional T1 and T2 maps, spiral MRF, and the proposed single-shot EPI MRF. This demonstrates that MRF techniques can be applied to more conventional Cartesian sequences and obtain comparable results in a similar time frame. The increased image quality of the EPI sequence per measurement compared to spiral allows for a reduced number of acquired images to acquire accurate maps. There is a small reduction in the T2 contrast using EPI fingerprinting compared to the other methods, most likely a result of the increased TR reducing the dynamic T2 information retained from acquisition to acquisition. Additionally, there is some aliasing of the surrounding fat layers, which can be removed through the addition of fat suppression schemes.Conclusion
The technique proposed demonstrates the ability to acquire quantitative T1 and T2 maps quickly in one acquisition using a single-shot EPI sequence in under 5s. The use of a conventional Cartesian sequence and fully sampled images allow for easier implementation of parallel imaging methods and preparation pulses, and is compatible with simultaneous multi-slice acquisitions[5], which could allow for whole-brain T1 and T2 maps in 1-2 minutes. Future work will focus on quantifying the ideal number of acquisitions, flip angles, and TR values to obtain the most accurate T1 and T2 values in the shortest time.Acknowledgements
This research was supported by an OHSU Knight Cancer Institute Pilot Grant.References
[1] Ma, et al. Magnetic Resonance Fingerprinting. Nature. March 2013. 495. 187-192
[2] Jiang, et al. MR fingerprinting using fast imaging with steady state precession (FISP) with spiral readout. MRM. December 2015.74(6).
[3] Sarracanie, et al. 3D Balanced-EPI Magnetic Resonance Fingerprinting at 6.5mT. Proc. of the International Society for Magnetic Resonance in Medicine, 2015 #3385
[4] Walsh, DO. Adaptive reconstruction of phased array MR imagery. MRM. 2000 May;43(5):682-90.
[5] Grinstead, et al. Slice-Accelerated Inversion Recovery T1 Mapping. Proc. of the International Society for Magnetic Resonance in Medicine, 2014 #3215
Figures