3894
Water content, diffusion measures (DTI/DKI) and FET-PET in brain tumours: investigating similarities and differences1INM-4, Research Centre Jülich, Jülich, Germany, 2Instituto de Biofísica e Engenharia Biomédica, Sciences Faculty, University of Lisbon, Lisbon, Portugal
Synopsis
Water content, diffusion measures and FET-PET measured simultaneously on a hybrid 3T scanner in 40 brain tumour patients were investigated. Despite reasonable expectations of finding some microscopic-structure-driven correlations between these parameters, compared here for the first time, low correlations were found in healthy tissue. Interestingly, the correlation between water content and diffusion indices -while still rather low - increased in tumour tissue. Importantly, this implies that each parameter reflects different aspects and thus their combination should be more powerful for oncology than using single parameters
Introduction
Water content is highly regulated in the healthy brain and changes of a few percent units are already indicative of pathology. Surprisingly, water content was found to be remarkably constant also in notoriously heterogeneous active tumour tissue irrespective of malignancy and despite conventional MRI visualising varying levels of tumour-related oedema1. Very constant, tissue-specific water content was also reported in fixed tissue2, despite large variability in other MR parameters and the obvious absence of active regulatory mechanisms. Furthermore, a recent study of the correlation between water content and electrical conductivity (Na content) of tissue appeared to reveal a large pool of tissue water which does not participate in conduction (osmosis), perhaps because it is closely associated with surfaces3. These observations suggest that water content might be associated to the presence of macromolecules, ions, membranes, etc, around which it forms layers of hydration; this simple property of tissue is thus intimately related to its deepest microscopic structure. Another microscopic probe of tissue organisation is offered by the MR-measurable diffusion of water molecules. Diffusion properties of water are determined by the presence and structure of microscopic barriers – e.g. myelin sheaths and cell membranes - in the path of free diffusion. PET imaging of amino acid transport with O-(2-F-18-fluoroethyl)-L-tyrosine (FET) is a powerful tool for brain tumour diagnostics4, and is assumed to be so by reflecting the density of aminoacid receptors on membranes and, thus, to some extent, cell membrane distribution. These very different parameters, water content, diffusion measures - fractional anisotropy (FA), mean diffusivity (MD), radial diffusivity (RD), axial diffusivity (AD), mean kurtosis (MK), radial kurtosis (RK) and axial kurtosis (AK) - and aminoacid PET can thus be reasonably expected to be, to some extent, correlated and to reflect, to some extent, similar microscopic structures. We investigated in the present study whether this hypothesis is substantiated by the data and to what extent.Purpose
This study focuses on investigating correlations between the mentioned parameters and verifying previous water content results in tumour tissue with increased statistics using data from 40 patients. A unique feature of our experimental set-up based on a hybrid 3T MR-PET system is the possibility to measure all these parameters simultaneously with the patient in the same physiological state.Materials & Methods
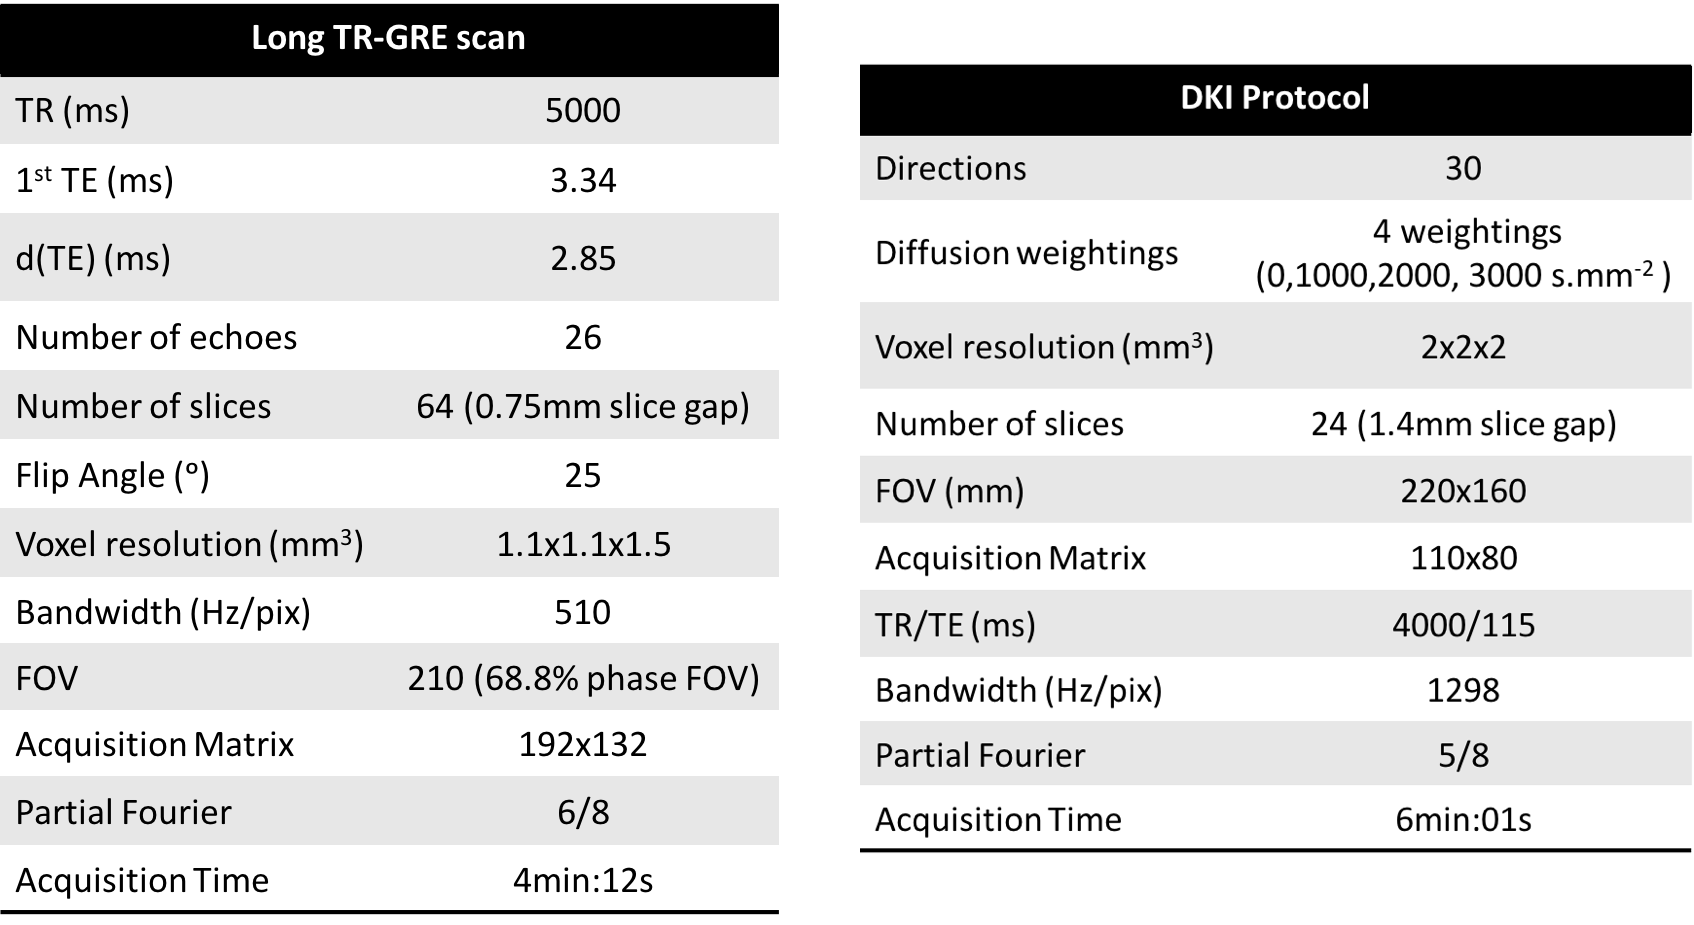
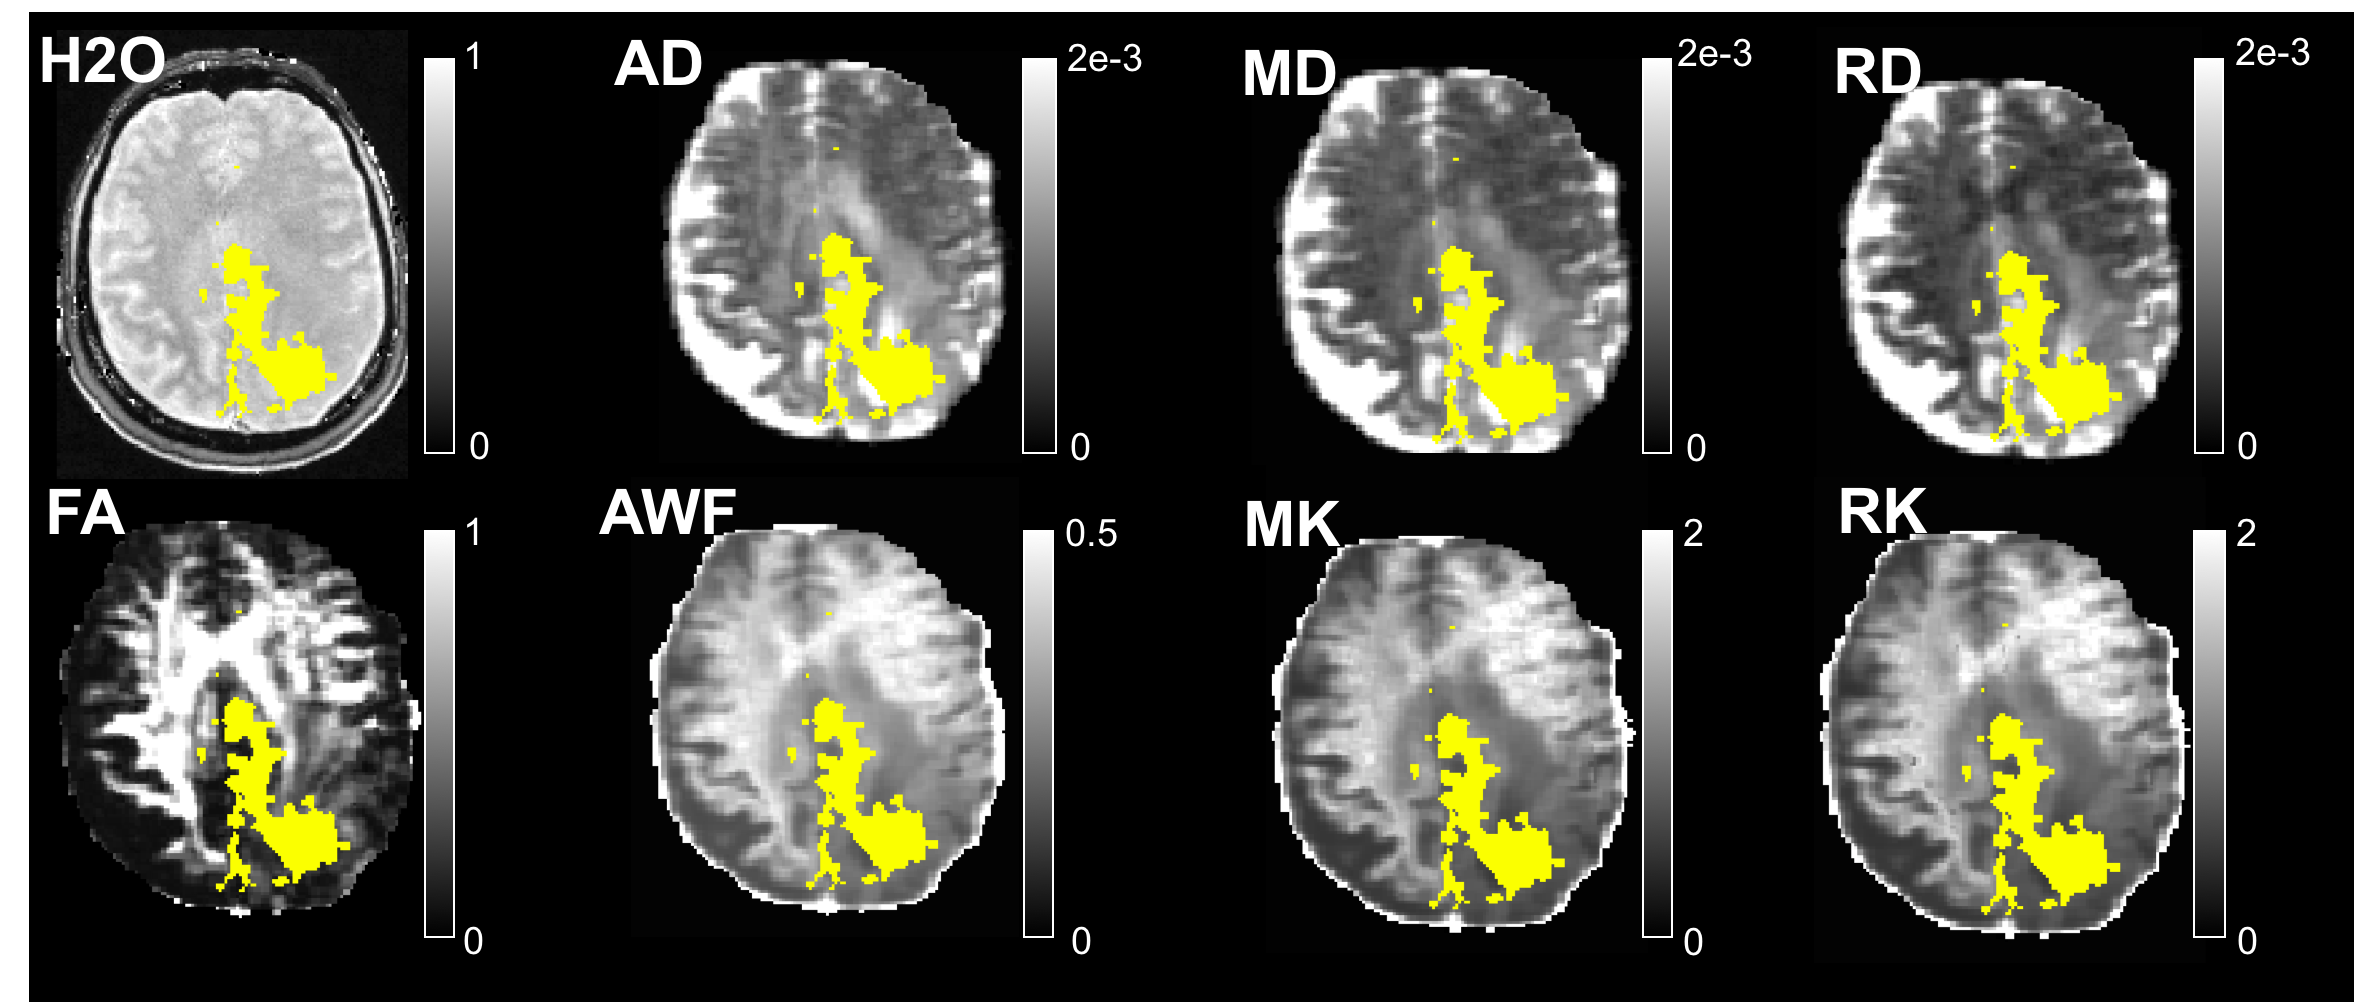
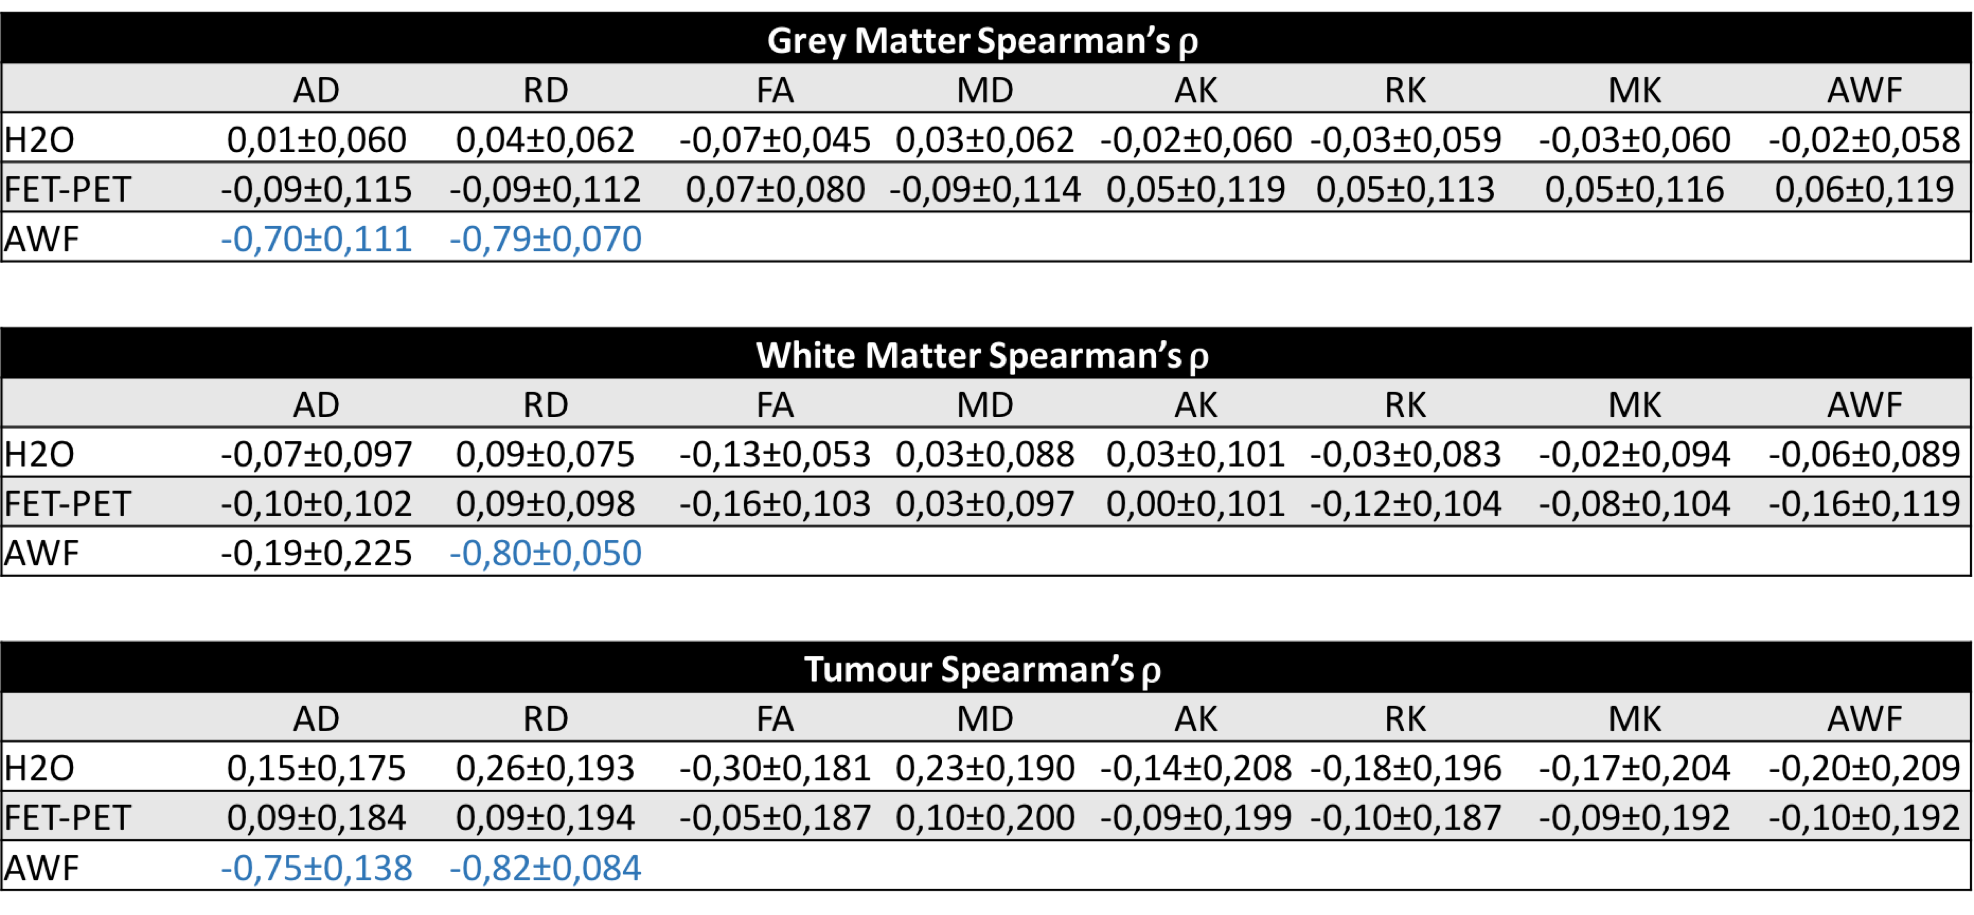
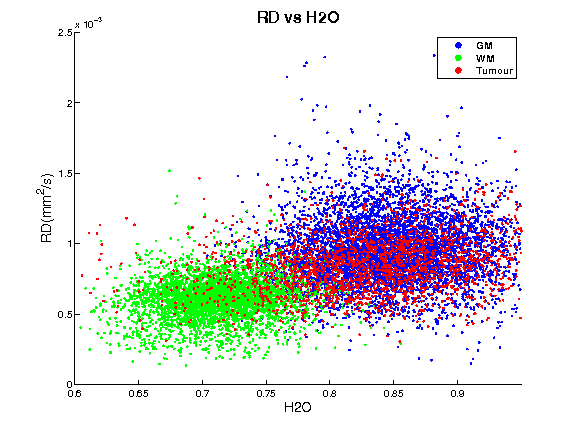
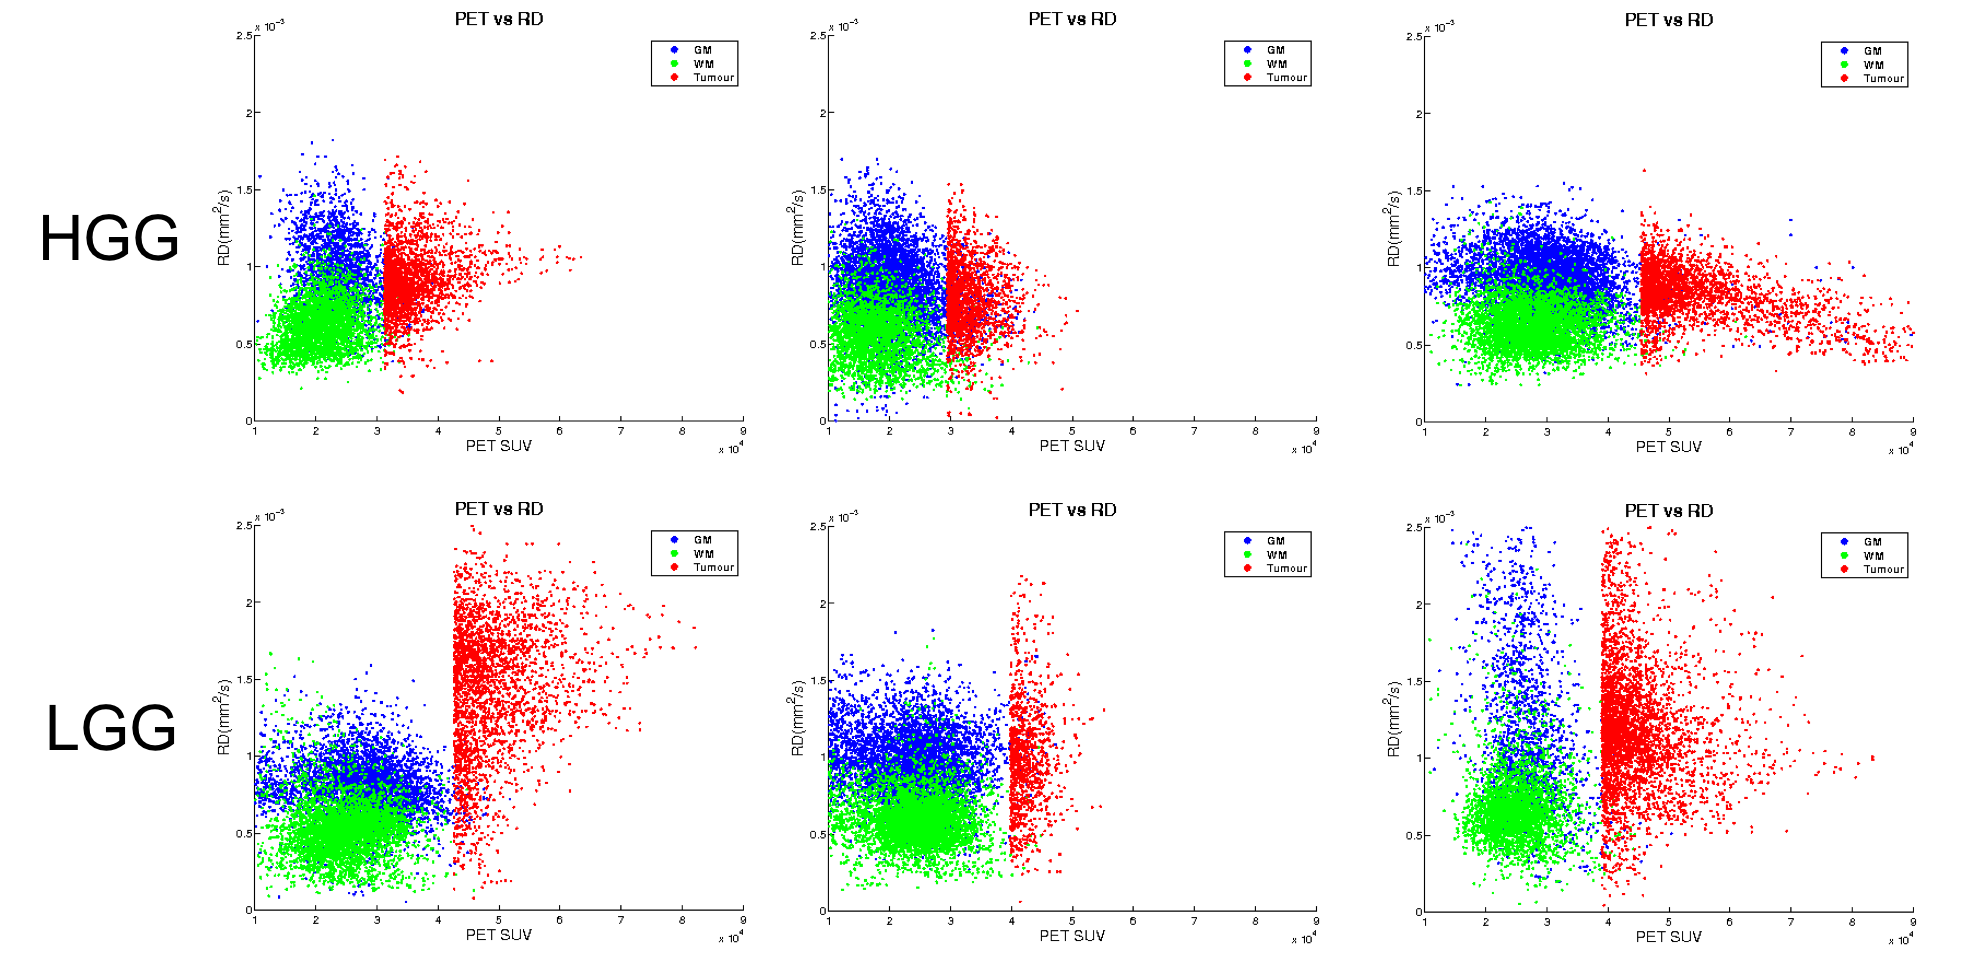
A cohort of 40 brain tumour patients was investigated (25 females, mean±std age 45,7±14,25 years). Based on histological findings, eight were firmly diagnosed with low-grade gliomas (LGG) and 10 with high-grade gliomas (HGG); for all others histology is in progress. Data were acquired on a 3T Siemens MR scanner with a Brain-PET insert. Complementing the MR-PET diagnostic protocol, a long-TR GRE scan for water content mapping1 and a DKI protocol corresponding to clinical standards were included. Imaging parameters are given in Table I. All images were coregistered into the ‘water space’. Brain images were segmented into “healthy” and “tumour” hemispheres and WM/GM classes derived from water content mapping1. Tumour masks were defined from PET. Correlations between all parameter combinations were investigated and found with few exceptions poor. The results are summarised in Table II and Figs 1-3.Results and Discussion
Radial diffusivity is regarded as a measure of myelin and MD as reflecting cellularity, especially in oncology. However, when these tissue parameters are estimated (histology, myelin water), the correlations are often weak8,9. Water content perfectly reflects its complement “protein concentration” (sum of normalised values is by definition 1) and thus can be expected to correlate well with MT measures and radial measures of diffusion. Indeed, among all other parameters, its correlation with RD was highest. For all parameters, correlations with water content within a tissue class are, however, small and the overall correlation is mainly due to the bimodal structure of water content. The only strong correlations found were between model-derived AWF and diffusion/axonal indices (AD, AK) which might reflect fitting/modelling issues. For tumours the correlation was poor, but the shape of the distribution (either horizontal or vertical and distinct from healthy tissue) might be further useful, especially if it shows changes with treatment (for example approaching that of healthy tissue). Further investigations are required to clarify this aspect.Conclusion
Despite reasonable expectations of finding some microscopic-structure-driven correlations between water, diffusion and FET parameters, compared here for the first time, low correlations were found in healthy tissue. Interestingly, the correlation between water content and diffusion indices -while still rather low - increased in tumour tissue. Importantly, this implies that each parameter reflects different aspects and thus their combination should be more powerful for oncology than using single parameters.Acknowledgements
No acknowledgement found.References
[1] Oros-Peusquens AM, Keil F, Langen KJ, Herzog H, Stoffels G, Weiss C, Shah NJ: Fast and accurate water content and T2* mapping in brain tumours localised with FET-PET. NIMA 2014; 734, 175-8.
[2] A.M. Oros-Peusquens and N. J. Shah, Proc ISMRM 2014
[3] A.M. Oros-Peusquens, Y Liao and N.J. Shah, Proc ISMRM 2016
[4] Galldiks N and Langen K-J (2016) Amino Acid PET – An Imaging Option to Identify Treatment Response, Post-therapeutic Effects, and Tumor Recurrence? Front Neurol. 7:120
[5] J. H. Jensen, J. A. Helpern, A. Ramani, H. Lu, K. Kaczynski, “Diffusion kurtosis imaging: The quantification of non-gaussian water diffusion by means of magnetic resonance imaging”, MRM, vol 53(6), pp. 1432-1440, June 2005
[6] Fieremans E, Jensen JH, Helpern JA. White matter characterisation with diffusional kurtosis imaging. Neuroimage 2011, 58:177-88.
[7] R. Neto-Henriques, R., Ferreira, H.A., Correia, M.M., 2015. United Diffusion Kurtosis Imaging (UDKI) toolbox. MAGMA 28 (S1): 511-512.
[8] Maedler B, Drabycz SA, Kolind SH, Whittall KP, MacKay AL. Is diffusion anisotropy an accurate monitor of myelination?: Correlation of multicomponent T2 relaxation and diffusion tensor anisotropy in human brain. MRI 2008; 26:874-888.
[9] Chen L. et al, The Correlation between Apparent Diffusion Coefficient and Tumor Cellularity in Patients: A Meta-Analysis. PLoS One 2013; 8:e79008
Figures