3893
Using 31P-MRI of hydroxyapatite for bone attenuation correction in PET-MRI: proof of concept in the rodent brain1DRF/I2BM/SHFJ, CEA, Orsay, France, 2DRF/I2BM/SHFJ/IMIV, CEA-Université Paris Saclay, Orsay, France, 3DRF/I2BM/MIRCen/UMR9199, CEA-CNRS-Université Paris Saclay, Fontenay-aux-Roses, France
Synopsis
Current techniques for skull attenuation correction in PET-MRI provide indirect estimates of cortical bone density, leading to inaccurate estimates of brain activity. Here we propose an alternate method based on the detection of hydroxyapatite crystals by 31P-MRI, providing individual and quantitative assessment of bone density. 31P-MRI was performed in rodent to estimate the µ-map of the skull. FDG-PET data were acquired in the same animal and reconstructed with 31P-based attenuation correction, demonstrating proper distribution of 18F activity throughout the brain.
Introduction
Attenuation correction in PET-MRI remains challenging for the bone, due to the inability of 1H-MRI to detect the crystal component of cortical bone. Neglecting bone attenuation leads to significant SUV underestimation in bone as well as in neighboring tissues (1,2), which is critical for the brain given the bone density of the skull. Original approaches have been developed to assess skull attenuation by MRI, such as atlas-based and segmentation-based methods (3). However these approaches provide indirect assessment of bone density and remain inaccurate in the vicinity of bones (4,5). This study presents a new approach for bone attenuation correction, based on 31P-MRI of hydroxyapatite crystals (6). In vivo acquisitions performed by 31P-MRI and PET-CT in rodent demonstrate the ability to quantitatively assess bone attenuation coefficients by 31P-MRI and to correct FDG-PET images of the brain for skull attenuation.Rationale
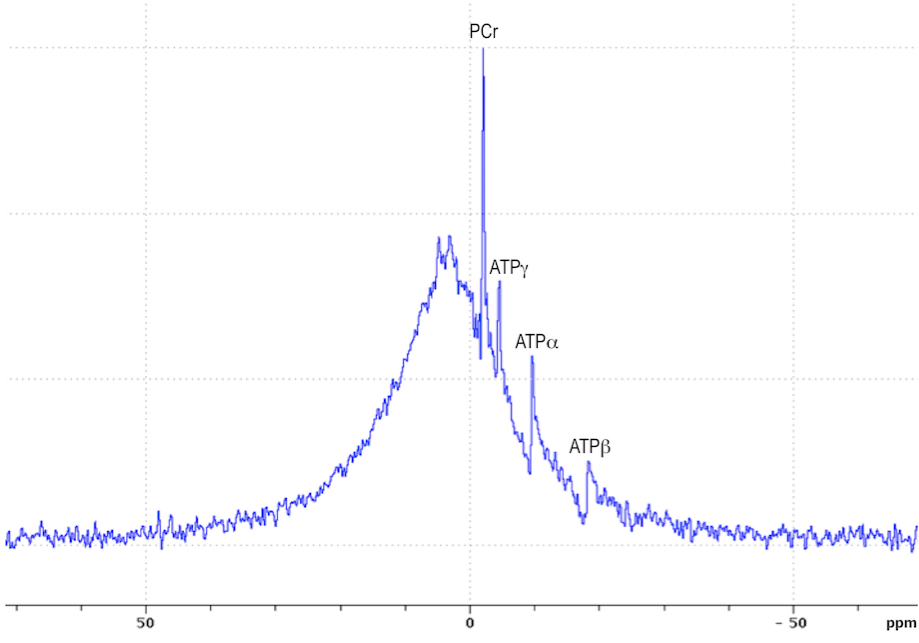
Bone crystal is made of hydroxyapatite Ca5(PO4)3OH, which high density and high atomic number explain γ-photon attenuation by cortical bone. Hydroxyapatite is undetectable by 1H-MRI in vivo, but potentially detectable by 31P NMR. The spectrum in figure 1 displays the total 31P NMR signal acquired from a rat head in vivo at 11.7T. 31P signal is dominated by a broad peak, which can unambiguously be ascribed to solid-state hydroxyapatite 31P given its short T2 (~85µs) and long T1 (~20s). Zero-TE MRI sequences have been proposed for imaging solid-state 1H nuclei (7) and demonstrated for 31P imaging of wrist bones in vivo (6). Based on these observations we hypothesized that:
• 31P-ZTE imaging of the head in vivo provides 3D images with signal intensity proportional to hydroxyapatite density,
• attenuation map (µ-map) can be derived from 31P-ZTE and used to correct PET data for γ-photon attenuation.
Materials and Methods
A Sprague-Dawley rat was anesthetized using a ~3% isoflurane/oxygen mixture twice: for a MRI session on a pre-clinical BRUKER 11.7T system and for a PET/CT session on a pre-clinical SIEMENS INVEON system. The protocol was approved by the Committee on the Ethics of Animal Experiments of the CEA. The MRI session consisted in acquiring:
• 1H conventional MRI used for registration of MRI data to PET/CT images,
• 31P-ZTE MRI (1.4mm isotropic voxel size, 15µs 200W hard pulse, 161mT/m readout gradient, 64 points sampled at 250kHz, FOV=89.6mm, TR=15ms, Tacq=53min).
The PET/CT session consisted in injecting an i.v. bolus of 93MBq 18F-FDG and acquiring:
• PET data in listmode for 60min,
• High resolution CT images for registration of MRI to PET/CT,
• Low resolution CT images for attenuation correction.
31P-ZTE signal intensity was converted into bone µ factor (“µ31P”) by application of a conversion factor determined independently on a bone sample imaged by 31P-ZTE and CT under identical experimental conditions. PET and CT images were then registered to the µ31P image. A 1st set of PET images was reconstructed with attenuation correction based on CT generated µ-map (CT-AC PET). A 2nd set of PET images with attenuation correction neglecting the bone (NoBone-AC PET) was obtained by assuming that the rat head was made of soft tissue and air only. NoBone-AC PET images provide a good approximation of Dixon-based attenuation correction. A 3rd set of PET images was obtained by adding µ31P to the attenuation map used for the 2nd set of PET images (31P-AC PET).
Results
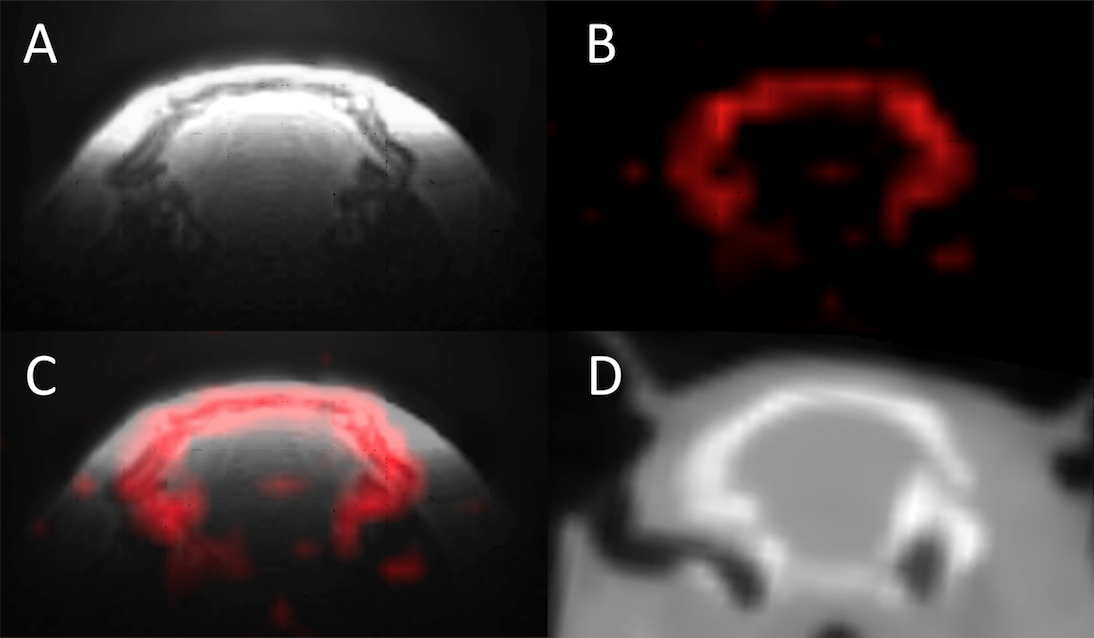
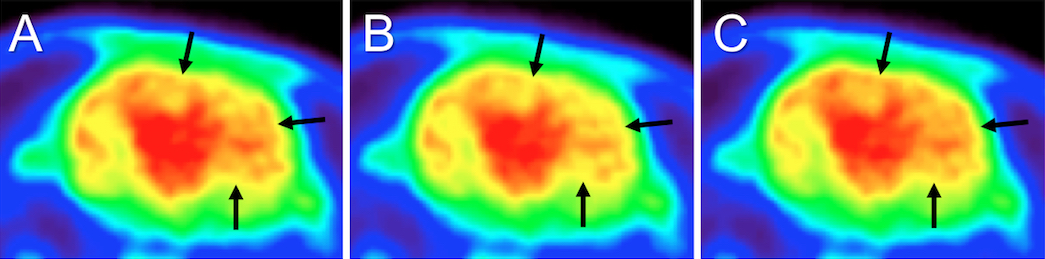
MRI and CT data acquired in vivo are shown on figure 2, illustrating the bone specificity of 31P-ZTE MRI. Figure 3B illustrates the effect of neglecting bone attenuation: 18F activity on NoBone-AC PET is underestimated in brain areas close to the bone compared to CT-AC PET (dark arrows), as reported in humans (4). The use of 31P-ZTE MRI for bone attenuation correction restores proper 18F activity distribution close to the bone, as shown on 31P-AC PET (figure 3C).Discussion
This study brings a proof of concept of skull attenuation correction based on 31P-ZTE MRI. Incorporation of 31P-derived µ-map into the attenuation correction process restores proper activity distribution throughout the brain, particularly in brain regions close to the skull. Previous studies on bone samples have demonstrated a linear relationship between 31P-NMR signal and bone density (8), so that 31P-ZTE MRI can be considered as providing quantitative images of bone density. Implementation on human hybrid PET-MRI system will be required to assess the accuracy of this approach and compare it with currently available methods such as CT-MRI atlas or short TE 1H-MRI.Acknowledgements
No acknowledgement found.References
1. Samarin A, Burger C, Wollenweber SD,
Crook DW, Burger IA, Schmid DT, et al. PET/MR imaging of bone lesions –
implications for PET quantification from imperfect attenuation correction. Eur
J Nucl Med Mol Imaging. 2012;39(7):1154–60.
2. Wagenknecht G, Kaiser H-J, Mottaghy
FM, Herzog H. MRI for attenuation correction in PET: methods and challenges.
Magn Reson Mater Phys Biol Med. 2013;26(1):99–113.
3. Cabello J, Lukas M, Rota Kops E,
Ribeiro A, Shah NJ, Yakushev I, et al. Comparison between MRI-based attenuation
correction methods for brain PET in dementia patients. Eur J Nucl Med Mol
Imaging. 2016;43(12):2190–200.
4. Dickson JC, O’Meara C, Barnes A. A
comparison of CT- and MR-based attenuation correction in neurological PET. Eur
J Nucl Med Mol Imaging. 2014;41(6):1176–89.
5. Sekine T, ter Voert EE, Warnock G,
Buck A, Huellner MW, Veit-Haibach P, et al. Clinical evaluation of ZTE
attenuation correction for brain FDG-PET/MR imaging--comparison with atlas
attenuation correction. J Nucl Med [Internet]. 2016 [cited 2016 Oct 27];
Available from: http://jnm.snmjournals.org/cgi/doi/10.2967/jnumed.116.175398
6. Wu Y, Reese TG, Cao H, Hrovat MI,
Toddes SP, Lemdiasov RA, et al. Bone mineral imaged in vivo by 31P solid state
MRI of human wrists. J Magn Reson Imaging. 2011;34(3):623–33.
7. Hafner S. Fast imaging in liquids and
solids with the Back-projection Low Angle ShoT (BLAST) technique. Magn Reson
Imaging. 1994;12(7):1047–51.
8. Wu Y, Ackerman JL, Chesler DA, Li J,
Neer RM, Wang J, et al. Evaluation of bone mineral density using
three-dimensional solid state phosphorus-31 NMR projection imaging. Calcif
Tissue Int. 1998;62(6):512–8.
Figures