3890
PET-MRI in hepatocellular carcinoma: Correlation of DCE-MRI perfusion quantification using shutter-speed model with FDG uptake1Translational and Molecular Imaging Institute, Icahn School of Medicine at Mount Sinai, New York, NY, United States, 2Advanced Imaging Research Center, Oregon Health & Science University, Portland, OR, United States
Synopsis
Shutter-speed modeling (SSM) of DCE-MRI data allows for estimation of the mean intracellular water molecular lifetime (τi), which has been suggested to be associated with tissue metabolic activity. In this study, we assessed the correlation between SSM DCE-MRI parameters and FDG-PET uptake in hepatocellular carcinoma (HCC) lesions. While Ktrans did show a significant negative correlation with the standardized uptake value (SUV) in the HCC lesions, τi was not significantly associated with FDG uptake. Our preliminary findings suggest that τi may not be associated with the up-stream tumor glucose metabolism as measured by FDG-PET.
Purpose
DCE-MRI data are typically modeled using the Tofts and Kermode (TM) model1. The TM analysis assumes infinitely fast exchange of water molecules between compartments. However, it has been found that intercompartment water exchange kinetics are not sufficiently fast to justify this assumption2. The fast-exchange regime-allowed shutter-speed model (SSM) allows for estimation of the transcytolemmal water exchange between extracellular extravascular space and intracellular space. In addition to the TM parameters, the SSM model allows for estimation of an additional parameter τi, the mean intracellular water molecular lifetime, which has been suggested to be associated with tissue metabolic activity3. In a previous study, SSM parameters have been quantified in hepatocellular carcinoma (HCC)4. The goal of this study was to correlate SSM DCE-MRI parameters with fludeoxyglucose (FDG) PET metabolic activity measurements in HCC.Methods
15 patients (M/F 11/4, mean age 61 y) with HCC underwent a PET-MRI exam (Siemens 3.0T mMR) in this prospective IRB-approved study. Approximately one hour before the exam, an intravenous dose of 0.14 mCI/kg FDG was administered. DCE-MRI consisted of an axial 3D FLASH acquisition (TE 0.98 ms, TR 2.87 ms, FA 10°, slice thickness 4.5 mm, 44 slices, FOV 400x300 mm2, matrix 384x288, mean temporal resolution 4.5 s) during injection of 0.05 mmol/kg of Gd-BOPTA (Multihance). The DCE signal intensity curves were converted to dynamic R1 curves by the SPGR equation using pre-contrast T1 values from a separate Look-Locker acquisition. SSM modeling of the dynamic R1 curve was performed for regions of interest (ROIs) in liver parenchyma and HCC lesions to estimate arterial fraction (ART), transfer constant (Ktrans), extravascular extracellular volume fraction (ve), rate constant (kep) and τi. Standardized uptake parameter (SUVmean and SUVmax) values in liver and HCC were obtained from the PET measurements. The MRI and PET ROIs were matched as closely as possible. Lesions were considered FDG-avid if SUVmean in the lesion was higher than in the background liver parenchyma. Parameters were compared between liver and HCC using Wilcoxon signed-rank tests. Pearson correlation tests were used to assess the correlation between DCE-MRI and SUV data in the liver parenchyma, in all HCC lesions and in FDG-avid HCC lesions.Results
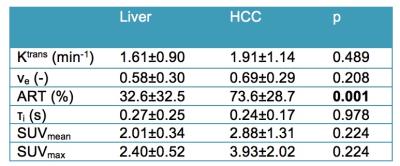
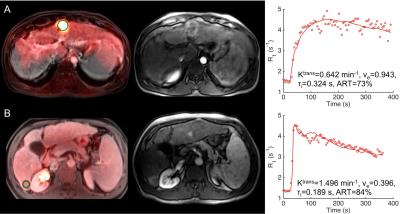
21 HCCs (mean size 4.0±2.5 cm) were assessed, of which 9 (43%) lesions were FDG-avid. Average parameter values in liver and HCC lesions are shown in Table 1. ART was significantly higher in HCC vs. liver, while the SUV measurements and other DCE-MRI parameters were not significantly different between liver and HCC. Figure 1 A and B show representative PET-MRI overlays, DCE-MRI images and fitted curves for HCC lesions that showed significant and non-significant FDG uptake, respectively. HCC lesions with high FDG uptake were generally characterized by lower perfusion, resulting in an observed significant negative correlation between Ktrans and SUVmax in this HCC lesion cohort (r=-0.434, P=0.050). No other significant correlations between DCE-MRI parameters and SUV data were observed in HCC lesions, FDG-avid HCC lesions and liver parenchyma.Discussion and Conclusion
Both DCE-MRI and SUV values were similar between liver and HCC, except for the anticipated significantly higher ART in HCC5. The observed significant negative correlation between Ktrans and FDG uptake in HCC may be secondary to increased anaerobic metabolism in high grade HCC6. τi is thought to be mainly influenced by active transport of water molecules across the cell membrane3. A potential reason for the lack of correlation between τi and SUV could be due to the fact that FDG-PET measures cellular uptake of glucose, whereas τi is mainly dictated by Na+,K+-ATPase activity sustained by ATP production, a down-stream effect of the glucose uptake3. The relatively short TR used in the DCE-MRI measurements may also have affected the sensitivity of the DCE-MRI acquisition to water exchange7. Altogether, our preliminary findings suggest that τi may not be associated with the up-stream tumor metabolism as measured by FDG-PET. This finding needs to be verified in future studies of larger cohorts and different tumor types, employing DCE-MRI acquisition parameters that maximize sensitivity to water exchange.Acknowledgements
We would like to acknowledge the support of NCI grant 1U01CA172320-01.References
1 Tofts PS, Kermode AG. Measurement of the blood-brain barrier permeability and leakage space using dynamic MR imaging. 1. Fundamental concepts. Magn Reson Med 1991;17(2):357-67.
2 Landis CS, Li X, Telang FW, et al. Equilibrium transcytolemmal water-exchange kinetics in skeletal muscle in vivo. Magn Reson Med 1999;42(3):467-78.
3 Springer CS, Jr., Li X, Tudorica LA, et al. Intratumor mapping of intracellular water lifetime: metabolic images of breast cancer? NMR Biomed 2014;27(7):760-73.
4 Jajamovich GH, Huang W, Besa C, et al. DCE-MRI of hepatocellular carcinoma: perfusion quantification with Tofts model versus shutter-speed model--initial experience. Magn Reson Mater Phy. 2016;29(1):49-58
5 Yang ZF, Poon RT. Vascular changes in hepatocellular carcinoma. Anat Rec 2008;291:721-734
6 Ahn SJ, Park MS, Kim KA, et al. 18F-FDG PET metabolic parameters and MRI perfusion and diffusion parameters in hepatocellular carcinoma: a preliminary study. PLoS One. 2013;8(8):e71571
7 Li X, Huang W, Morris EA, et al. Dynamic NMR effects in breast cancer dynamic contrast-enhanced MRI. Proc Natl Acad Sci U S A. 2008;105(46):17937-42.
Figures

